Internet Dependency in Bioinformatics: Risks of Web-Based Platforms
By Dr. Zubair Khalid, DVM, MS, PhD ·

Internet dependency in bioinformatics is now structural. A large share of sequence analysis, proteomics processing, methylation calling, molecular docking, and microbiome statistics runs through web platforms that require nothing more from the user than a browser and an active connection [1]. That ease of access is exactly what makes the dependency risky. When the connection drops, the server goes down, the URL dies, or the underlying tool version changes without notice, an entire analysis stops, and sometimes the intermediate files that made the analysis reproducible stop with it.
The most likely failure cause, in practice, is the simplest one. Before suspecting a broken platform, check your own network path first. Open two unrelated external websites in the same browser. If neither loads, the problem is local connectivity, not the bioinformatics service. If both load but the analysis platform does not, move to the structured troubleshooting table later in this article and work from the top down. Most incidents resolve in the first three rows.
This article explains why web-based platforms came to dominate bioinformatics, what fails when internet dependency bites, how to diagnose each failure mode in order of likelihood, and which solutions, from hybrid containerized deployments to self-hosted servers, restore control without giving up the convenience that made web platforms popular in the first place.
Why Bioinformatics Became Dependent on Web Platforms
The shift toward web-based tools was not accidental. Several forces pushed the field in this direction, and understanding these causes clarifies why the risks exist.
Installation friction was the original driver
Scientific software has historically been difficult to install and run. The authors of the ZBIT Bioinformatics Toolbox identified the core problems directly: dependencies on specific operating systems, required third-party libraries, missing graphical user interfaces and documentation, and nonstandard input and output formats [1]. A researcher who wanted to run a single transcription factor analysis on a Linux cluster first had to resolve compiler versions, library paths, and file format quirks that had nothing to do with the biology.
Web platforms eliminated that friction entirely. The ZBIT platform, built on a customized Galaxy instance running on a dedicated compute cluster, requires only a browser and an active internet connection [1]. The trade is explicit. Convenience on the user side is purchased with dependence on a server the user does not control.
The expertise barrier pushed analysis into browsers
Next-generation sequencing brought a wave of experimental biologists who needed analyses but lacked command-line training. Li and colleagues described the problem precisely when introducing the EDGE platform. A number of factors prevent seamless use of sequencing data, including the breadth of project goals, the wide array of tools that each perform only fractions of an analysis, the large number of software and hardware dependencies, and the detailed expertise required to perform the work [2]. Their answer was a web environment with preconfigured workflows that let novice users execute complex analyses with a few mouse clicks [2].
The same motivation recurs across the literature. H3NGST automates end-to-end ChIP-seq analysis, from raw data retrieval by BioProject ID through quality control, alignment, peak calling, and annotation, specifically to remove the need for manual file processing and deep bioinformatics expertise [3]. RNAseqChef was built because comprehensive transcriptomic analysis of multiple RNA-seq datasets is laborious without bioinformatics training [4]. SimpleMicrobiome integrates taxonomic profiling, diversity analysis, differential abundance testing with ANCOM-BC2 and MaAsLin2, Random Forest modeling, and network inference into a single interactive interface because routine use of those methods otherwise depends on command-line workflows and repeated data reformatting [5]. DOCKweb wraps the DOCK6 molecular docking code in a React.js and Express.js interface so users no longer need to download and compile the program or hold a local supercomputer account, since calculations run at the Texas Advanced Computing Center [6].
Data fragmentation demanded centralized access
A second class of web platform exists not to run analyses but to centralize scattered data. The Tef Database (TefDB) was developed because Eragrostis tef, an indigenous Ethiopian cereal crop, lacked a unified resource, and that gap produced data fragmentation that hindered genomic research and crop improvement. TefDB integrates 77,795 tef-specific biological records, including 6,144 genome-related records, 66,455 gene models, and 3,447 protein sequences, built on React.js, Django, Python, and PostgreSQL [7]. The same centralization logic drives platforms such as HTT-OMNI, which unifies roughly 3,400 candidate huntingtin interactors with associated transcriptome and proteome measurements so researchers do not have to reassemble the evidence piecemeal [8].
Scale made local processing impractical
Proteomics illustrates the scale problem. Schneider and colleagues note that conventional processing workflows consist of fragmented software packages glued together with complex in-house scripts or error-prone manual steps running on local hardware that is costly to maintain and scale [9]. Managed cloud platforms answer this with elastic compute, scalable storage, and API-driven services that cover the path from raw instrument files to statistical visualization [9].
Every one of these causes points in the same direction. The field moved analysis off the local machine and onto infrastructure reached over a network. That is the root of internet dependency in bioinformatics, and it is why the failure modes described next all trace back to the network path, the remote server, or the version of software running somewhere the user cannot see.
What Actually Breaks: The Risk Profile of Web-Based Analysis
When a lab bets its analysis on a web platform, it accepts risks in five categories. Naming them precisely makes each one diagnosable.
- Availability risk. The platform requires an active internet connection by design [1]. If the connection, the server, or any intermediate gateway fails, the analysis stops.
- Data custody risk. Raw reads, clinical metadata, or proprietary sequences are uploaded to hardware the lab does not own. Access controls, retention policies, and jurisdiction are decided by the host, not the researcher.
- Reproducibility risk. A web server may silently update the alignment algorithm, reference genome, or statistical library between two runs of the same workflow. Locally pinned software cannot change under you. A remote service can.
- Continuity risk. Web servers have a documented history of disappearing. When a lab's only copy of an analysis lives inside a retired server, the analysis is effectively lost.
- Access and compliance risk. Institutional firewalls, authentication changes, and data governance rules can block access to a platform that is technically healthy.
A brief safety note applies to the data custody risk. Uploading human-derived sequence data, patient-linked metadata, or unpublished proprietary genomes to a third-party web server may violate institutional data use agreements, HIPAA obligations for clinical data, or funder policies. Before uploading any dataset to an external platform, confirm with your institutional data office that the transfer is permitted, and prefer platforms that keep processing inside your own institution when the data carry identifiers.
Troubleshooting Table: Symptoms, Causes, and Fixes
Work this table from the top. The rows are ordered from most to least common.
| Symptom | Likely cause | How to confirm | Fix |
|---|---|---|---|
| No platform loads, browser shows a generic connection error | Local internet outage, VPN failure, or campus network drop | Open two unrelated external sites. If both fail, the fault is local. Run a second device on the same network as a cross-check | Restore the local connection, switch to a wired link or a different network, then retry the analysis |
| The platform homepage loads but the analysis job hangs at file upload | Interrupted or throttled upload of a large raw data file | Check the file size against any stated upload limit. Retry with a smaller test file. Watch the upload progress indicator | Compress or subsample for testing, upload from a wired connection, split large files, or use the platform's command-line or API client if one exists [9] |
| Submitted job sits in a queue for hours | Server-side compute capacity is saturated | Check the platform's status page, announcement banner, or user forum. Compare with a trivially small test job | Wait out the queue, resubmit during off-peak hours, or move the workload to a local or containerized version of the same tools |
| Browser shows a gateway or timeout error mid-run | Reverse proxy or load balancer timeout on a long-running request | Note whether the error recurs at a consistent elapsed time, which indicates a fixed proxy timeout rather than a random failure | Split the workflow into shorter stages, or switch to an interface that decouples submission from result delivery, such as an API client [9] |
| Results from last week are gone | Session-scoped or time-limited result storage | Look for a stated retention window in the platform documentation. Check whether a permanent user account existed or the run used an anonymous session | Register an account, download and archive all outputs immediately after each run, and never treat a web server as long-term storage |
| The same input now gives different results than last month | Silent software or database version change on the server | Compare tool version labels in old and new reports. Contact the administrators if versions are not published | Pin the analysis to a documented version, archive the exact output, and prefer platforms that expose version numbers in every report |
| The tool's URL returns an error or redirects to a unrelated page | Link rot. The server was retired or moved | Search the tool name plus the year of the original publication to find a successor host or archived distribution | Locate a mirror, the original publication's supplementary material, or a container image that reproduces the tool locally |
| The platform works off campus but not from a lab machine | Institutional firewall, proxy, or authentication policy | Test the same URL from a personal device on a home network. Ask your IT office whether the domain is blocked | Request an exception through IT, use the institution's VPN, or deploy the tool inside your own perimeter |
| The interface behaves unpredictably or renders incorrectly | Browser-specific incompatibility or blocked scripts | Try a second browser and confirm that scripts and cookies are allowed for the platform's domain | Standardize the lab on a documented browser version for that platform, and report persistent incompatibilities to the maintainers |
| A CLI client or API script that worked before now fails | The remote API changed version or deprecated an endpoint | Read the release notes or changelog on the platform's documentation site | Update the client to the current API version, and pin the client version in your project's dependency file |
Failure Modes Explained, From Most Common to Rarest
1. Local and institutional connectivity failures
The most frequent cause of a "broken platform" is a network path that never reached the platform. Wireless dropouts, VPN certificate expirations, captive portals on conference and hotel networks, and campus firewall rules all produce the same symptom from the user's point of view. The mechanism is simple. A web platform such as the ZBIT Bioinformatics Toolbox states its requirement openly. Users need a browser and an active internet connection [1]. Break either, and the entire tool chain is unreachable no matter how healthy the server is.
Institutional networks add a second layer. Research hospitals and universities commonly filter outbound traffic by domain category, and computational biology domains are sometimes misclassified. The diagnostic cross-check matters here. If external sites load on a personal device but not from the lab network, the platform is innocent and the fix belongs to your IT office.
2. Server-side downtime and capacity saturation
Web platforms run on real hardware with finite capacity. Platforms that serve bursty academic traffic, such as a newly published tool after a paper announcement, routinely queue jobs or refuse connections at peak. The H3NGST platform advertises scalability for high-throughput studies, and mobile accessibility as a feature, but scalability claims do not exempt a service from the physics of its hosting budget [3].
Two mechanisms matter. First, hard downtime, where the host machine, certificate, or domain registration fails. Second, soft saturation, where the service responds but jobs queue indefinitely. The confirmation step differs. Hard downtime gives immediate connection errors. Soft saturation gives accepted submissions with no progress for hours. The fix for soft saturation is often simply timing. Resubmit overnight or move to a platform-independent alternative while you wait.
3. Upload and transfer limits
High-throughput data are large. A single lane of raw sequencing output or a raw proteomics run can exceed what a browser upload handles gracefully. Platforms differ in how they solve this. H3NGST sidesteps bulk upload for public data by retrieving raw files directly from a BioProject ID on the server side, which "eliminates the need for local installations, programming skills, or large file uploads" [3]. Managed proteomics platforms accept raw files through command-line clients and APIs rather than browser forms [9].
If your only interface is a browser form and your file is large, the failure shows up as stalls, truncated uploads, or gateway timeouts. The fix is architectural. Prefer platforms that provide a CLI or API path for bulk transfer, and stage large public datasets on the server side through accession identifiers whenever the platform supports it [3] [9].
4. Ephemeral sessions and lost results
Many small web servers store results only for the duration of a session or a short retention window. The mechanism is cost. Persistent storage for every anonymous visitor is expensive, so results are purged. The ZBIT platform explicitly stores all results persistently within its Galaxy framework [1], which is an architectural choice, not a universal default. Smaller servers often lack it.
The failure is silent and severe. A researcher closes the browser, returns two weeks later to download a figure, and finds the job history empty. The fix is procedural, not technical. Download every output, including logs and intermediate tables, at the end of every session. Treat the web server as a transient compute resource, never as an archive.
5. Silent version drift and reproducibility failure
This is the risk that damages science most even though it produces no error message. A local pipeline with pinned tool versions produces byte-identical results on rerun. A web server can update its underlying software, reference databases, or default parameters between your first and second analysis, and nothing in the interface may tell you.
The platforms that take reproducibility seriously expose their internals. EpiMOLAS wraps its whole-genome bisulfite sequencing workflow in a Docker container image called DocMethyl, so users can deploy an executable environment without library dependency problems, and explicitly aims to help users conduct reproducible analyses [10]. PeptideShaker Online runs its processing through the Galaxy platform via SearchGUI, PeptideShaker, and moFF, and publishes its source code and documentation on GitHub [11]. Workflow recording systems such as the BioExtract Server capture the analytic steps a researcher performed, including queries and tool executions, and save them as a named, reusable computational workflow [12]. These designs convert a black box into a rerunnable record.
When you must use a platform that does not publish versions, protect yourself by archiving the full output report, which often embeds version strings, and by recording the submission date in your lab notebook. If results change, you will at least be able to detect the drift rather than wonder about it.
6. Link rot and platform retirement
Web servers are mortal. Funding ends, postdocs move on, and hosting hardware ages. The literature records this indirectly. Older tools such as CAPITO for circular dichroism analysis and PESCADOR for text-mined biointeraction networks were published with specific URLs that are frequently cited and, like many academic web services, are vulnerable to eventual retirement [13] [14]. The DbD2 disulfide engineering tool is hosted on a university web server, a common pattern for tools whose longevity is tied to a single laboratory's infrastructure [15].
The mechanism of failure is total. When the host disappears, the interface, the compute, and the stored parameters go with it. Recovery options, in order of preference, are a successor host announced by the original authors, the published source code, and a container image. This risk is the strongest argument for preferring platforms that publish code, because a platform whose source is on GitHub can be resurrected even after its public URL dies [11] [16].
7. Browser dependency and interface constraints
A subtler failure class lives inside the browser itself. JS-MS 2.0 advertises a dependency-free, browser-based solution for viewing and editing mass spectrometry ground truth data [16], and tools built as single-page applications, such as TefDB's React.js frontend [7], depend on JavaScript engines executing current standards. Blocking scripts, aggressive privacy extensions, outdated browsers on managed lab machines, and cookie restrictions all produce partial or broken interfaces that look like server faults.
Mobile access introduces its own quirks. H3NGST highlights mobile accessibility as a usability extension [3], but touch interfaces and small viewports are poor environments for verifying a peak table or a differential abundance plot. Treat mobile access as a convenience for status checks, not as the environment where you validate results.
8. Governance, authentication, and single-point administrative failure
The rarest but most disruptive failures are administrative. A platform changes its authentication provider and your institutional single sign-on no longer federates. A service moves behind a paywall. An acceptable-use policy change excludes commercial research. None of these are network faults, but from the researcher's chair they are indistinguishable from a dead platform until you read the announcement.
Self-hosting is the structural answer. A version control platform deployed on a dedicated local server for bioinformatics and AI education demonstrates the pattern. It is based on the Git ecosystem as a decentralized version control system, enables repository management and secure access control, and supports course and tool development entirely inside the institution's perimeter [17]. The same logic applies to analysis platforms. A Galaxy instance behind your own firewall never notices when someone else's funding ends.
A Short Diagnostic Sequence You Can Follow
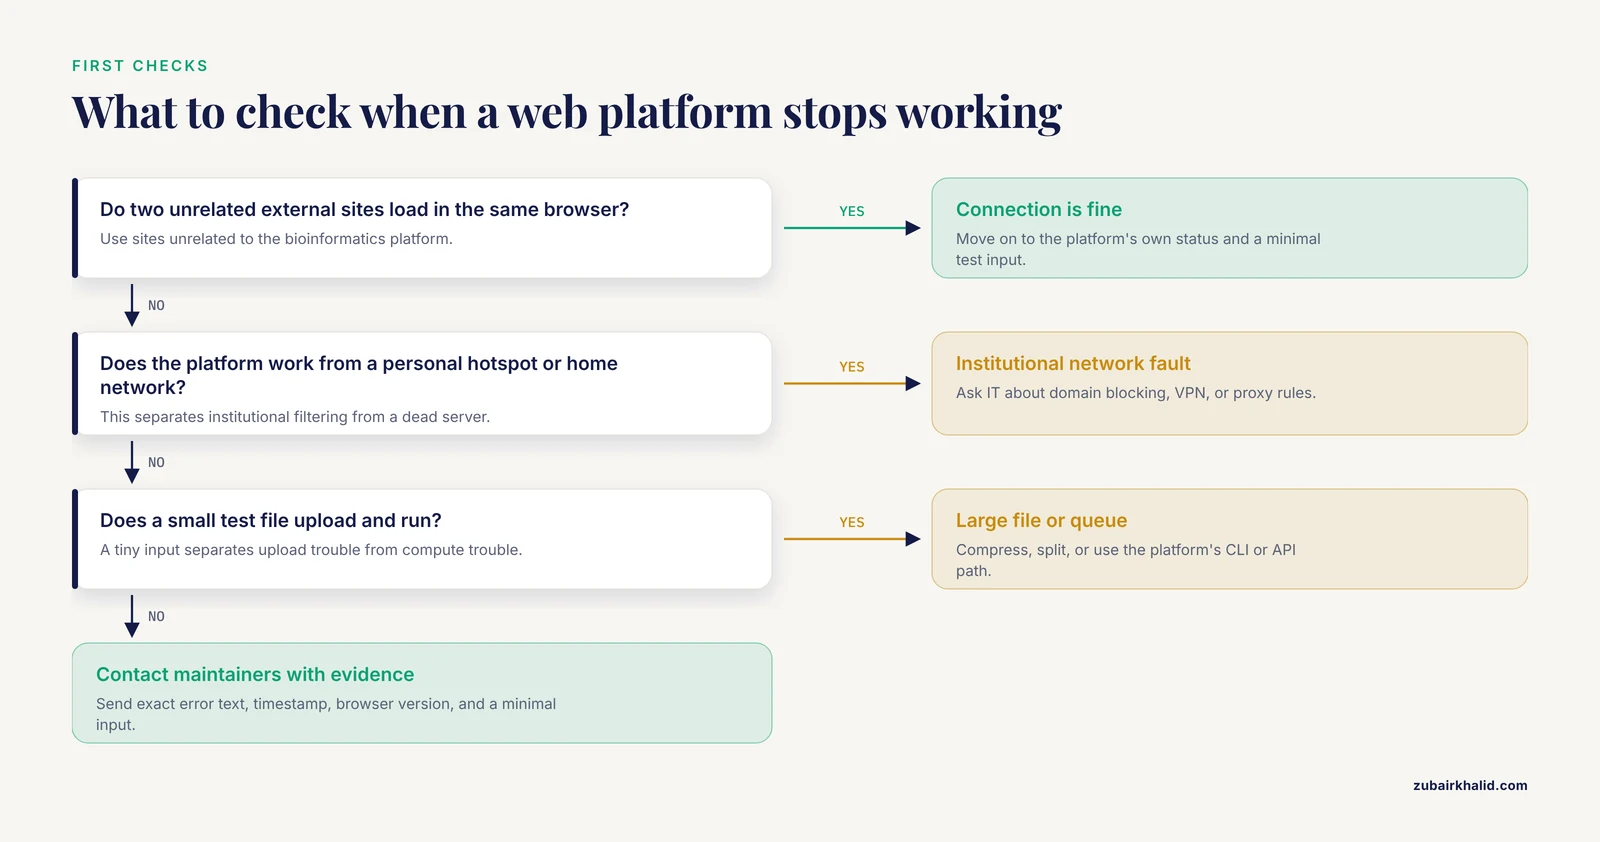
When a web platform fails, run this sequence before contacting anyone.
- Confirm general connectivity with two unrelated external sites in the same browser.
- Confirm the platform's own status. Check its documentation site, status page, or associated social channel for outage announcements.
- Retry with a minimal input. A small test file distinguishes an upload problem from a compute problem in under a minute.
- Switch browsers, and disable extensions for the platform's domain.
- Test from a different network, such as a personal hotspot, to rule out institutional filtering.
- Check whether the failure is reproducible at the same elapsed time, which points to a proxy timeout rather than random instability.
- Look for version information in your archived outputs and compare it with the current report before concluding that results changed.
- Search for the tool by name and publication year if the URL itself is dead, to find a mirror, successor, or source distribution.
- Contact the maintainers only after steps 1 through 8, and include the exact error text, timestamp, browser version, and a minimal reproducible input. Reports built this way get answered.
How to Fix Internet Dependency: Solutions That Work
The causes of internet dependency in bioinformatics are baked into how the field adopted web platforms, so fixes operate at the architecture and workflow level rather than the settings level. These are the solutions with documented precedent.
Prefer hybrid architectures for critical pipelines
The strongest pattern in the literature pairs local processing with a web layer. EpiMOLAS splits its whole-genome bisulfite sequencing framework in two. The compute-heavy phase runs in a Docker container, DocMethyl, that users deploy locally without dependency headaches, and only the downstream annotation and analysis phase runs on the EpiMOLAS web server [10]. PeptideShaker Online inverts the arrangement. Storage and processing run through Galaxy, while the interactive result exploration happens via a locally installed web server, letting researchers process and interpret their own data without direct access to compute-intensive infrastructure [11].
The lesson generalizes. Put the steps that must never stop, such as raw data processing on irreplaceable samples, on infrastructure you control. Reserve the web layer for steps that can be repeated on demand.
Use containers to make any tool relocatable
Docker containerization solves the original problem that pushed tools onto the web in the first place, the dependency and installation burden, without surrendering control to a remote host [10]. A container image pins the operating system libraries, tool versions, and reference paths. If a public server retires, a containerized equivalent can run on your lab workstation, your institutional cluster, or a cloud account you own.
Keep clients and APIs under version control
Platforms that expose command-line clients and APIs, such as the MSAID proteomics platform with its CLI client and API access alongside the web interface [9], are inherently more fixable than browser-only services. When an API changes, you update a pinned dependency and your pipeline resumes. Pin the client version in your project's dependency file, and record the API version alongside every archived result.
Record workflows, not just results
The BioExtract Server demonstrated a practical safeguard for distributed analysis. As a researcher queries databases and executes local and web-accessible tools, the system records the tasks, and the recorded series can be saved as a named computational workflow with a description [12]. A saved workflow is a recovery asset. If a component service disappears or changes, the workflow document tells you exactly what to reproduce elsewhere. Adopt the same discipline manually if your platform lacks it. A text file that lists every tool, parameter, input file, and submission date is the minimum viable workflow record.
Self-host when governance or continuity demands it
Self-hosted deployment is no longer exotic. A web-based, self-hosted version control platform built on the Git ecosystem has been implemented specifically to give an academic setting comprehensive repository management, secure access control, and collaborative development without dependence on external services [17]. The same model applies to Galaxy instances and Shiny applications. SimpleMicrobiome is implemented as a modular R Shiny application [5], which means an institution with R capability can host the same analytical modules locally. Hosting the tool yourself converts a continuity risk into a maintenance obligation, which is usually the correct trade for pipelines your laboratory depends on daily.
Archive results outside the platform immediately
Every session should end with the same three actions. Download all outputs, including logs, parameter summaries, and intermediate tables. Store them in your institutional or project version control system. Note the platform URL, tool version if published, and submission timestamp. This costs minutes and removes the two most damaging silent failures, ephemeral results and undetectable version drift.
Bioinformatics Tools Comparison by Deployment Model
Choosing where a tool runs is now as consequential as choosing which tool runs. This bioinformatics tools comparison organizes the deployment models represented in the current literature and their failure exposure.
| Deployment model | Representative examples | Strengths | Main failure exposure | Reproducibility posture |
|---|---|---|---|---|
| Public web server | EDGE [2], RNAseqChef [4], CAPITO [13], PESCADOR [14], DbD2 [15] | Zero installation, browser-only access [1], low training barrier | Connectivity, downtime, link rot, ephemeral results | Weak unless versions are published and results archived |
| Web frontend over remote compute | DOCKweb submitting to TACC [6], H3NGST [3] | Removes local install and local supercomputer requirements [6] | Queue saturation, transfer limits, proxy timeouts | Moderate if the platform reports tool versions |
| Managed cloud platform | MSAID proteomics platform [9] | Elastic scale, unified API-driven services, data lake storage [9] | Vendor dependency, cost, contract continuity | Strong if API versions are pinned |
| Container plus web hybrid | EpiMOLAS (DocMethyl plus web server) [10], PeptideShaker Online over Galaxy [11] | Local control of heavy compute, code published for resurrection [11] | Local maintenance burden | Strong. Containers pin the environment [10] |
| Local browser application | JS-MS 2.0, dependency-free and browser-based [16] | No server dependency at runtime, MIT-licensed source [16] | Browser engine updates | Strong. The code is in your hands |
| Self-hosted institutional platform | Git-based teaching and development platform [17], institutional Galaxy | Data never leaves the perimeter, immune to external retirement [17] | Local hardware and staffing | Strong with internal version control |
| Centralized data resource | TefDB [7], HTT-OMNI [8], BioExtract Server [12] | Solves data fragmentation, integrates distributed sources [12] | Database funding continuity, API stability | Moderate. Depends on published record versions |
Reading this table, the pattern is consistent. The more a platform does for you, the more of your analysis lives on infrastructure you cannot inspect, restart, or archive. The best bioinformatics software choice for a one-off exploratory question is often a public web server. The best choice for a pipeline that feeds a publication or a clinical decision is a containerized or self-hosted deployment of tools whose code and versions you can pin.
Choosing the Best Bioinformatics Software for Resilient Work
Evaluate any candidate platform against five questions before you commit a project to it.
- Does it work without the public internet? If the platform offers a container, a downloadable application, or a self-hosted mode, you have an escape route. JS-MS 2.0 is the extreme case, a dependency-free browser application that needs no server at runtime [16].
- Does it publish its versions? Reproducibility starts with knowing what ran. Platforms that display tool and database versions in their reports deserve preference [10].
- Does it offer an interface beyond the browser? API and CLI access means automatable, retryable, and archivable analyses [9].
- Does it publish its source code? Source on a public repository means the tool survives the death of its host [11] [16].
- Where does your data live, and under whose policy? For human-derived or proprietary data, a locally installed web server keeps custody with you [11].
A pragmatic laboratory strategy uses web platforms for what they are good at, rapid access to curated databases and preconfigured workflows [2] [7], and keeps the irreplaceable steps, raw data custody and final publication analyses, on infrastructure the lab controls.
Common Mistakes and Limitations
These are the errors that recur when laboratories adopt web platforms, stated so you can avoid them rather than rediscover them.
- Treating a web server as an archive. Results on servers without persistent storage disappear. The persistent-storage guarantee in some Galaxy-based platforms [1] is the exception, not the rule. Download everything, every time.
- Running publication-critical analyses only through a public server with no local fallback. If the server retires during revision, you cannot regenerate a figure. Keep a containerized or locally installed equivalent for the final analyses.
- Assuming identical inputs mean identical outputs. Server-side software updates change results silently. Archive version information with every result set and compare across reruns.
- Uploading restricted data without checking policy. Human-derived data subject to HIPAA, patient-linked metadata, and contractually restricted sequences require institutional approval before they touch a third-party server. This is a compliance failure, not a technical one, and it is not reversible after the upload.
- Reporting failures without evidence. A support request that says "the site is down" gets a slower answer than one that includes the exact error text, timestamp, browser, and a minimal reproducible input.
- Confusing browser faults with server faults. Many "the tool is broken" reports are script blockers, cookie restrictions, or outdated managed-lab browsers. The two-browser test separates these in seconds.
- Ignoring the mobile caveat. Verifying a peak table or a differential abundance result on a phone screen invites errors. Use mobile access for status checks [3] and validate results on a full workstation.
- A limitation of the evidence itself. The published platforms cited here describe their intended benefits and architectures, but most papers do not report uptime statistics, incident histories, or long-term retirement data. Claims about availability in this article are therefore qualitative and drawn from documented design properties, not from audited service metrics. Individual research contexts differ, and decisions about data placement and platform choice should involve your institution's data governance and IT staff.
Frequently Asked Questions
What does internet dependency mean in bioinformatics?
It means that a bioinformatics analysis cannot run unless a network path connects your browser or client to a remote server that hosts the data, the software, or both. The ZBIT Bioinformatics Toolbox states the requirement plainly, a browser and an active internet connection [1], and that pattern now covers everything from ChIP-seq pipelines to docking interfaces.
Why did bioinformatics move toward web-based platforms?
Because local scientific software was hard to install and hard to use. Documented causes include operating system dependencies, third-party library conflicts, missing graphical interfaces, and nonstandard file formats [1], combined with the expertise barrier facing experimental researchers who needed complex analyses without command-line training [2] [5].
What is the first thing to check when a web platform stops working?
Check your own connectivity first. Open two unrelated external websites in the same browser. If both fail, the problem is local. If both load, move on to the platform's status page and then the structured troubleshooting sequence in this article.
How do I make a web-based analysis reproducible?
Record what ran. Archive the full output report, capture any published tool and database versions, save the submission date, and prefer platforms that expose versions or run inside containers that pin the environment [10]. Workflow recording systems that save analytic steps as reusable workflows serve the same purpose [12].
Are web platforms safe for sensitive research data?
Only after verification. Uploading human-derived or contractually restricted data to a third-party server may breach institutional data use agreements or privacy law. Confirm with your data office first, and for sensitive datasets prefer locally installed web servers that keep processing and storage inside your own institution [11].
What is the best bioinformatics software deployment for a small lab?
Use a layered strategy. Public web servers and centralized databases are excellent for exploration and data access [7]. For publication-critical pipelines, the best choice is a hybrid, heavy compute in a container you control with a web layer for visualization, following the pattern set by EpiMOLAS [10] and PeptideShaker Online [11].
How do I recover an analysis when a web tool's URL goes dead?
Search the tool name together with its original publication year to find a successor host, a mirror, or the authors' archived distribution. If the source code was published, deploy it locally, ideally as a container. Platforms that released code publicly, such as PeptideShaker Online [11] and JS-MS 2.0 [16], remain recoverable after their servers disappear.
Can I run web-style bioinformatics platforms without any internet connection at all?
Yes, with the right architecture. A locally installed web server, such as the PeptideShaker Online result interface [11], a fully local browser application such as JS-MS 2.0 [16], a self-hosted platform inside your institution [17], or a containerized workflow [10] all deliver web-style interfaces while removing dependence on any external network path.
Sources
- ZBIT Bioinformatics Toolbox: A Web-Platform for Systems Biology and Expression Data Analysis.
- Enabling the democratization of the genomics revolution with a fully integrated web-based bioinformatics platform.
- H(3)NGST: a fully automated, web-based platform for end-to-end ChIP-seq analysis.
- A web-based integrative transcriptome analysis, RNAseqChef, uncovers the cell/tissue type-dependent action of sulforaphane.
- SimpleMicrobiome: An integrated web-based platform for streamlined microbiome data analysis and visualization.
- DOCKweb: a web-based GUI platform for molecular modeling with DOCK6.
- Developing a web-based platform for Eragrostis tef resource management and analysis.
- HTT-OMNI: A Web-based Platform for Huntingtin Interaction Exploration and Multi-omics Data Integration.
- A Scalable, Web-Based Platform for Proteomics Data Processing, Result Storage and Analysis.
- EpiMOLAS: an intuitive web-based framework for genome-wide DNA methylation analysis.
- PeptideShaker Online: A User-Friendly Web-Based Framework for the Identification of Mass Spectrometry-Based Proteomics Data.
- An overview of the BioExtract Server: a distributed, Web-based system for genomic analysis.
- CAPITO--a web server-based analysis and plotting tool for circular dichroism data.
- PESCADOR, a web-based tool to assist text-mining of biointeractions extracted from PubMed queries.
- Disulfide by Design 2.0: a web-based tool for disulfide engineering in proteins.
- A web-based system for creating, viewing, and editing precursor mass spectrometry ground truth data.
- Implementing a Version Control Platform as an Interactive Educational Framework for Bioinformatics and Artificial Intelligence in Medicine.