Stata vs R for Econometrics and Panel Data
By Dr. Zubair Khalid, DVM, MS, PhD ·

Stata is a commercial, menu-driven statistics package with polished, officially certified econometric routines, while R is a free, open-source programming language where econometric methods arrive as community-built packages that often appear first and cover the widest methodological range. The rule of thumb is simple. Choose Stata if you want a turnkey tool with documented, version-stable commands for standard panel estimators and a gentler learning curve. Choose R if you want maximum methodological breadth, full programmatic control, and no license barrier, and you are willing to invest more time learning to code. Many working econometricians end up using both, and the rest of this article explains why that is a rational outcome rather than indecision.
What Econometricians Actually Need From Software
Econometrics is the application of statistical methods to economic data, typically to estimate causal relationships, test theories, and forecast. The work divides into a few recurring tasks: cleaning and merging datasets, estimating models such as fixed-effects regressions, computing correct standard errors, running diagnostics, and producing tables and figures for publication.
Two features of the discipline shape the software decision more than anything else. First, panel data, meaning observations on the same units such as firms, countries, or individuals tracked over multiple time periods, dominate modern empirical economics. Panel estimators like fixed effects, random effects, difference-in-differences, and event studies are the daily bread of applied work. Second, methods evolve quickly. New estimators for cluster-robust inference, spatial dependence, and high-dimensional fixed effects appear in the literature faster than any single vendor can certify them. This is where the difference between Stata and R for econometrics becomes concrete, because the two packages absorb new methods at different speeds through different channels.
Stata on Its Own Terms
Stata, currently at version 18 in the mainstream econometrics textbook literature, is built around a coherent command language. You type regress y x, xtreg y x, fe, or xtregar y x, fe and get a complete, documented estimation routine whose behavior does not change between versions without official notice. Textbooks are written directly against these commands. Using Stata for Principles of Econometrics, for example, walks students through the standard undergraduate curriculum command by command [1], and newer texts cover cross-section, time series, and panel analysis with both Stata 18 and R side by side.
Three strengths matter most in practice.
Certified core commands with stable syntax. Stata's built-in panel toolkit covers fixed and random effects, dynamic panel models, andunequally spaced panels with AR(1) disturbances through xtregar. Applied researchers rely on this stability. A study of material consumption across European countries from 2000 to 2016, for instance, estimated a fixed-effects model with robust standard errors, then applied the Baltagi and Wu estimator for unequally spaced panels using Stata's xtregar, and finally fit a spatial autoregressive model with xsmle, all within one package [2]. That workflow, from basic panels to spatial dependence, runs on documented commands with a consistent interface.
Mature official coverage of specialized estimators. Multilevel mixed-effects regression, the workhorse for hierarchically structured data such as patients within countries or students within schools, is a native Stata feature. A 2025 econometric analysis of health determinants across 194 WHO member countries applied a multilevel mixed-effects linear regression model using Stata 16 [3]. Corporate finance instruction follows the same pattern, with full Stata code provided alongside corresponding Python and R code available online [4].
A curated ecosystem of user-written commands. Stata's user community contributes packages such as reghdfe for linear models with high-dimensional fixed effects and boottest for wild bootstrap inference. These are widely used, but they live outside the official certified core, which matters for how you think about updates and support.
The tradeoffs are real. Stata is proprietary, so access depends on a license. Its language is purpose-built rather than general purpose, so tasks that drift away from statistics, such as web scraping, heavy text processing, or building a production data pipeline, get awkward quickly. Its graphics and data-wrangling syntax are serviceable but less flexible than a full programming language.
R on Its Own Terms
R is a free, open-source programming language designed for statistical computing. Econometric capability in R comes from packages, which are libraries of contributed code. The flagship panel package is plm, which implements the standard linear panel estimators. The fixest package has become the default for fast fixed-effects regressions with clustered standard errors, and lfe handles high-dimensional fixed effects. Causal inference tools, difference-in-differences estimators, and regression discontinuity methods all have active R implementations.
The core strengths mirror Stata's weaknesses.
Zero-cost, fully open access. Anyone can download R and every CRAN package without a license. For students in low-resource settings, researchers in developing-country institutions, and anyone collaborating across organizations with different budgets, this alone settles the question of the best software for researchers with constrained funds.
A general-purpose language underneath. Because R is a full language, the same script that estimates a model can download data, clean it, simulate a Monte Carlo experiment, and build a publication-ready figure. This matters for reproducibility, which we return to below.
Fastest route to new methods. Methodologists who invent estimators frequently release an R package the same year their paper appears. R's econometric ecosystem is broad enough that comparative studies of spatial econometric implementations treat R packages such as spdep and sphet as reference implementations alongside Stata's sppack, MATLAB toolboxes, and Python's PySAL [5].
A bridge to general-purpose computing. R integrates naturally with Python and with larger analytical stacks. Surveys of operations research infrastructure list R and Stata among the standard econometric modeling environments alongside Spark-based big data platforms and optimization tools [6].
The tradeoffs are also real. Package quality varies, documentation is uneven, and the sheer number of overlapping packages confuses beginners. Version changes in community packages can alter results or syntax without the kind of controlled release discipline Stata applies to its core. And the learning curve is steeper, because you must learn a programming language rather than a command vocabulary.
Side-by-Side Comparison
| Criterion | Stata | R |
|---|---|---|
| Cost and licensing | Commercial, paid license per seat | Free and open source (GPL) |
| Interface | Point-and-click GUI plus command language | Command line and script based, IDEs such as RStudio |
| Learning curve | Gentler, command vocabulary is small and consistent | Steeper, requires learning a programming language |
| Core panel estimators | Official, certified, version-stable commands | Community packages (plm, fixest, lfe) |
| New method adoption | Through official releases first, user packages after | Often first through CRAN packages |
| Reproducibility | Do-files, good but GUI temptations exist | Full script-based pipelines, excellent |
| Graphics | Strong built-in publication graphics | ggplot2, the most flexible statistical graphics system in widespread use |
| General programming | Limited, purpose-built language | Full language, integrates with data engineering and machine learning stacks |
| Documentation | Official manuals with worked examples for every command | Package help pages plus community tutorials, variable quality |
| Version stability of results | High, core behavior is controlled by one vendor | Varies by package maintainer |
| Extensibility | Via user-written ado files, and bridges such as the Julia integration | Natively extensible, links to C++, Python, Julia |
One more row deserves its own paragraph. Stata now hosts a formal bridge to the Julia language through a package that moves data between the two environments, issues Julia commands, and passes results back. Julia's econometric ecosystem remains less mature than Stata's or R's, but the bridge lets shared back ends serve both platforms. The wild bootstrap inference program boottest in Stata and fwildclusterboot in R both call the same Julia back end, and reghdfejl mimics the standard reghdfe workflow while calling Julia for roughly tenfold acceleration on hard high-dimensional fixed effects problems [7]. The practical lesson is that the boundary between the two packages is porous, not absolute.
Panel Data: Where the Comparison Gets Sharpest
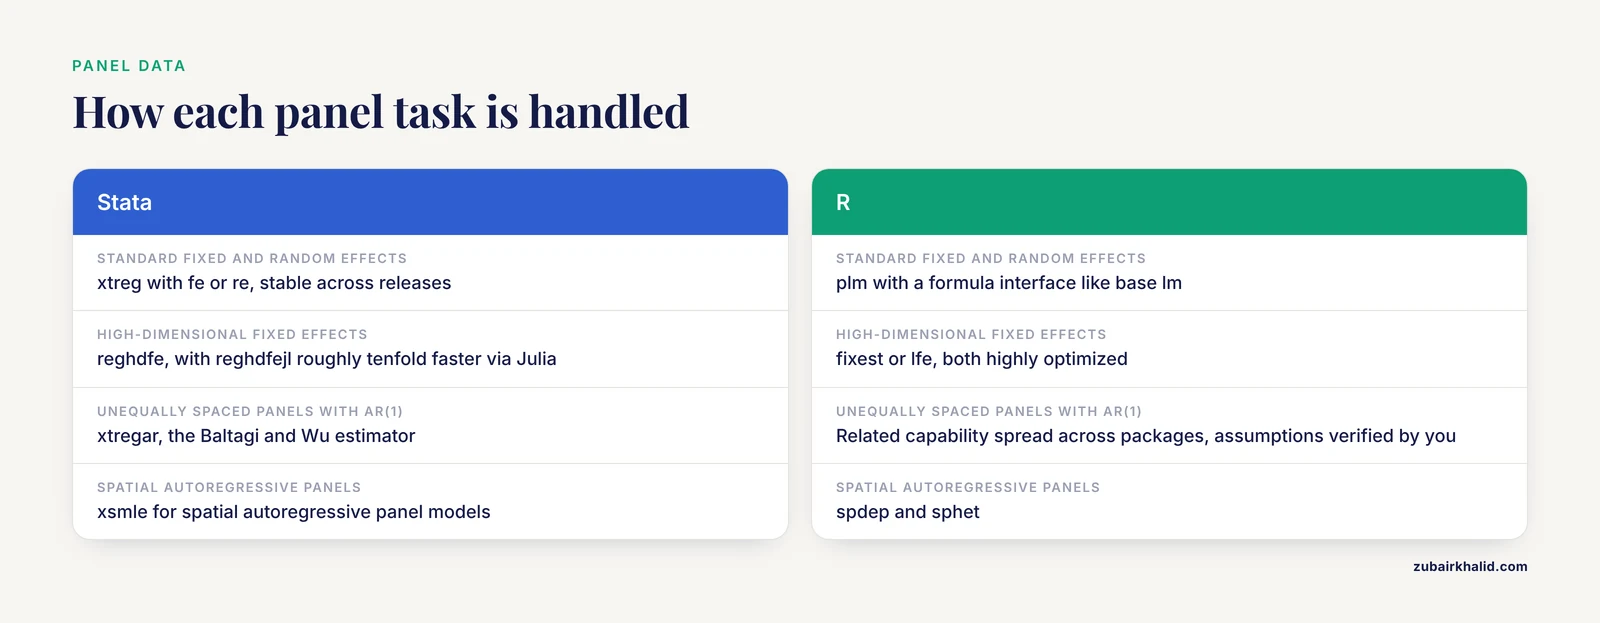
Because panel data sit at the center of applied econometrics, the question of Stata vs R for econometrics and panel data deserves its own detailed treatment.
Standard linear panels. Both packages handle pooled OLS, fixed effects, random effects, and first-differencing without difficulty. In Stata, xtreg with the fe or re option is the entry point, and results are stable across releases. In R, plm provides the same estimators with a formula interface familiar from base R's lm. For a one-shot paper with a modest dataset, either choice produces identical coefficient estimates, because both packages solve the same underlying linear algebra problem.
High-dimensional fixed effects. When your model includes hundreds or thousands of fixed effects, for example firm and year effects across a large employer-employee panel, computation becomes the bottleneck. Stata's reghdfe is the reference implementation, and the Julia-accelerated variant reghdfejl reports roughly tenfold speedups on hard problems by delegating the absorption step to Julia [7]. R users reach for fixest or lfe, which are also highly optimized. At this frontier, both ecosystems are strong, and cross-validation between packages is good scientific practice.
Unequally spaced panels and autocorrelation. Some panel datasets have missing years, which breaks naive estimators. Stata's xtregar implements the Baltagi and Wu estimator for unequally spaced panels with AR(1) disturbances, and this is exactly what applied researchers used in a European material-consumption study after their initial fixed-effects estimation [2]. R has related capability but less of it lives in a single officially supported command, so you assemble the workflow from packages and verify the assumptions yourself.
Spatial panels. Spatial econometrics, which models dependence across geographic units, is well covered in both packages but organized differently. Stata users have xsmle for spatial autoregressive panel models [2], while R users draw on spdep and sphet. A methodological comparison of maximum likelihood and generalized method of moments implementations across MATLAB, Stata, Python, and R found that results should correspond across implementations for the same data and documented where they do [5]. Textbook treatment now spans the tools too, with a dedicated spatial econometrics primer providing applications in R, Stata, and Python.
The honest verdict on panels. For the estimators covered in a first-year graduate econometrics course, the two packages are functionally equivalent and differ mainly in syntax and workflow. Stata's advantage is a single, officially documented path for each estimator. R's advantage is speed of innovation and unrestricted access. Neither dominates, which is why recent graduate texts deliberately teach both, presenting the same panel models in Stata 18 and R within one volume.
Beyond Panels: Time Series, Causal Inference, and Simulation
Panel data is not the whole discipline, and the balance of strength shifts across subfields.
Time series. ARIMA, ARDL, and VAR models, meaning autoregressive integrated moving average, autoregressive distributed lag, and vector autoregression frameworks, run in both packages. A comparative econometric study of cloud and network demand explicitly evaluated the same time-series and dynamic regression families across R, Stata, SPSS, and EViews and examined methodological transparency and cross-tool reproducibility [8]. That study is a useful template for any analyst wondering whether results travel between packages. They largely do, provided you match the specification, the sample, and the standard error treatment.
Causal inference. Difference-in-differences, instrumental variables, regression discontinuity, and weighting methods are central to modern applied work. Both ecosystems have mature tools. What has changed recently is the arrival of AI coding assistants as a third factor in the research software comparison. A controlled evaluation asked ChatGPT to generate code for difference-in-differences, inverse probability treatment weighting, and regression discontinuity designs using problem sets from Causal Inference: The Mixtape, tested in Python, Stata, and R. ChatGPT produced accurate code and results in R and Python for most tasks but performed less reliably in Stata, and errors clustered in data management and figure generation [9]. Two cautions apply. The evaluation involved structured prompts and researcher feedback, and the structure and syntax of generated code varied across users and sessions, so output required verification regardless of language.
Simulation and Monte Carlo work. Researchers who evaluate estimators by simulating data repeatedly often prefer R, because loops, custom data-generating processes, and distributional functions are natural in a programming language. Stata can do this too, and recent methodological work in strategic management provides a tool that generates the code for Monte Carlo simulations in R, Stata, or Excel, deliberately supporting all three so scholars can work in their preferred environment [10].
Machine learning hybrid methods. All-subset regression, which searches every possible combination of covariates for the best model by an information criterion, illustrates where general-purpose languages can pull ahead. A Julia-native implementation of all-subset regression reported running up to 3,165 times faster than Stata alternatives and 197 times faster than R alternatives for that specific algorithm. The ordering there reflects one algorithm rather than a general ranking, but it shows why econometricians who push computational frontiers often step outside both packages, and why bridges like the Stata-Julia integration matter [7].
Reproducibility, Workflow, and the Human Factor
Reproducibility means that another researcher can rerun your analysis and obtain your exact results. It has become a publication requirement at many journals, and it is the area where the workflow difference between the packages is clearest.
In R, everything is a script by default. The same file that loads packages, imports data, estimates models, and writes out tables can be shared, version-controlled, and rerun. In Stata, the equivalent is the do-file, and disciplined Stata users achieve comparable reproducibility. The practical difference is that Stata's graphical interface makes ad hoc, unrecorded clicks tempting for beginners, while R forces script-based habits from day one. Neither package prevents sloppy work, and neither prevents excellent work, but R's structure pushes beginners toward good habits faster.
Teaching materials reflect this convergence. A corporate finance methods text supplies all examples in Stata code with corresponding Python and R code available online, so students can focus on interpretation rather than syntax wars [4]. University libraries serving econometrics courses maintain guides covering R, SAS, SPSS, and Stata together rather than endorsing one, on the logic that students will encounter all of them across a career [11].
How to Choose: Worked Scenarios
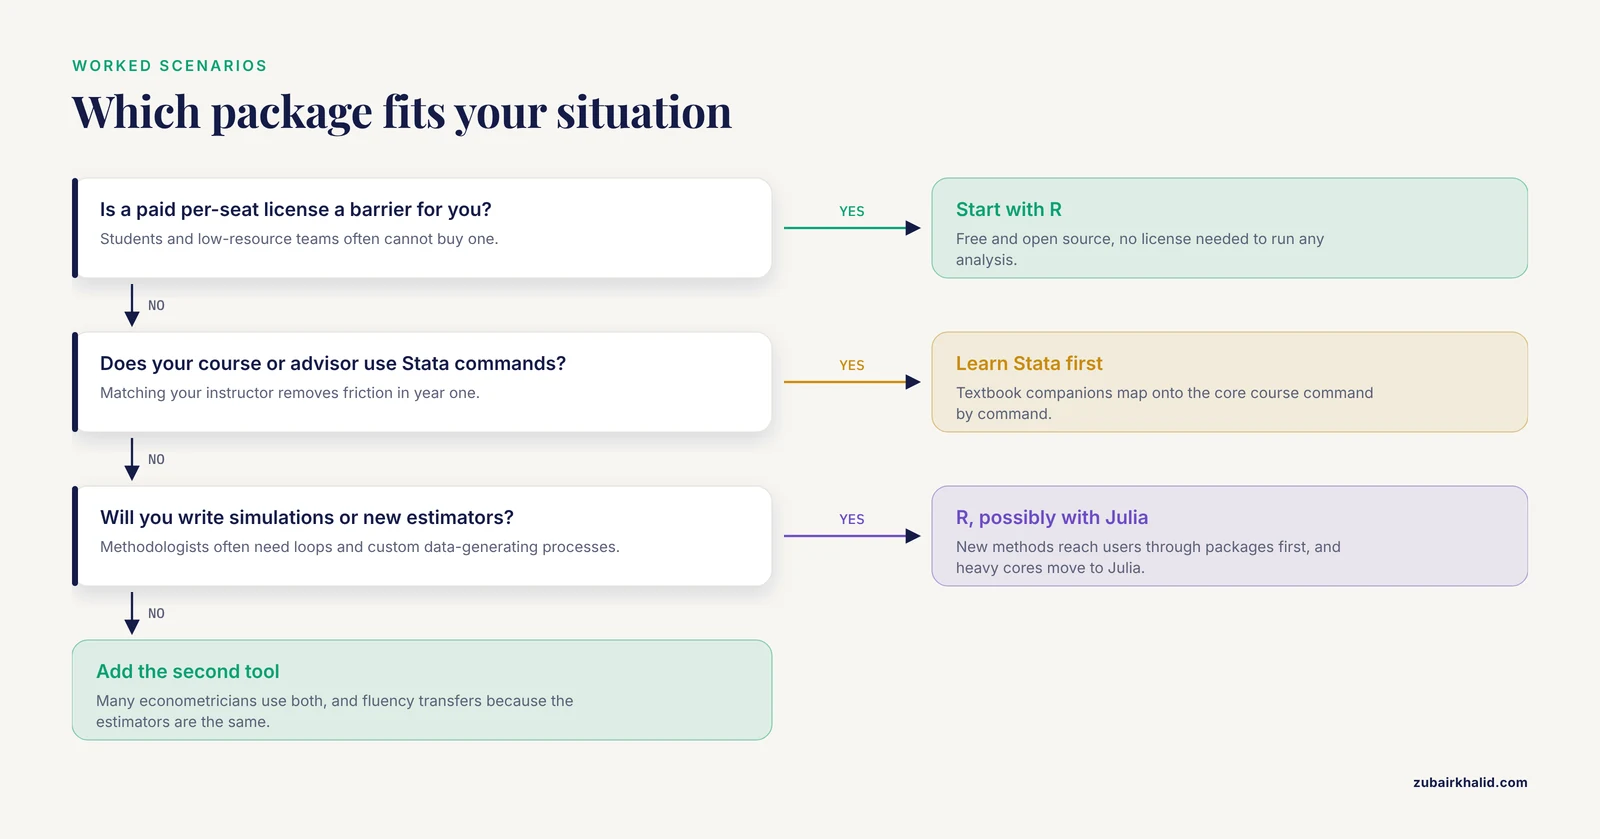
The abstract comparison resolves differently depending on who you are and what you are doing.
First-year graduate student in economics. Learn Stata if your program's core course and your advisor's problem sets use it, because matching your environment to your instructor eliminates friction. The standard textbook companions, such as the Stata companion for Principles of Econometrics [1] and newer texts covering both Stata 18 and R, map directly onto course material. Add R in your second year, once the econometrics is familiar and the programming is the only new thing.
Applied health or policy researcher with survey and administrative panel data. Stata is often the efficient default. The workflow of fitting fixed-effects models, then specialized estimators such as xtregar for unequally spaced panels with AR(1) disturbances and xsmle for spatial dependence, runs entirely on documented commands. Multilevel mixed-effects models for nested health data are native, as demonstrated in a 194-country analysis of life expectancy determinants run in Stata 16 [3]. The command vocabulary is small enough that a team of analysts with mixed coding backgrounds can read each other's do-files.
Computational researcher or methodologist. R, possibly with Julia alongside, is the better home. You will write simulations, implement a new estimator before any vendor does, and integrate with machine learning libraries. R's package system is how new econometric methods reach most users first, and general-purpose extensibility is the whole point. When your estimator becomes computationally heavy, the pattern of moving the numeric core to Julia while keeping R or Stata as the front end is an established design, as the shared back end behind boottest and fwildclusterboot demonstrates [7].
Cross-tool verification and consulting environments. If your deliverable must be checked or rerun by clients using different tools, plan for the cross-validation from the start. Comparative studies that ran identical ARIMA, ARDL, and VAR specifications across R, Stata, SPSS, and EViews found the exercise valuable precisely because matching results across tools is a strong error check [8]. Similarly, researchers comparing spatial econometric implementations across five software environments treated cross-software agreement as a validation criterion [5].
Budget-constrained teams and students. R removes the license barrier entirely. If a Stata license is the difference between analyzing your data and not analyzing it, the decision makes itself. That said, institutional licenses are common at universities, so check what your department provides before paying.
Common Mistakes and Limitations
Assuming the packages produce different estimates. For correctly specified linear models with the same sample and standard error treatment, Stata and R solve the same math. If results differ, the cause is almost always a different sample after listwise deletion, a different default treatment of missing values, different clustering of standard errors, or a different reference category for factors. Match the specification before blaming the software.
Confusing command availability with method correctness. The fact that a package can estimate a model does not mean the model is appropriate for your data. The European material-consumption study cited above is a good example of doing this right. The authors estimated a fixed-effects model first, then moved to an estimator designed for unequally spaced panels only because their data demanded it, then added a spatial model only to address demonstrated spatial dependence. Match the estimator to the data structure, in either package.
Trusting AI-generated econometric code without verification. AI assistants are now part of the workflow, but the controlled evaluation of ChatGPT-generated code for causal inference designs found reliable output in R and Python for most tasks, weaker performance in Stata, and errors concentrated in data management and figure generation [9]. Every generated script needs to be checked line by line, and results need independent replication.
Treating package stability as a given in R. Community packages change. Pin your package versions, record your session information, and rerun your pipeline before submission. In Stata, record your version number, because official commands occasionally change defaults across major releases.
Comparing only the headline estimators. The real daily difference between the packages lies in data management. Stata's merge, reshape, and collapse commands are concise but narrow. R's dplyr and data.table are more expressive but require programming fluency. Budget your learning time for data wrangling, not just estimation.
Ignoring the bridges. Treating Stata and R as rival kingdoms is outdated. Data moves between them, shared computational back ends serve both [7], and modern textbooks assign the same problems in both languages. The difference between Stata and R for econometrics is increasingly about workflow and access, not about which methods exist.
A limitation that applies to all software. No package fixes a weak research design. An instrumental variable that violates exclusion restrictions, a difference-in-differences setup without parallel trends, or a panel too short for credible fixed-effects estimation will produce misleading results in Stata, R, or anything else. Software choice is a second-order decision compared with identification strategy.
Frequently Asked Questions
Is Stata or R better for panel data analysis?
Neither dominates for standard panel estimators. Both handle fixed effects, random effects, and clustered standard errors with well-tested implementations. Stata offers officially certified, version-stable commands such as xtreg and xtregar with a single documented path per estimator, while R offers broad, fast-evolving packages such as plm and fixest. Choose based on your workflow, budget, and institutional environment rather than estimator availability.
What is the main difference between Stata and R for econometrics?
Stata is a commercial package with certified commands and a controlled release process, while R is a free programming language whose econometric methods arrive as community packages. Stata favors stability and a gentler learning curve, and R favors extensibility, reproducibility through scripting, and early access to new methods. Both are listed among the standard econometric modeling environments in modern analytical infrastructure surveys [6].
Do I need to know how to program to use Stata?
Less than you need for R. Stata's command language is a compact vocabulary of named commands and options, so you can run regressions after learning a few dozen commands, and its graphical interface covers common tasks. R requires learning an actual programming language from the start. Textbook companions built around Stata commands are designed for exactly this entry-level use case [1].
Can I use both Stata and R in the same research project?
Yes, and many researchers do. You can export data between the packages, replicate key results in both as an error check, and use bridges such as the Stata-Julia integration that lets shared back ends serve both platforms [7]. Texts now provide matched code in Stata with corresponding R and Python code for the same analyses [4], and cross-tool agreement is used deliberately as a validation technique in comparative studies [8].
Which should I learn first for a career in economics?
Learn the tool your program or first employer uses, then add the second within a year or two. Stata remains common in economics departments and policy institutions, and R is dominant in academia's methodological frontier and in data science roles. A 15-minute scan of job postings in your target subfield will tell you which local demand is stronger. Fluency in one package transfers conceptually to the other, because the estimators are the same.
Will AI tools like ChatGPT write my econometrics code for me?
Partially, and with verification. A controlled evaluation of ChatGPT's code generation for difference-in-differences, inverse probability weighting, and regression discontinuity designs found accurate code and results in R and Python for most tasks, weaker performance in Stata, and errors concentrated in data management and figures [9]. Generated code also varied in structure across sessions, so treat AI output as a first draft that requires line-by-line review and independent replication, not as a finished analysis.
Sources
- Using Stata for Principles of Econometrics
- Driving factors of material consumption in European countries - spatial panel data analysis
- Global and regional impact of health determinants on life expectancy and health-adjusted life expectancy, 2000-2018: an econometric analysis based on the Global Burden of Disease study 2019
- Quantitative Research Methods in Corporate Finance
- Comparing Implementations of Estimation Methods for Spatial Econometrics
- Operations Research Challenges in Energy-Efficient Cloud and Network Infrastructure: An Integrated AI-Simulation Perspective
- Julia as a universal platform for statistical software development
- Econometric Modelling of Cloud and Network Demand: A Comparative Study Using R, Stata, SPSS, and EViews
- Can AI write your code? A case study of chatgpt’s statistical coding capabilities for quantitative research
- Primer on using Monte Carlo simulations to evaluate research methodology in strategic management
- Woodruff (Main) Library LibGuides: Data Resources for Econometrics (ECON 320): Help with R/SAS/SPSS/Stata