SPSS vs R vs SAS vs Stata vs Python: A Side-by-Side Comparison
By Dr. Zubair Khalid, DVM, MS, PhD ·

SPSS, R, SAS, Stata, and Python will all test the same hypothesis on the same dataset, but they differ in how you work: SPSS runs analyses through menus, Stata and SAS run through proprietary command languages, and R and Python are free programming languages whose statistical muscle comes from add-on packages.
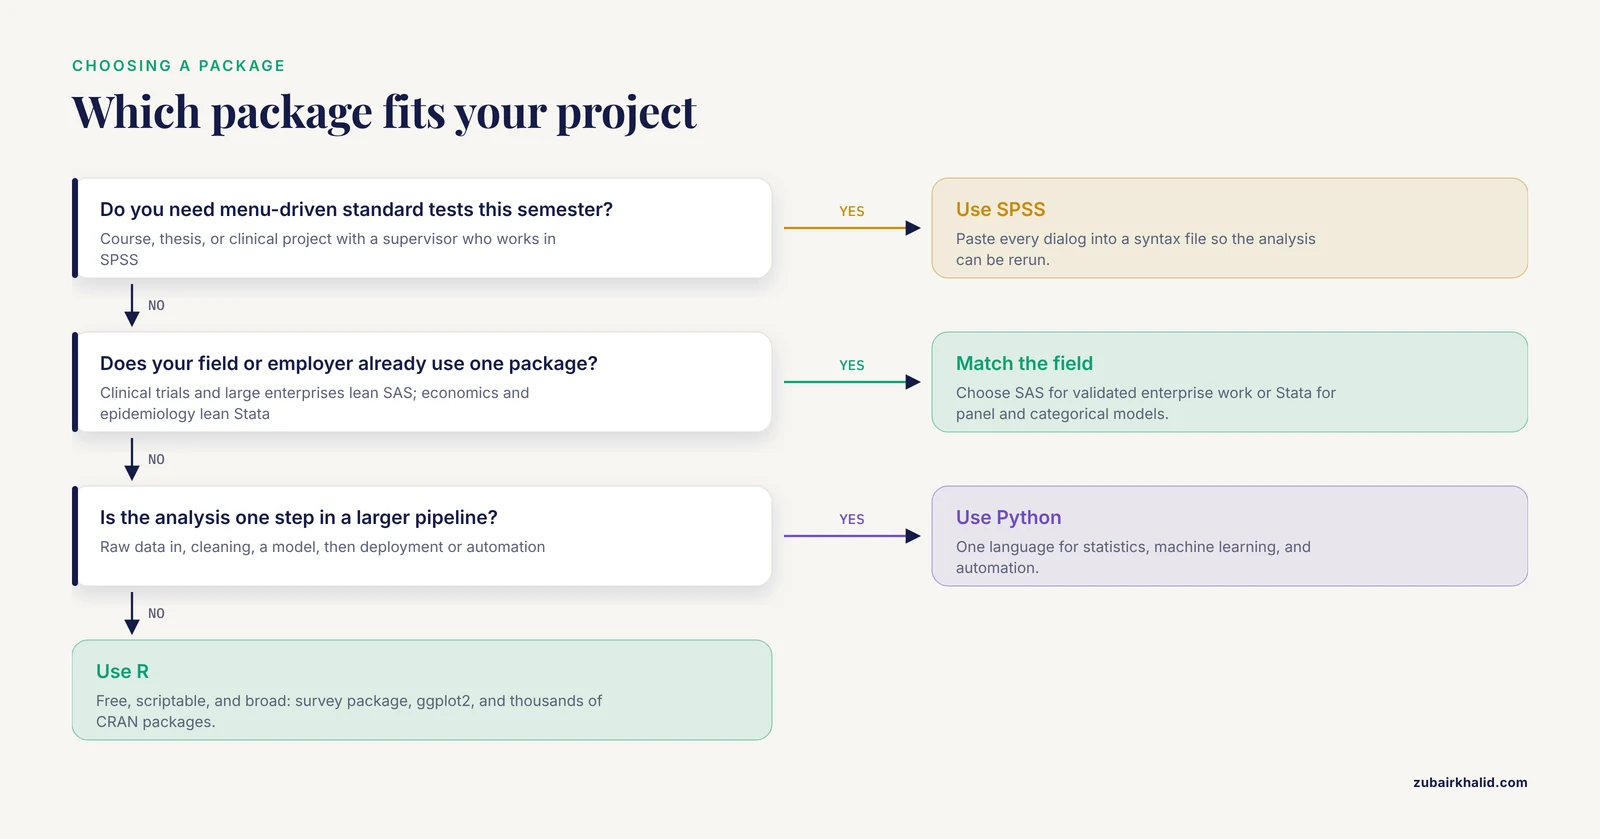
A rule of thumb covers most decisions. Pick SPSS if you need menu-driven results for a course, thesis, or clinical project this semester. Pick Stata or SAS if your field, supervisor, or employer already standardizes on them. Pick R or Python if you want free, scriptable, reproducible analysis that keeps paying off for the rest of your career.
The question recurs in every quantitative field. Reviews written for agricultural researchers, for example, weigh the advantages, limitations, and applications of R, SAS, SPSS, Python, and Stata against the demands of that discipline. This research software comparison does the same for the life sciences, health research, and social science. It explains what each package does well, compares the five on the criteria that decide real choices, and closes with worked scenarios and the mistakes researchers make most often.
What Each Package Is (and Who It Serves)
The difference between SPSS, R, SAS, Stata, and Python becomes clear once each package is described on its own terms.
SPSS: The Menu-Driven Standard
IBM SPSS Statistics is organized around point-and-click dialogs. You open a spreadsheet-like Data Editor, define variables and value labels in a Variable View, and run a t-test, ANOVA, chi-square test, or regression from a menu. Results land in a separate Viewer window as formatted tables you can copy straight into a thesis or manuscript. The native .sav format stores data together with variable labels and value labels, which keeps categorical variables readable in every output table.
SPSS remains the default in psychology, nursing, education, and much of public health teaching. Researchers in public health and epidemiology are notably more accustomed to commercial packages such as SAS, SPSS, and Stata than to code-based tools [1]. A syntax editor exists, and careful users paste every menu command into it, but many SPSS analysts never open that window, and that habit is where its reproducibility problem begins.
The strengths are the gentlest learning curve of the five, clean labeled output, and dependable coverage of the standard tests taught in introductory statistics. The limits are license costs, limited reach into modern machine learning, and workflows that are hard to repeat exactly unless you force yourself to use syntax.
R: The Free, Extensible Language
R is a free, open-source programming language built for statistics. Researchers cite its flexibility and open-source nature as the main reasons for adopting it [1]. The base installation covers classical statistics, and the Comprehensive R Archive Network (CRAN) distributes thousands of user-contributed packages that add everything from specialized estimators to publication-quality graphics through libraries such as ggplot2.
Two package families matter most in daily research. The survey package analyzes weighted complex survey data, including estimation of population means and regression on large health surveys [1]. The tidyverse, haven, and labelled packages move data in and out of other formats while preserving the variable and value labels that make survey datasets interpretable [2]. RStudio, now developed by Posit, provides the script editor where most users work, and R Markdown or Quarto turns an analysis script directly into a report.
The strengths are unmatched breadth of methods, which often arrive in R months or years before commercial packages add them, excellent graphics, and zero cost. The limits are a steep first month, inconsistent syntax across packages written by different authors, and error messages that assume programming experience.
SAS: The Enterprise Workhorse
SAS, from SAS Institute, is a proprietary system organized around DATA steps that prepare data and PROC steps that analyze it. Modules extend the core, including SAS/STAT for statistics and SAS Enterprise Miner for data mining and text mining [3]. Installations typically run on managed servers with technical support, validation documentation, and audit trails.
That infrastructure explains where SAS dominates. Pharmaceutical companies, large hospitals, and government agencies rely on it for analyses that must be documented, validated, and defended, and clinical trial sponsors have standardized on SAS for decades. Head-to-head evaluations of SAS against Python and R on data science tasks compare code length, output, and results, and their guidance is that the correct tool depends on the situation rather than on any single winner [4].
The strengths are stability, professional support, provenance for regulated work, and strong performance on large datasets. The limits are high licensing costs, a smaller user-contributed ecosystem than R or Python, and syntax that transfers poorly to other tools.
Stata: The Compact Specialist
Stata, from StataCorp, occupies the middle ground between menus and full programming. You type short commands such as regress or logistic in an interactive console, save the sequence in a do-file, and rerun the whole analysis with a single command. Menus exist for beginners, and the native .dta format carries variable and value labels the same way SPSS files do.
Stata is the everyday tool in economics, epidemiology, political science, and much of public health, and formal comparisons of SAS, Stata, and SPSS for research use go back at least to Acock's 2005 review [5]. Its coverage of models with categorical outcomes, such as logistic and ordinal regression, is a common reason analysts stay with it, and those same models are available across Stata, SAS, R, and SPSS through different interfaces [6]. User-written commands extend the package, though that ecosystem is smaller than CRAN.
The strengths are fast learning after SPSS, readable do-files, strong documentation, and deep coverage of panel data and categorical-outcome models. The limits are license costs, modest machine learning reach, and a smaller extension ecosystem.
Python: The General-Purpose Pipeline Builder
Python is a general-purpose programming language that does statistics through libraries. pandas provides the spreadsheet-like data frame, statsmodels fits classical regression models, scikit-learn supplies machine learning, and matplotlib or seaborn draw the plots. Jupyter notebooks mix code, output, and notes in a single document.
Python earns its place when analysis is one step in a larger pipeline: importing raw data, cleaning it, training a model, and deploying the result as an application or automated report. Evaluations of text cleaning, text mining, and sentiment analysis find that Python and R both cover the standard techniques, alongside SAS Enterprise Miner on the commercial side [3]. Random forests, which are ensembles of decision trees used for prediction, are likewise implemented in Python, R, and SAS [7].
The strengths are zero cost, an enormous machine learning ecosystem, and easy connections to databases, web services, and automation. The limits are thinner classical statistics support than R, added friction from environment setup, and extra work to format output for a journal manuscript.
SPSS vs R vs SAS vs Stata vs Python: Side-by-Side Comparison
| Criterion | SPSS | R | SAS | Stata | Python |
|---|---|---|---|---|---|
| License | Commercial (IBM) | Free, open source | Commercial (SAS Institute) | Commercial (StataCorp) | Free, open source |
| How you work | Menus, optional syntax | Scripts | DATA and PROC steps | Commands and do-files | Scripts and notebooks |
| Home turf | Psychology, nursing, education, public health teaching | Biostatistics, academia, data science | Pharma, clinical trials, large enterprises | Economics, epidemiology, political science | Data science, machine learning, pipelines |
| Learning curve | Gentlest | Steep at first | Steep | Moderate | Moderate to steep |
| Reproducibility | Weak unless you use syntax | Excellent with scripts | Excellent with program files | Excellent with do-files | Excellent with scripts and notebooks |
| Extensibility | Limited add-ons | Thousands of CRAN packages | Proprietary modules | User-written commands | Vast library ecosystem |
| Machine learning reach | Limited | Strong | Strong, including Enterprise Miner | Modest | Strong |
| Survey data support | Built in | survey package | Built in | Built in | Through third-party libraries |
| Main drawback | Cost and weak reproducibility by default | Initial learning curve | Cost and closed ecosystem | Cost and smaller ecosystem | Thinner classical statistics support |
Three patterns in this table decide most real choices. First, the free-versus-paid split does not line up with a power split, because R and Python match or exceed the commercial packages across most modern analyses, [4]. Second, the interface row drives everything else, since menu tools resist automation while code tools resist quick one-off results. Third, home turf matters more than feature lists, because your collaborators, supervisor, and the journals in your field determine which habits and output files you must match.
How They Compare on the Decisions That Matter
Learning Curve and What the Effort Buys You
The clearest evidence on code-based versus menu-based learning comes from a study of 2,241 undergraduates across 61 post-secondary institutions who used the same statistics curriculum with different software [8]. Seventy-two percent learned a code-based platform (R, SAS, Stata, or Python) and 27.6 percent learned a non-code-based platform (SPSS, Excel, JMP, or StatCrunch). Students in code-based courses reported working harder and finding the material more challenging. The same students reported larger perceived gains in analyzing data for patterns, greater excitement about learning new concepts, and more interest in conducting research. The trade-off was real, because the code-based group felt less prepared for advanced disciplinary coursework or thesis work than the menu-based group [8].
The practical reading is that code costs more effort up front and returns more engagement and capability later, which is exactly the trade a research career rewards. University libraries also lower the barrier, since many run workshops across Stata, SPSS, SAS, R, and Python [9].
Reproducibility and Transparency
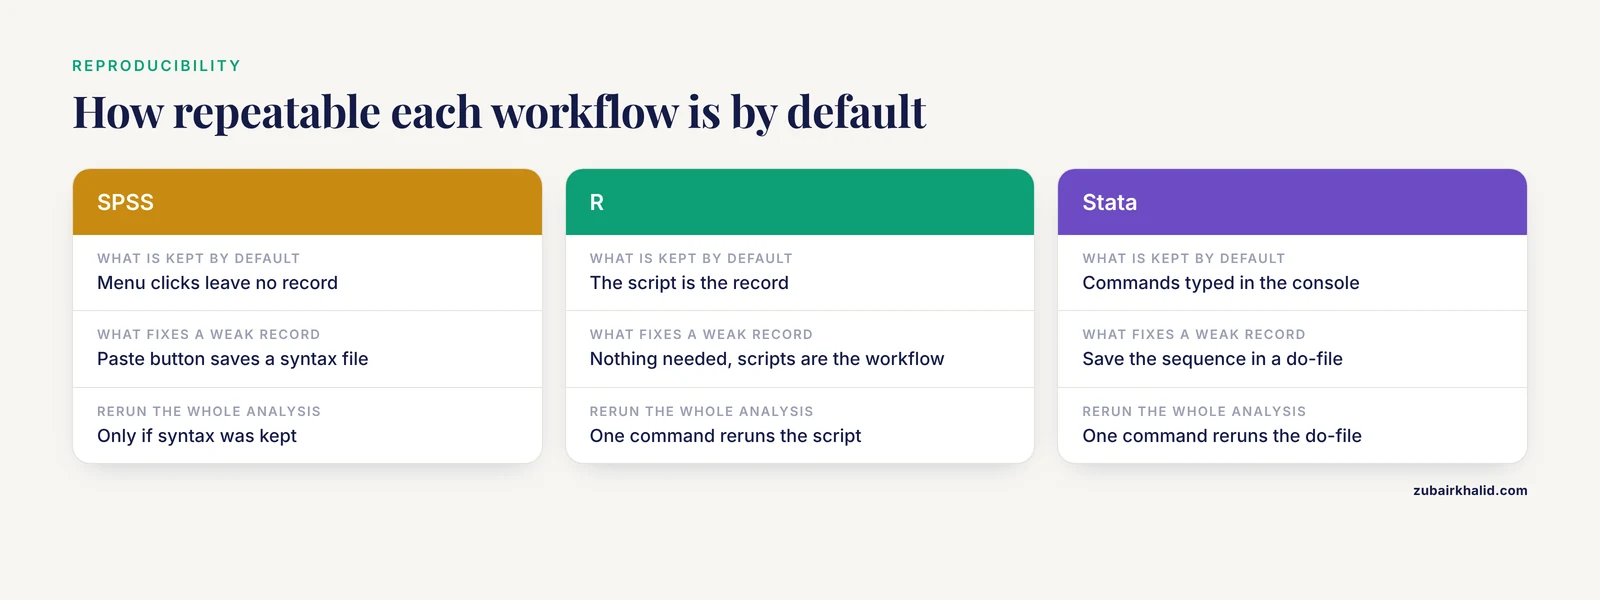
A menu click leaves no record. Six months later, neither you nor a reviewer can reconstruct which options you selected. Code-based workflows invert that problem: an R script, a Stata do-file, a SAS program, or a Python notebook reruns the entire analysis from raw data to final table with one command.
This matters beyond convenience, because code sharing expectations at many journals turn a rerunnable analysis into a practical requirement rather than a preference. Comparisons of nonparametric analyses (tests that make no assumption of a normal distribution) across SPSS, SAS, Stata, and R urge researchers to report which package and procedure they used, since those details affect the numbers others will try to reproduce [10]. If you stay in SPSS, the habit that fixes the problem is clicking the Paste button on every dialog and saving the resulting syntax file next to your data.
Will You Get the Same Answer in Every Package?
Usually yes, but not always. One team ran nonparametric tests and normality measures on the same large dataset in SPSS, SAS, Stata, and R, then checked every result against hand calculations using the raw computational formulas [11]. Multiple inconsistencies appeared between packages, caused by algorithmic variation, computational error, and output that failed to state exactly which procedure ran. The mismatches concentrated in small and medium samples, where package defaults diverge most [11]. The peer-reviewed report of this work recommends analyzing key results in more than one package and documenting the exact statistical procedure in the methods section [10].
The more common case is convergence. In causal mediation analysis, which tests whether an effect travels from a treatment through an intermediate variable to an outcome, a single mediator model with a treatment-mediator interaction produced similar causal effect estimates in R, SAS, SPSS, and Stata even though the programs used different estimation methods [12]. For standard models on adequate samples, the package matters less than the analyst. For edge cases, it matters enough to check.
Specialized Analyses: Where Each Package Earns Its Keep
Complex survey data. Health surveys such as the Canadian Longitudinal Study on Aging (CLSA) require sampling weights, strata, and cluster identifiers, and all four major statistical packages can handle them. A detailed comparison estimated population means and ran regression analyses on CLSA data using the R survey package alongside SAS, SPSS, and Stata, with code published for each package [1]. Comparisons of complex survey analysis across SAS, SPSS, and Stata reach back to at least 2010 [13].
Multilevel models. Models for nested data, such as students within schools or repeated measurements within patients, fit in Stata, SPSS, SAS, R, and the dedicated HLM package, each with different syntax and output conventions [14].
Categorical outcomes. Logistic, ordinal, and multinomial regression are available in Stata, SAS, R, and SPSS, and cross-package guides walk through fitting and interpreting each of these models [6].
Causal mediation. Mediation programs exist in R, Mplus, SAS, SPSS, and Stata, differing in data setup and output while agreeing on estimates for models with a continuous mediator and outcome [12].
Text mining and sentiment analysis. SAS Enterprise Miner, Python, and R all completed text cleaning, text mining, and sentiment analysis tasks in a controlled comparison, and the choice among them turned on features and workflow rather than raw capability [3].
Random forests. Implementations exist in R, SAS, and Python, which makes all three viable for tree-based prediction work [7].
Graphics and Reporting
R's ggplot2 produces the most polished publication figures of the five and links directly to literate-report tools. Stata's graph commands produce clean journal-ready figures with little tuning. SAS output through ODS and SPSS Viewer tables drop neatly into documents but offer less design control. Python's matplotlib and seaborn match R's range once you invest in formatting. If polished figures drive your workflow, R starts with an advantage.
Cost, Licensing, and Access
R and Python cost nothing to download, which matters for students, underfunded labs, and anyone whose analysis must keep working after graduation. SPSS, SAS, and Stata require paid licenses, usually purchased by institutions and shared through site licenses or virtual desktops. Many researchers first meet each package through a university lab course or a library workshop rather than a personal purchase [9]. Comparisons aimed at biostatisticians add a career-stage angle: the platform that suits a student or scholar before entering a large enterprise is not necessarily the platform the enterprise runs [15]. Budget training time as well as license fees, because the hidden cost of any package is the weeks spent learning it.
Moving Files and Metadata Between Packages
Real projects mix tools, and the classic failure is losing labels in transit. When large health surveys such as the Demographic and Health Surveys (DHS) are imported into R naively, variable and value labels vanish, turning readable categories into bare codes such as v312 [2]. A reproducible R workflow built on the haven, labelled, and tidyverse packages reads Stata, SPSS, and SAS files, extracts the metadata, and restores readable labels automatically, an approach that saved several hours of manual relabeling on a Malawi DHS module [2]. If you move data between packages, plan for the metadata, not just the numbers.
When to Use Each Package: Worked Scenarios
When to Use SPSS
You are a master's student in psychology, nursing, or education with a 300-row questionnaire dataset. Your supervisor works in SPSS, your committee expects SPSS output, and you need t-tests, ANOVA, chi-square tests, and Cronbach's alpha within weeks. SPSS is the right call, with one condition: paste every command into a syntax file so the analysis can be repeated. When to use SPSS, in short, is whenever you need menu-driven standard tests on labeled data for a team that already speaks SPSS.
When to Use R
You are analyzing a complex health survey with sampling weights and stratification, and a journal requires you to share code that reproduces every table. The R survey package, with published parallel code for SAS, SPSS, and Stata, was written for exactly this situation [1]. R is also the answer when the method you need exists only as a recent package, when you need custom graphics, or when the budget is zero.
When to Use SAS
You are joining a clinical trial team or a large enterprise where analyses must be validated, documented, and professionally supported. The DATA and PROC structure, the module system, and the technical support exist for that environment, and the text mining stack in SAS Enterprise Miner competes directly with Python and R on text cleaning and sentiment tasks [3]. Choose SAS when the organization, not you, carries the validation burden.
When to Use Stata
You are an economist, epidemiologist, or political scientist fitting logistic, ordinal, multilevel, or mediation models on survey or panel data, and you want compact commands with do-file reproducibility. Stata's categorical-outcome modeling is mature and well documented [6], multilevel fitting is established [14], and its mediation programs produce estimates consistent with the other major packages [12]. Choose Stata when your field's shared vocabulary is Stata output.
When to Use Python
You are building something larger than a single analysis: a pipeline that ingests raw data, cleans it, trains a random forest, and serves predictions to other software [7], or a text mining project over social media data [3]. Python is also the choice when you want one language for statistics, machine learning, and automation, and you accept thinner classical statistics support than R offers [4].
Most productive researchers end up with two tools, typically a menu package or Stata for quick collaborative work and R or Python for anything that must scale, repeat, or share.
Common Mistakes and Limitations
- Assuming every package computes identically. Packages use different default algorithms, and results can diverge in edge cases [10]. Cross-check key results in a second package, and name the software and procedure in your methods section.
- Running menus with no record. A point-and-click analysis cannot be rerun or audited later, which becomes a serious problem at revision time. In SPSS, use the Paste button and keep the syntax file with the data.
- Losing labels when switching tools. Importing a Stata, SPSS, or SAS file into R without a metadata workflow turns readable categories into bare codes [2]. Use haven and labelled, or an equivalent, whenever data crosses formats.
- Picking software before defining the analysis. The best software for researchers depends on the question, the data structure, and the audience. A weighted survey analysis, a multilevel model, and a machine learning pipeline point to different answers [1],, [7].
- Treating AI assistants as analysts. Experiments that replicated published analyses with ChatGPT-3.5 at an amateur skill level ran into substantial challenges on complex tasks, and the authors weigh real benefits against real risks [16]. Use AI to draft or explain code, then verify every step against actual output.
- Learning one tool for an entire career. The platform that fits a student differs from the one that fits a large enterprise, a distinction drawn explicitly in biostatistics comparisons [15]. Plan to add a second tool.
- Expecting a universal winner. Controlled comparisons of Python, R, and SAS on data science tasks conclude that the correct tool depends on the situation, including code length and output requirements [4]. There is no single best package, only the best fit for a given project.
Frequently Asked Questions
SPSS or R: which should I learn first?
Learn SPSS first if your immediate need is a thesis or course project with standard tests and a supervisor who works in SPSS. Learn R first if you expect to keep analyzing data after graduation, because its free, script-based workflow transfers to any research job. Many researchers learn SPSS in class and add R within their first two years of research.
Is paid software more accurate than free software?
No. Accuracy depends on the procedure and the analyst, not the license fee. Studies that run identical models in free and paid packages find agreement on standard analyses, with occasional differences traced to algorithmic defaults rather than to price [10], [12].
Which package is best for complex survey data?
All four major statistical packages handle weighted survey data. The R survey package, SAS, SPSS, and Stata all support estimation of population means and regression analysis under complex survey designs [1].
Do SPSS, R, SAS, and Stata give identical results?
Not always. Packages can use different default algorithms, and results can diverge in edge cases [10]. Report which software and procedure you used, and check key results in a second package.
Should I learn Python instead of R for machine learning?
Python has the larger machine learning ecosystem and is the better single language if you will also build applications or automated pipelines. R covers the same core methods, including random forests and text mining, and stays stronger for classical statistics [3], [7]. Many analysts end up using both.
Can AI tools like ChatGPT replace these packages?
No. AI assistants can draft code and explain procedures across R, Stata, SPSS, and Python, but controlled replication experiments with ChatGPT-3.5 ran into substantial challenges on complex analyses [16]. Treat AI as an assistant and verify every result against real output.
Sources
- Modelling Complex Survey Data Using R, SAS, SPSS and Stata: A Comparison Using CLSA Datasets.
- A reproducible R workflow to preserve variable and value labels in Stata, SPSS, and SAS datasets for transparent and reproducible health research
- A COMPARISON STUDY ON TEXT MINING AND SENTIMENT ANALYSIS FEATURES AND FUNCTIONS USING SAS ENTERPRISE MINER, PYTHON AND R
- Data Scientist’s Analysis Toolbox: Comparison of Python, R, and SAS Performance
- SAS, Stata, SPSS: A Comparison. Alan C. Acock
- Regression Models for Binary Dependent Variables Using Stata, SAS, R, LIMDEP, and SPSS
- A Comparison of R, SAS, and Python Implementations of Random Forests
- Comparing undergraduate learning outcomes and experiences across code-based and non-code-based statistical software platforms in courses utilizing the Passion-Driven Statistics curriculum
- GSU Library Research Guides: Research Data Services @ Georgia State University Library: WORKSHOPS ~ Data Analysis Tools ~ Quantitative (Stata, SPSS, SAS, R, Python) & Qualitative (NVivo)
- Researcher degrees of freedom in statistical software contribute to unreliable results: A comparison of nonparametric analyses conducted in SPSS, SAS, Stata, and R
- Researcher Degrees of Freedom and a Lack of Transparency Contribute to Unreliable Results of Nonparametric Statistical Analyses Across SPSS, SAS, Stata, and R
- Causal Mediation Programs in R, Mplus, SAS, SPSS, and Stata
- Complex Survey Data Analysis: A Comparison of SAS, SPSS and STATA
- Multilevel Modeling: Applications in STATA®, IBM® SPSS®, SAS®, R, & HLM™
- Comparison of bio-statistics software platform: SAS, SPSS, and R language
- ChatGPT as a data analyst: an exploratory study on AI-supported quantitative data analysis in empirical research