SPSS vs R for Psychological and Social Science Research
By Dr. Zubair Khalid, DVM, MS, PhD ·

SPSS is a menu-driven commercial statistics package built for the standard analyses that dominate psychology and social science research, while R is a free programming language that runs everything from a t test to a machine learning pipeline through community-built packages. The rule of thumb is simple. Choose SPSS when your analysis plan fits group comparisons, correlations, and regression and you need results fast. Choose R when you need methods beyond that core, scripted reproducibility, or a tool with no license that follows you past graduation. Many research teams use both.
The difference between SPSS and R for psychology research shows up less in which tests each program can run and more in how you work. Published studies trace the split clearly. Questionnaire-based studies in psychology, nursing, and health social science routinely run their entire analysis plan in SPSS [1][2][3]. Studies that need network analysis or machine learning bring R in alongside it or instead of it [4][5][6]. This comparison of SPSS vs R for psychological and social science research explains what each tool does well, weighs them on the criteria that decide real projects, and walks through the scenarios where each one wins.
SPSS and R at a Glance
This research software comparison covers the criteria that come up in actual projects, from a master's thesis to a funded program evaluation.
| Criterion | SPSS | R |
|---|---|---|
| Cost | Commercial license, usually provided by a university or employer | Free and open source |
| Interface | Point-and-click menus and dialog boxes | Typed commands in a console or script, usually inside RStudio |
| Time to basic competence | Days | Weeks of regular practice |
| Core statistics | Descriptives, t tests, ANOVA, chi-square, correlation, regression, factor analysis, reliability | All of these, plus far more |
| Advanced methods | Through paid add-ons such as AMOS for structural equation modeling | Through free packages, often ahead of commercial equivalents |
| Reproducibility | Optional syntax that menu users tend to skip | Scripts that rerun the entire analysis from raw data |
| Data handling | Comfortable for questionnaire-sized data | Scales to large files and scripted cleaning pipelines |
| Output | Formatted tables in a dedicated viewer | Text output and plots you assemble into reports |
There is no single best software for researchers. There is only the best fit for the project, the deadline, and the career in front of you.
What SPSS Does Best
SPSS (Statistical Package for the Social Sciences, now sold as IBM SPSS Statistics) is organized around dialogs. You pick a procedure from a menu, drag variables into boxes, click OK, and read formatted tables in a separate output window. That design matches how most psychology and social science studies are actually analyzed.
Consider what a typical published study asks of its software. A cross-sectional study of 189 emergency nurses in China ran its whole plan in SPSS version 26.0: descriptive statistics, independent samples t tests, one-way ANOVA, multiple linear regression, and Pearson correlation [1]. Each of those is a staple of the field. An independent samples t test compares the means of two groups. One-way ANOVA (analysis of variance) extends that comparison to three or more groups. Multiple linear regression predicts a continuous outcome, such as a questionnaire score, from several predictors at once. Pearson correlation measures the strength and direction of a linear relationship between two continuous variables.
The same pattern repeats across the literature. A study of obsessive-compulsive symptoms among 297 patients with multiple sclerosis used SPSS for chi-square tests of categorical variables, independent samples t tests, and binary logistic regression, the standard setup for modeling a yes-or-no outcome [2]. A chi-square test checks whether two categorical variables, such as sex and diagnosis status, are associated. A secondary analysis of 2,317 married postmenopausal women from the Korean Longitudinal Survey of Women and Families ran descriptive statistics, Pearson correlations, one-way ANOVA, and hierarchical multiple regression in SPSS/WIN 30.0 [3]. Hierarchical (or blockwise) regression enters predictors in planned steps so you can see what each block adds to the model. A study of hospital employees in Nigeria used SPSS version 23 for correlations, simple and multiple regression, and Sobel tests, a classic check of whether an indirect, mediated effect differs from zero [7].
Scale development follows the same route. A methodological study that built and validated a sexual satisfaction questionnaire for married women performed its exploratory factor analysis (EFA), known-groups comparisons (tests of whether groups expected to differ actually do), correlations, and test-retest reliability work (consistency of scores across two occasions) in SPSS 19.0 [8]. EFA searches for underlying dimensions among a set of questionnaire items, and it remains a core psychometric procedure that SPSS handles well.
The takeaway is that the entire standard survey pipeline, from descriptives to regression to basic psychometrics, lives inside SPSS with no code required.
When to Use SPSS
- Your analysis plan fits the standard toolkit: group comparisons, correlations, chi-square tests, and linear or logistic regression.
- A thesis or grant deadline is close and the priority is a finished, defensible analysis rather than a new skill.
- Your committee or collaborators expect SPSS output and read its tables fluently.
- You want output that maps directly onto the tables and statistics psychology papers conventionally report.
- Published work in your subfield used SPSS, so your results will be directly comparable. Recent examples analyzed samples ranging from small psychometric subsamples to survey analyses of several thousand cases [9].
What R Does Best
R is a programming language built for statistics, maintained by the R Project for Statistical Computing. You type commands, save them in a script (a plain-text file that records every step), and run them against your data. Most people work inside RStudio, a free interface that adds a script editor, a console, and a plot pane. Add-on code ships as packages, installable bundles contributed by the community and hosted on the Comprehensive R Archive Network (CRAN).
Three capabilities set R apart for psychological and social science research.
First, new methods appear in R first. Psychological network analysis, which treats symptoms or constructs as nodes in a graph and estimates which connections are strongest, is the clearest recent example. A study of 586 nurses computed baseline descriptives in IBM SPSS Statistics, then performed the network analysis in R, using the qgraph package for visualization, the qgraph and networktools packages for centrality indices, and the bootnet package for accuracy estimation and stability testing [5]. Centrality indices identify the most connected nodes in a network, and bootnet checks whether those estimates are stable enough to interpret. A hemodialysis study used the same division of labor, running latent profile analysis in Mplus 8.3 (a specialized program for latent variable modeling), univariate and multinomial logistic regression in SPSS 26.0, and network analysis in R [4]. Latent profile analysis (LPA) sorts participants into unobserved subgroups based on their response patterns, and multinomial logistic regression extends logistic regression to outcomes with more than two categories, such as membership in one of those subgroups.
Second, R owns machine learning workflows. A prediction study drew 3,107 disabled older adults from the China Health and Retirement Longitudinal Study, used SPSS 27.0 to select candidate risk factors for depression, then built the final models in R 4.3.0, evaluating an XGBoost model with receiver operating characteristic (ROC) curves, calibration plots, and decision curves [6]. XGBoost (extreme gradient boosting) is an ensemble method that combines many decision trees. An ROC curve plots the true-positive rate against the false-positive rate across decision thresholds. Calibration plots check whether predicted probabilities match observed rates, and decision curve analysis estimates the clinical net benefit of using the model at each threshold. The XGBoost model showed the strongest performance among the methods compared, the kind of result that has made R the default environment for prediction modeling in health research.
Third, R makes reproducibility the default. Rerun a script and every number, table, and figure regenerates from the raw data. Combine scripts with report formats that weave code, results, and text together, and your results section updates itself when the data change. As journals and supervisors increasingly ask for analysis code, this workflow stops being a luxury.
Two further points seal the case for learning R at some stage of a research career. It is free, so access never expires with enrollment and it installs on any machine. And its graphics, notably the ggplot2 package, produce publication-grade figures that regenerate with one line after a reviewer request.
How Real Studies Combine SPSS and R
The choice is rarely all-or-nothing. Recent published work shows a practical division of labor:
- A community-engaged cancer education program for African American men analyzed its quantitative data in IBM SPSS version 28 and R/RStudio version 3.6.0 together, including robust partial correlations (associations between two variables while holding others constant, computed in a way that resists outliers) and pre-post comparisons, and handled focus-group themes separately [10].
- A psychometric study of a suicidal intrusions scale ran exploratory factor analysis in SPSS 26/27 and confirmatory factor analysis (CFA) in JASP 0.19.1, a free point-and-click program with strong Bayesian support [11]. CFA tests whether the data fit a prespecified factor structure, the confirmatory counterpart to EFA.
- Structural equation modeling (SEM), the family of methods for testing path and latent-variable models, typically pairs SPSS with AMOS, a dedicated add-on. A mediation study of illness uncertainty and quality of life in 150 patients with coronary artery disease analyzed its multiple mediation model (a model in which intermediate variables carry the effect of one variable to another) in SPSS and Amos [12]. A psychometric evaluation of the Social Self-Compassion Scale used SPSS version 22 for descriptives and reliability and AMOS version 24 for CFA [13].
- Network studies split baseline statistics and network estimation between SPSS and R [4][5].
The pattern is consistent. SPSS anchors the classic analyses, and specialized tools cover the advanced steps. R is the only one of these environments that can absorb every other tool's job inside a single scripted workflow, which is why mixed-method teams increasingly standardize on it for anything beyond the core tests.
SPSS vs R for Psychology Research: The Criteria That Decide
Cost and licensing
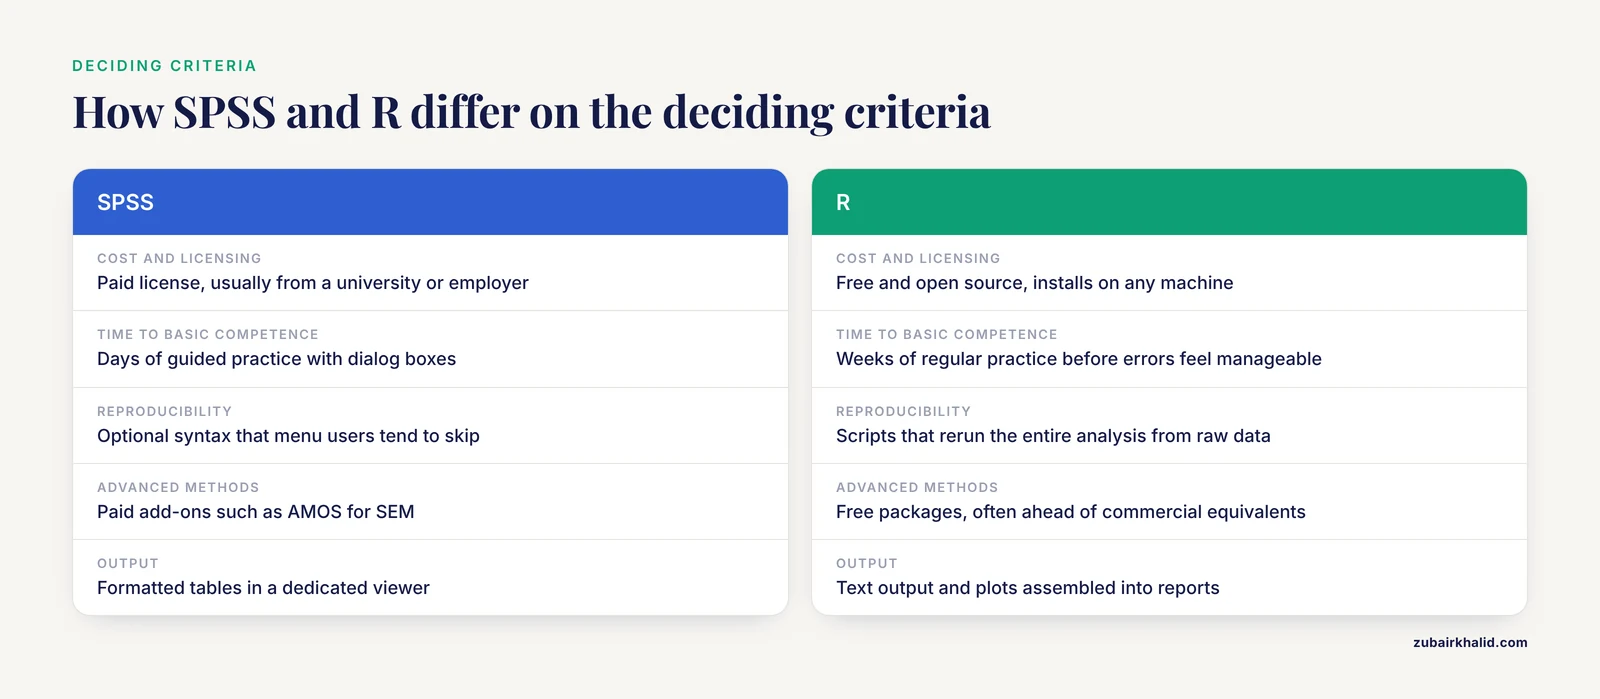
SPSS requires a paid license. Universities provide it on lab machines and sometimes as student subscriptions, but access usually ends when enrollment or employment does. R costs nothing and installs anywhere, including on a laptop you keep after graduation. Over a career that may move between institutions or out of academia, that difference compounds.
Learning curve
SPSS basics take days. Dialog boxes guide you, menus label everything, and the output viewer arranges results for you. R takes weeks of regular practice before error messages stop feeling hostile. The two curves represent different kinds of effort. SPSS effort goes into remembering which menu holds which test. R effort goes into reading and writing code, and that skill transfers directly to data jobs outside academia.
Reproducibility and documentation
Point-and-click leaves no automatic record of what you did. SPSS does include a Paste button that saves each dialog as syntax (its own command language), but most menu users never touch it. R scripts document every decision by default. When a reviewer asks exactly how outliers were handled, or a co-author needs to rerun the model, the script is the answer.
Statistical coverage
Both tools run the standard curriculum: t tests, ANOVA, chi-square, correlation, multiple regression, EFA, and reliability analysis. R additionally covers network psychometrics, machine learning, Bayesian estimation, multilevel models, and meta-analysis through packages, and new methods land there first. SPSS reaches advanced methods through paid add-ons such as AMOS. If your methods section says network analysis, XGBoost, or Bayesian estimation, R is where that work happens today.
Data management
Questionnaire-sized data, from dozens to a few thousand rows, is comfortable in either program. R pulls ahead when you need to merge waves of a longitudinal survey, recode hundreds of items, or repeat an identical cleaning pipeline each time a new data release appears, because those steps can be scripted once and rerun on demand.
Output and reporting
SPSS output tables are formatted and instantly familiar to most committees and reviewers. R output is plainer, but it feeds directly into automated reports and publication-grade graphics. Neither format excuses you from reporting effect sizes (the magnitude of an effect, not just whether it clears the significance threshold) and exact p values in the text.
Worked Scenarios
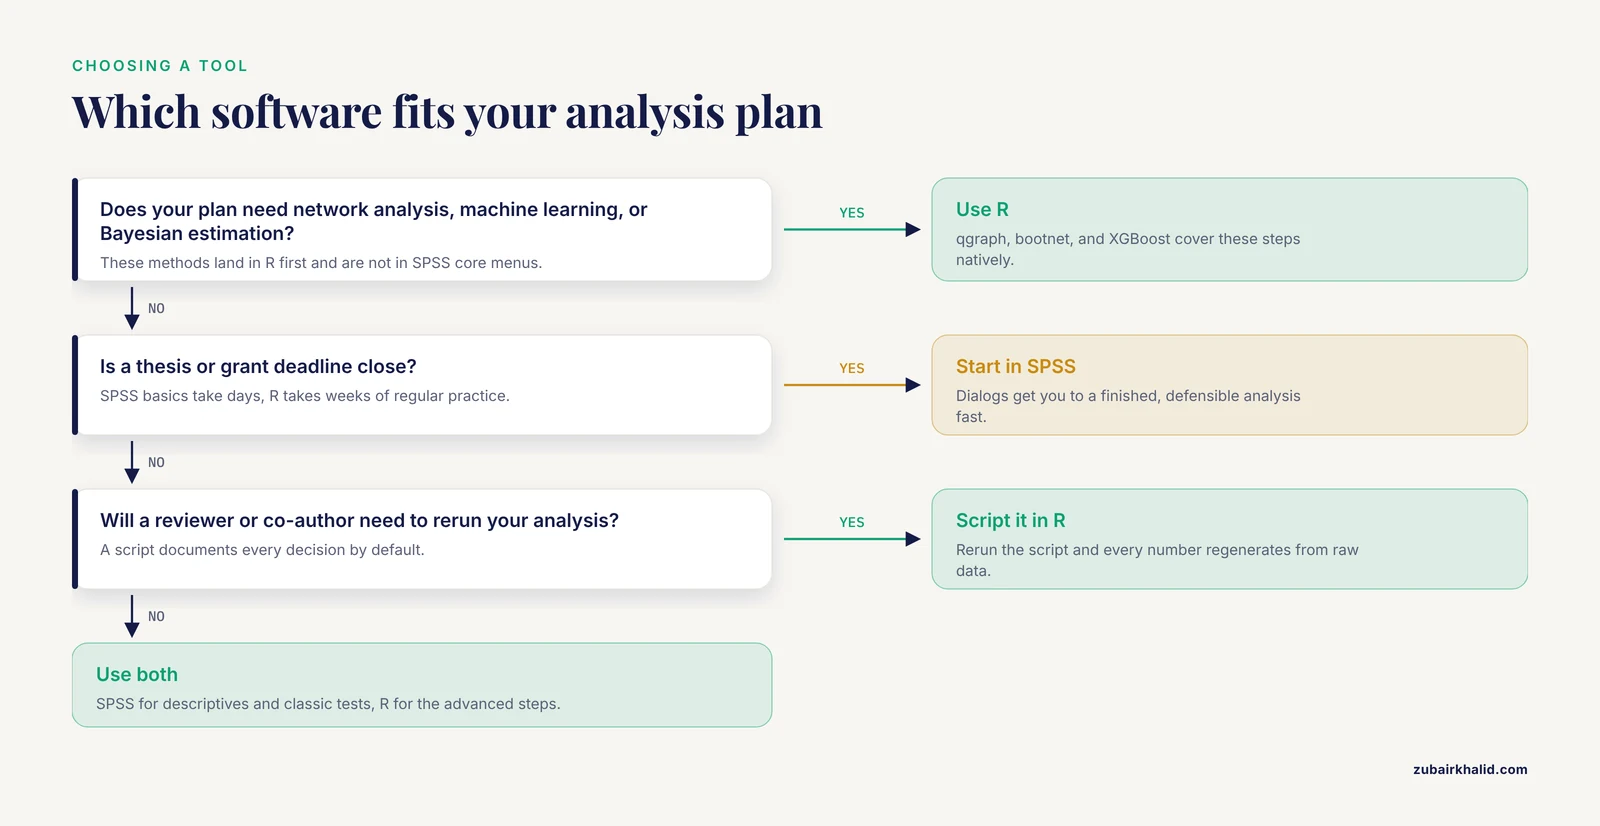
- Master's thesis with 200 questionnaire respondents, comparing groups and predicting a scale score. SPSS alone. The published template is the emergency-nurses design: descriptives, t tests, ANOVA, multiple regression, and correlation, all in one package [1].
- Developing or validating a questionnaire. Run EFA in SPSS, then CFA in AMOS or JASP, mirroring published psychometric workflows [11][13]. If you already know R, its SEM packages keep the whole project in one scripted environment.
- Network analysis of depression, anxiety, and resilience items. R, with qgraph for the network and bootnet for stability checks, and descriptives in SPSS if your team prefers [5].
- Building a risk prediction model from survey data. R, following the published pattern of selecting variables in SPSS and modeling in R [6].
- Secondary analysis of a large longitudinal survey with repeated waves. Either program handles a single model, but a scripted R pipeline pays for itself across waves, recodes, and reviewer revisions.
- Program evaluation with quantitative and qualitative strands. SPSS and R side by side, as in the community cancer education evaluation, with qualitative themes analyzed separately [10].
Common Mistakes and Limitations
- Clicking through menus without saving syntax. If you cannot rerun your analysis from a recorded file, you cannot document it, defend it, or fix it six months later. Use the Paste button every time in SPSS, or work in R scripts from the start.
- Treating software choice as a substitute for analysis quality. No package fixes a weak design, an unvalidated measure, or a convenience sample (one that recruits whoever is accessible rather than a representative group). Several of the studies cited here used convenience sampling, which limits generalizability regardless of which program produced the numbers [1][14][4].
- Copy-pasting R code without reading it. Borrowed code that runs is not borrowed code that is right. Silent errors, wrong defaults, and mismatched variable types produce plausible-looking nonsense. Read every line and inspect the first few rows of every transformed variable.
- Skipping version reporting. Published studies report exact versions because defaults and results can differ across releases. Recent papers in this literature report SPSS versions from 19.0 through 31 [8][9][14], R versions 3.6.0 and 4.3.0 [10], JASP 0.19.1 [11], AMOS 24 [13], and Mplus 8.3 [4]. Report yours the same way.
- Switching packages mid-analysis to chase a significant p value. Running a test in SPSS and then rerunning it in R with different options until something crosses .05 is a questionable research practice, not a robustness check. Decide the analysis plan before you look at results.
- Assuming the programs disagree. For the same data and the same options, a t test in SPSS and a t test in R return the same answer. Differences you see come from defaults, rounding, or missing-data handling, not from the math.
- A final limitation. This is a decision guide, not a methods course. Confirm your analysis plan with a supervisor, a methods consultant, or the reporting standards your target journal requires before you commit to it.
Frequently Asked Questions
Is SPSS or R better for psychology students?
For coursework and a standard thesis, SPSS usually gets you to a finished analysis faster. R is the better long-term investment if you plan a research career, need advanced methods, or want a free tool that follows you after graduation. Many students learn SPSS first and add R when a project demands it.
Do researchers use SPSS and R together in the same study?
Yes, and it is common in current published research. The typical pattern uses SPSS for descriptives and classic tests and R for network analysis or machine learning [4][5][6]. The tools coexist without conflict because both read common data formats such as CSV files.
Is R really free, and does that matter?
Yes. R is open source and costs nothing to download or use on any computer. It matters because access never expires, you can work from any machine, and employers in data-intensive fields value the skill. SPSS access normally depends on an institutional license.
Which software do psychology journals prefer?
Neither. Journals care that the analysis fits the design, the software version is reported, and the results can be reproduced. R scripts make reproduction easier, but SPSS-based analyses are published constantly across psychology, nursing, and health social science [1][3][7].
Can SPSS handle network analysis or machine learning?
Not through its core menus. Teams that need those methods pair SPSS with R or Mplus for those steps [4]. R performs both natively through packages such as qgraph for network visualization and XGBoost for gradient-boosted prediction models.
How long does it take to learn SPSS versus R?
SPSS basics take a few days of guided practice, since dialogs walk you through each test. R takes several weeks to a few months of regular use before scripts feel natural. University short courses and free online materials shorten the R curve considerably.
Sources
- Analysis of influencing factors of risk perception among emergency nurses in China: An observational study.
- Evaluation of obsessive-compulsive disorder prevalence in Iranian patients with multiple sclerosis and its relationship with demographic characteristics.
- Associations of subjective health status and spousal shared activities with depression among married postmenopausal women: a correlational study using data from the ninth wave of the Korean Longitudinal Survey of Women and Families.
- Factors associated with self-advocacy among patients receiving maintenance hemodialysis: a multicenter cross-sectional study using latent profile and network analysis.
- The Interplay of Perceived Organizational Support and Perceived Professional Benefits on Nurses' Flourishing: A Network Analysis.
- Comparison of logistic regression and machine learning methods for predicting depression risks among disabled elderly individuals: results from the China Health and Retirement Longitudinal Study.
- Mediating role of organizational justice in quality of work-life and role-based performance among hospital employees: Cross-sectional research.
- Married Women's Sexual Satisfaction Questionnaire; A Developmental and Psychometric Evaluation.
- Translation, cross-cultural adaptation and psychometric evaluation of the Serbian Ankylosing Spondylitis Quality of Life (ASQoL) Questionnaire (refers to r-axSpA) and its relations with disease activity and functional status indices.
- Using a community-engaged research process to plan, implement, and evaluate a cancer education program to improve knowledge and screening intentions among African American men.
- Cross-Cultural Adaptation and Psychometric Evaluation of the Suicidal Intrusions Attributes Scale (SINAS) in Iranian Adolescents With Suicidal Ideation.
- The pathway analysis of relationship between illness uncertainty, perceived stress, coping strategies, and quality of life in patients with coronary artery disease.
- Psychometric evaluation of the persian version of the Social Self-Compassion Scale (SSCS): associations with Perceived Social Self-Efficacy, fear of negative evaluation, and loneliness among female undergraduate students.
- Vulnerability and Protective Factors Associated With Suicidal Behaviour in Adolescents: A Cross-Sectional Observational Network Analysis Study.