How to Use RevMan for Your Meta-Analysis
By Dr. Zubair Khalid, DVM, MS, PhD ·

By the end of this guide you will be able to create a RevMan review file, add your included studies, enter effect data, choose between fixed-effect and random-effects models, generate and read a forest plot, run subgroup and sensitivity analyses, and export results for your manuscript. You will need RevMan 5 (version 5.3 or 5.4) or an active RevMan Web session installed, your completed study screening, a pre-specified protocol (ideally registered in PROSPERO as recent reviews do [1]), and an extraction spreadsheet with the numbers from each included study.
RevMan (Review Manager) is the free analysis software developed by Cochrane for intervention reviews, and it remains the most frequently reported software in published intervention meta-analyses [2]. Published reviews routinely report their RevMan version in the methods section, for example RevMan 5.3.5 [3], RevMan 5.3 [4], or RevMan 5.4 [5][6].
What RevMan Does and Why Software Choice Matters
RevMan handles the statistical side of an intervention review: pooling effect estimates across studies, computing confidence intervals, quantifying heterogeneity, and drawing forest plots and funnel plots. It also supports structured data collection, risk-of-bias tables, and data extraction workflows, and some teams use it for those tasks even when they run the pooled statistics in another package [7].
Software choice is not cosmetic. A methods-focused comparison of meta-analysis platforms found that results depend on statistical assumptions that are partly determined by the software used, and that details such as the estimator, confidence-interval method, and heterogeneity specification are often incompletely described in publications [2]. Choosing RevMan is a defensible default because reviewers and editors are familiar with its output, but you should state your version and settings precisely when you report.
Before You Open RevMan: Systematic Literature Search and Review Writing

Meta-analysis is the last step of a systematic review, not the first. If your evidence base is weak, no statistical software can fix it.
- Define the review question with a structured framework (population, intervention, comparator, outcomes, study design).
- Plan a systematic literature search across multiple databases. Recent published reviews typically search PubMed, Embase, the Cochrane Library, and Web of Science at minimum, often adding regional or subject databases such as CNKI, Wanfang, Scopus, or CINAHL depending on the topic [5][9][6]. Record the exact search strings, filters, and date restrictions for each database.
- Screen in two stages (title and abstract, then full text) with two independent reviewers, and document reasons for exclusion so you can produce a PRISMA flow diagram [10].
- Extract data with a standardized form and assess methodological quality with a tool suited to your design, such as the Cochrane Risk of Bias tool for randomized trials [11][12] or the Newcastle-Ottawa Scale for observational studies [13].
- Write the literature review sections around the evidence gap your meta-analysis fills. The introduction should establish why the question matters and why pooling is needed. The results of your search and screening belong in the results, not the introduction.
Only once included studies are finalized should you open RevMan. Every study you add later means re-checking the analysis.
RevMan Tutorial Meta-Analysis Step by Step
The walkthrough below uses RevMan 5 desktop conventions, which carry over to RevMan Web with minor menu changes.
Step 1. Create the review file
File > New
  Choose review type: Intervention review
  Title: "Effect of [intervention] on [outcome] in [population]"
  Save the .rm5 file in a backed-up project folder
RevMan organizes a review into five tabs: Title/Protocol, References, Data and analyses, Studies, and Figures (in 5.3, Text of review holds your written sections). Set up the protocol text now, because Cochrane expects the protocol finalized before results are seen.
Step 2. Add included studies
References tab > Studies > right-click > Add Study
  Study ID: e.g. "Chen 2023"
  Data source: PubMed / Embase / etc.
  Under "Notes", attach the risk-of-bias assessment later
Each study appears once and is then linked to data entries. Do not create duplicate study IDs for multiple outcomes or multiple publications of the same trial. If one trial has several papers (for example a main report and a follow-up), enter one study and note the additional references under it.
Step 3. Build comparisons and outcomes
Data and analyses tab > right-click > Add Comparison
  Comparison: "Intervention vs Control"
  Right-click the comparison > Add Outcome
  Data type: Dichotomous  OR  Continuous
  Group labels: "Intervention" / "Control"
  Effect measure: RR (dichotomous) or MD or SMD (continuous)
  Analysis method and model: set in Analysis Details (see Step 5)
The effect measure choice is the single most consequential decision in the dialog:
| Choice | Options in RevMan | Typical use |
|---|---|---|
| Data type | Dichotomous, Continuous, O-E and Variance (Peto), Generic Inverse Variance | Counts and proportions of events, means and SDs, adjusted estimates reported as effect size with standard error |
| Effect measure | RR, OR, RD, MD, SMD | RR for common events in trials, OR when pooling case-control or adjusted analyses, MD when all studies use the same instrument, SMD when instruments differ |
| Statistical method | Mantel-Haenszel, Inverse Variance, Peto O-E | Mantel-Haenszel for dichotomous data, Inverse Variance for continuous and generic data, Peto only for rare events with balanced groups |
| Analysis model | Fixed effect, Random effects | Fixed effect when studies estimate one common effect, random effects when true effects are expected to vary across studies |
| CI / heterogeneity | 95% CI default, Chi², I² | Defaults suit most reports |
Use a mean difference (MD) when every study measures the outcome on the same scale. Use a standardized mean difference (SMD) when studies use different instruments, and state the direction of the scale because SMDs of 0.2, 0.5, and 0.8 conventionally indicate small, moderate, and large effects. Published RevMan analyses use both, for example MDs for sperm concentration outcomes [3] and SMDs for circulating biomarker outcomes [12].
Step 4. Enter the data
For a dichotomous outcome, RevMan asks for the number of events and the total number of participants in each group. For a continuous outcome, it asks for the mean, standard deviation, and total for each group.
Here is a demonstration dataset for a continuous outcome (three hypothetical studies, outcome measured so lower is better):
Study   Intervention            Control
        n    mean    SD         n    mean    SD
Study A 40   8.2     1.5        40   9.5     1.6
Study B 60   7.9     1.4        58   9.1     1.5
Study C 30   8.5     1.7        32   10.0    1.8
In RevMan 5, analysis cells are locked by default. Click the padlock icon in the analysis toolbar to unlock data entry, then type values row by row, or click "Add Study Data" and select your studies. RevMan computes each study's MD and weight automatically.
Expected output in the forest plot and text view:
Study or Subgroup   IV, Fixed   Weight   MD, 95% CI
Study A             (plot)      30.4%    -1.30 [-1.96, -0.64]
Study B             (plot)      51.1%    -1.20 [-1.72, -0.68]
Study C             (plot)      18.5%    -1.50 [-2.37, -0.63]
Total (95% CI)                  100%     -1.29 [-1.66, -0.91]
Heterogeneity: Chi² = 0.34, df = 2 (P = 0.84), I² = 0%
Test for overall effect: Z = 6.73 (P < 0.00001)
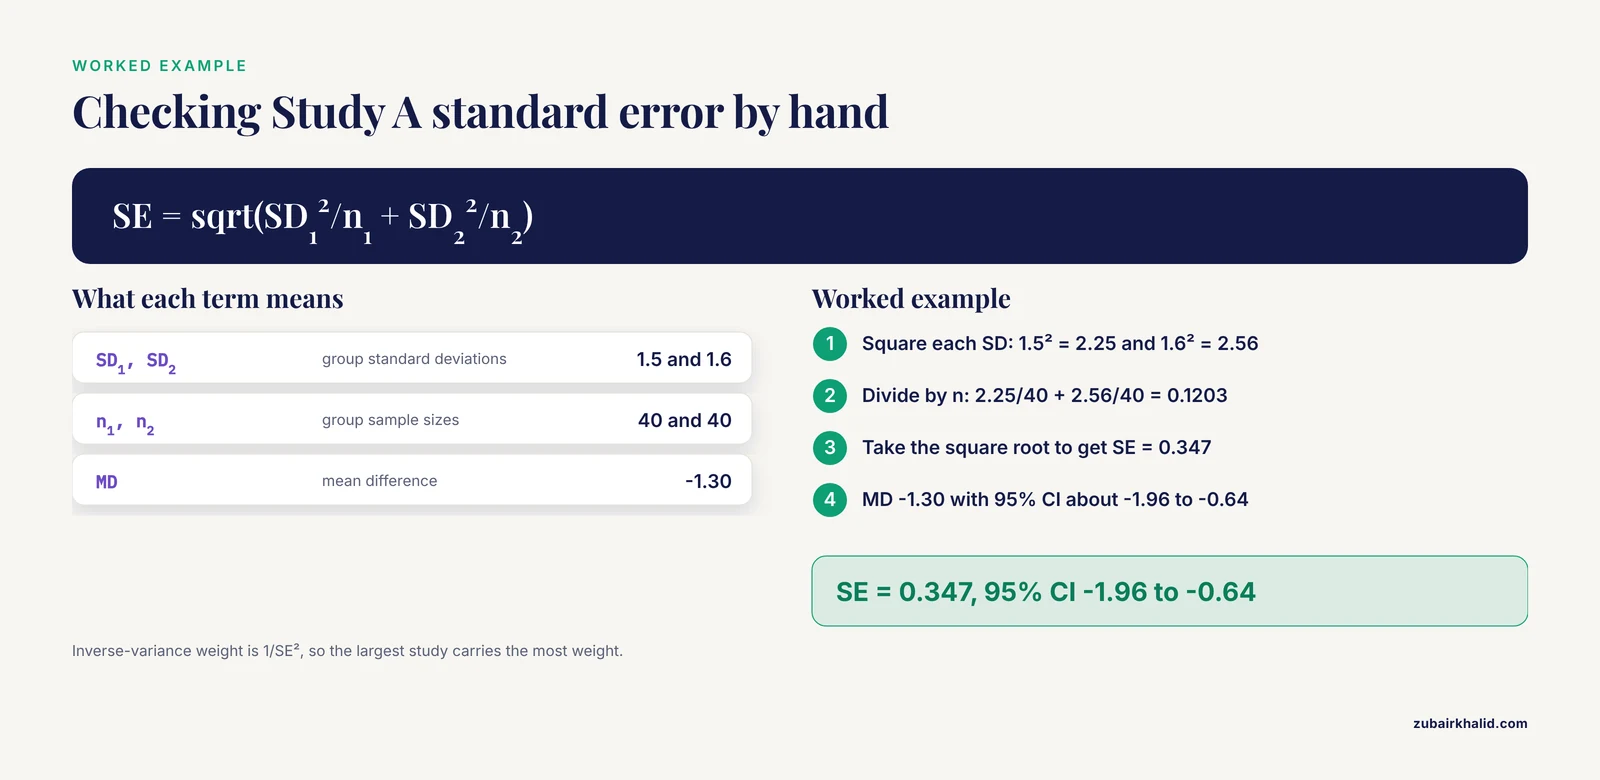
The numbers reconcile with hand calculation. Study A's standard error is the square root of (1.5²/40 + 1.6²/40), which is 0.347, giving an MD of -1.30 with a 95% CI of about -1.96 to -0.64. Inverse-variance weights are 1/SE², so Study B (the largest, most precise study) carries the greatest weight, and the pooled MD of -1.29 sits closest to Study B's estimate. Zero heterogeneity means the three studies agree closely, which the near-zero Chi² statistic confirms.
Step 5. Choose the statistical model
Right-click the outcome, open Analysis Details, and set the model.
Fixed-effect model. Assumes all studies estimate one true effect. RevMan 5 uses inverse-variance weighting. Use it when studies are clinically and methodologically homogeneous and I² is low.
Random-effects model. Assumes true effects vary between studies and adds a between-study variance component (in RevMan 5, estimated with the DerSimonian-Laird moment estimator) so that smaller studies get relatively more weight. Use it when heterogeneity is expected or observed. Recent reviews pooling complex, variable outcomes generally choose random effects and say so in the methods [7][14].
A practical reporting habit: state both the model and the statistical method in your methods section, for example "random-effects meta-analysis using the DerSimonian-Laird method in RevMan 5.4" [6][12]. Reporting analyses rarely specify the estimator, which is a documented reproducibility gap [2].
Step 6. Read the forest plot
Every RevMan forest plot contains the same elements, and you should be able to explain each one:
- Squares and horizontal lines. Each square is a study's point estimate, sized by its weight. The line is the 95% confidence interval.
- Diamond. The pooled estimate. Its center is the point estimate and its width is the confidence interval. If the diamond crosses the vertical line of no effect, the pooled result is not statistically significant.
- Heterogeneity statistics. Chi² tests whether observed variation exceeds chance, and I² describes what percentage of the variation across studies is due to heterogeneity rather than sampling error. Values near 0% indicate consistency. Substantial heterogeneity warrants exploration through subgroups rather than being ignored.
- Test for overall effect. The Z statistic and its P value test whether the pooled estimate differs from no effect.
- Log scale. For RR and OR, RevMan plots on a log scale, so the line of no effect sits at 1.0, not 0.
Real published outputs look exactly like this structure. A RevMan 5.3.5 analysis of kidney-tonifying prescriptions reported an MD of -6.50 (95% CI -7.88 to -5.11) for DNA fragmentation index and an RR of 2.11 (95% CI 1.12 to 4.00) for spouse pregnancy rate [3]. A RevMan 5.3 analysis of intraocular lenses reported that extended depth of focus lenses gave better corrected distance visual acuity, with no difference in several other outcomes [4].
Step 7. Assess risk of bias
Studies tab or References > Study > Add Study Risk of Bias
  Domain: sequence generation, allocation concealment,
  blinding, incomplete outcome data, selective reporting,
  other bias (RevMan 5 tool)
  Judgment: Low risk / Unclear / High risk, with a supporting quote
In RevMan Web, the current Cochrane RoB 2 tool is integrated. Some teams perform risk-of-bias assessment in Review Manager even when pooling elsewhere, which is a recognized workflow [8]. Published reviews report the assessment alongside the meta-analysis so readers can judge whether bias could explain the pooled effect [11][12].
Step 8. Subgroup, sensitivity, and funnel plots
Right-click the outcome > Add Subgroup  (for example "myopic vs pre-myopic children")
Right-click the outcome > Sensitivity analysis: duplicate the outcome,
  remove one study at a time, or switch fixed/random to test robustness
Figures > Funnel plot  (requires at least 10 studies to be meaningful)
RevMan adds a test for subgroup differences beneath the plot automatically. A published RevMan 5.4 myopia-control review used exactly this workflow, showing a larger treatment effect in myopic children than in pre-myopic children through subgroup analysis [6]. A RevMan-based exercise-intervention review combined subgroup analysis, sensitivity analysis, and publication-bias evaluation in the same file [12].
Step 9. Export and report
File > Export > Analysis Data (csv)
Right-click the forest plot > Save as image (high resolution for publication)
Export both the data and the figures. In your manuscript, report the software name and version, the effect measure, the statistical method, the model, and how heterogeneity was assessed. An audit of published meta-analyses found that software versions, estimators, interval methods, and heterogeneity specifications are frequently incompletely described, so filling those gaps makes your work reproducible [2].
RevMan Tutorial Meta-Analysis Tips
- Enter raw counts, not derived effect sizes, whenever possible. Mantel-Haenszel and inverse-variance methods compute weights correctly from raw data. Use Generic Inverse Variance only when studies report an adjusted effect estimate with a standard error and raw data are unavailable.
- Keep one extraction spreadsheet as the master. Enter data into RevMan from it, then cross-check every row against the source paper. Data-entry errors are among the most common reasons a pooled estimate changes after revision.
- Name outcomes precisely. "Balance (Berg Balance Scale, 0 to 56, higher is better)" is better than "balance," because a published RevMan analysis of hippotherapy reported a Berg Balance Scale MD of 1.72 (95% CI 1.38 to 2.07) in favor of the intervention, and readers need to know the scale direction to interpret that [1].
- Plan the analysis to mirror your protocol. Pre-specify primary outcomes, subgroups, and the model choice in PROSPERO before analysis, as registered reviews do [1][15].
- Save incrementally and version your file. RevMan files are binary. Keep dated copies so you can return to the pre-reviewer-comment version.
- Record why you chose each setting. When a reviewer asks why you used a random-effects model or an SMD, you should have the answer in your protocol or analysis log, not reconstructed from memory.
Common Mistakes and Limitations
These are the errors that appear most often in RevMan projects and in the published literature.
- Not stating the software version. Published reviews vary between RevMan 5.3.5 [3], 5.3 [4], and 5.4 [5][6][12], and many papers omit the version entirely even though results can depend on software assumptions [2]. Report the exact version.
- Defaulting to fixed effect with heterogeneous studies. When I² is high, a fixed-effect model answers a question nobody asked (one common effect) and hides real between-study variation. Justify the model rather than accepting the default.
- Mixing instruments into an MD. If three studies used three different depression scales, an MD in raw units is meaningless. Convert to SMD or pick the most common instrument and analyze the rest narratively.
- Unit-of-analysis errors in multi-arm trials. If a trial has two intervention arms sharing one control group, entering the control group twice double-counts participants. RevMan expects one pair of columns per study, so combine the relevant arms or split the shared group first.
- Entering SD where SE is required. A study reporting a standard error of 0.5 entered into the SD column produces a wildly overconfident estimate. Convert first (SD = SE × square root of n) or use Generic Inverse Variance with the estimate and SE directly.
- Ignoring heterogeneity instead of explaining it. A large I² is a finding, not a nuisance. Explore it with pre-specified subgroups, as reviews do for population or intervention characteristics [6], rather than hiding it behind a random-effects label alone.
- Over-reading small meta-analyses. A funnel plot with six studies cannot distinguish asymmetry from chance, and a pooled estimate from a handful of small trials carries wide uncertainty even when the P value is small.
- Using RevMan for analyses it does not support. RevMan has no built-in meta-analysis of single proportions or of diagnostic test accuracy with modern hierarchical models. Reviews focused on pooled prevalence commonly use Stata, R, or JASP instead [10][16][17], and flexible platforms such as R, Stata, and JASP implement modeling options, prediction intervals, and sparse-data handling that RevMan restricts [2].
The overarching limitation is shared by all meta-analysis software: RevMan pools what you enter. Selection bias, unmeasured confounding, or biased extraction will propagate straight into the pooled diamond.
When to Move Beyond RevMan
Stay with RevMan when you are doing a conventional pairwise intervention meta-analysis of randomized trials, which is the software's core strength and the reason it dominates published intervention meta-analyses [2]. Move to a script-based environment when you need meta-regression with covariates, network meta-analysis, hierarchical diagnostic-accuracy models, prediction intervals, or custom handling of sparse data. A recent comparison of Review Manager, Meta-DiSc, Comprehensive Meta-Analysis, R, and Stata found that the platforms differ in how they implement between-study variance estimation, confidence-interval construction, prediction intervals, and sparse-data handling, with script-based tools offering the most flexibility and auditability [2].
Two free, accessible alternatives deserve mention. JASP offers a meta-analysis module with a graphical interface designed to make rigorous, reproducible meta-analysis available without programming, and it ships with tutorial videos [16]. R provides the widest methodological range but requires scripting, which is why reviews needing advanced methods such as trial sequential analysis or custom estimators migrate there [13][7][15].
A reasonable compromise used by many teams: run the pairwise pooling and forest plots in RevMan 5.4, perform risk-of-bias assessment in the same file [8], and run supplementary analyses (Egger's test, meta-regression, dose-response) in R or Stata, reporting both packages in the methods [9][11].
Frequently Asked Questions
Is RevMan free to use?
Yes. RevMan is developed by Cochrane and is free to use, including for non-Cochrane systematic reviews, which is one reason it remains the most frequently reported software in published intervention meta-analyses [2].
What is the difference between RevMan 5 and RevMan Web?
RevMan 5 is the classic desktop application in versions such as 5.3 and 5.4, while RevMan Web is Cochrane's updated browser-based platform. Both support the core intervention-review workflow, and published reviews report using either, including RevMan 5.4 for recent pooled analyses [5][6].
How do I choose between a fixed-effect and random-effects model?
Use fixed effect when studies are clinically and statistically homogeneous, and random effects when true effects are expected to differ across studies. Reviewers increasingly default to random effects for variable real-world outcomes and state the choice explicitly in their methods [7][14].
What does I² actually tell me?
I² describes the percentage of variation across studies that is due to heterogeneity rather than chance, with values near 0% indicating consistent studies. Read it alongside the underlying Chi² test and the clinical context, and investigate substantial heterogeneity through subgroups [6][12].
When should I use MD versus SMD?
Use MD when all studies measure the outcome on the identical scale with the same units, and SMD when scales differ. Published RevMan analyses show both patterns, such as MDs for sperm parameters [3] and SMDs for biomarker outcomes [12].
Can I do a meta-analysis of prevalence in RevMan?
Not directly, because RevMan lacks a built-in single-proportion meta-analysis with back-transformation. Reviews focused on pooled prevalence typically use Stata, R, or JASP with appropriate transformations, even when they use RevMan for other steps such as risk of bias [10][8][17].
Do I need to report which RevMan version I used?
Yes. Reporting the version, estimator, interval method, and model is part of reproducible practice, and audits show these details are often missing from published meta-analyses even though results can depend on software assumptions [2].
What if my meta-analysis needs meta-regression or network meta-analysis?
Use a more flexible platform. R and Stata support meta-regression, network meta-analysis, prediction intervals, and custom sparse-data handling, and recent reviews that required those methods performed their analyses in R or Stata rather than RevMan [13][15][18].
Sources
- Effectiveness of Hippotherapy in Balance Rehabilitation for Stroke Patients: A Systematic Review and Meta-analysis of Randomized Controlled Trials.
- Reporting and interpreting meta-analysis software choices: practical guidance for researchers, reviewers, and editors.
- [[Systematic review and meta-analysis of tonifying kidney prescriptions for the treatment of male infertility with sperm DNA fragmentation].](https://pubmed.ncbi.nlm.nih.gov/43012264/)
- Comparison of clinical outcomes of trifocal versus extended depth of focus intraocular lenses: meta-analysis of randomized controlled trials.
- [[Prevalence and influence factors of sexual dysfunction in male patients undergoing maintenance hemodialysis: A Meta-analysis].](https://pubmed.ncbi.nlm.nih.gov/43012234/)
- Effectiveness of spectacle lenses with highly aspherical lenslets (HAL) in slowing axial elongation and spherical equivalent refraction progression in myopic and pre-myopic children: a systematic review and meta-analysis.
- Long-term quality of life, rehospitalization risks, and economic viability of remote cardiac rehabilitation: an updated systematic review and meta-analysis.
- Efficacy of ginger on chemotherapy-induced nausea and vomiting in breast cancer: A meta-analysis.
- Influencing Factors of Medical Narrative Competence Among Clinical Nurses in China: A Systematic Review and Meta-Analysis.
- Prevalence of bronchial asthma among adults in Saudi Arabia: a systematic review and meta-analysis (2010-2025).
- The impact of cognitive behavioral therapy and third-wave therapies on the quality of life of patients with obsessive-compulsive disorder: a systematic review and meta-analysis.
- Structured effects of exercise on circulating brain-derived neurotrophic factor (BDNF) in postmenopausal women: a meta-analysis.
- Risk factors for Gram-negative bacterial bloodstream infections: a systematic review and meta-analysis with subgroup analyses for carbapenem-resistant organisms and Acinetobacter baumannii.
- Effects of mobile apps on maternal weight-related and neonatal birth weight outcomes during pregnancy: a systematic review and meta-analysis.
- Optimizing Dry Eye Disease Management with Topical Anti-Inflammatory or Immunomodulatory Drugs Combined with Artificial Tears: A Systematic Review and Meta-Analysis of Clinical Trials.
- Meta-analysis with JASP, Part I: Classical approaches.
- Prevalence of Post-Traumatic Stress Disorder in Iranian Intensive Care Unit Survivors and Related Factors: A Systematic Review and Meta-Analysis.
- Prevalence, risk factors, and clinical outcomes of hepatitis E infection in pregnant women in Sub-Saharan Africa: a systematic review and meta-analysis.