Research Proposal Timeline Template: How to Create a Gantt Chart
By Dr. Zubair Khalid, DVM, MS, PhD ·

By the end of this guide you will have a working Gantt chart for your own proposal, built from a task list you control. You will be able to break the project into phases, estimate how long each task takes, sequence the work, compute start and end dates with spreadsheet formulas, and render the chart in Excel, Google Sheets, Mermaid, or R.
You need three things on hand: your draft list of tasks, your target start and end dates, and a spreadsheet application. Excel and Google Sheets both work, and Google Sheets is free with a Google account. Every example below uses the same 12-month project starting January 1, 2026, so you can check your own numbers against mine.
A research proposal timeline template earns its place in a proposal because reviewers read it as a feasibility test. If the chart shows manuscript writing starting before analysis ends, or data collection squeezed into two weeks, a reviewer questions the whole plan. The same file becomes your working schedule after funding, which is why the steps below build something you keep updating rather than a one-time figure.
What a Research Proposal Timeline Template Contains
A Gantt chart is a horizontal bar chart in which each row is a task, the horizontal axis is time, and each bar spans the dates when that task is active. A complete research proposal timeline template has six parts:
- Task rows, usually 10 to 25, grouped into phases such as setup, approvals, data collection, analysis, and writing.
- A time axis, in months for a 12-month or multi-year project, or in weeks for a short pilot.
- Bars showing when each task runs.
- Milestones, zero-length markers for decisions and deliverables such as ethics approval or database lock.
- Dependencies, the rule that one task cannot start until another finishes.
- Owners, the person responsible for each row, which matters the moment more than one person works on the project.
The same file serves two jobs. In the proposal it is a static one-page figure. After funding it becomes the live schedule you update at each milestone. Build it once, properly, and it does both.
Start With a Task List, Not a Chart
Chart software cannot fix a badly chosen task list. Write the list first as a work breakdown structure, which means the project split into chunks small enough to estimate and assign. For a typical life science proposal, 10 to 25 rows is the useful range. Fewer than 10 hides real work, more than 25 turns the figure into wallpaper.
Group rows into five phase blocks:
- Setup and literature. Concept development, framework, and any review work that justifies the study.
- Approvals. Protocol finalization, Institutional Review Board (IRB) or ethics committee review, site agreements.
- Data collection. Pilots, recruitment, interviews, surveys, lab work, or field work.
- Analysis. Cleaning, coding, modeling, interpretation.
- Writing and dissemination. Manuscripts, theses, reports, conference presentations.
Bound the literature phase deliberately. A published systematic review of biodegradable magnesium alloys for orthopedic implants, for example, mapped composition design, fabrication processing, surface modification, and biological mechanisms specifically to provide a theoretical foundation for later product development [1]. That is a bounded scope with a defined endpoint. Decide what your review must answer, and let that decision set the length of the row.
Sequence multi-site work as waves rather than one long bar. An implementation study in Uganda, for instance, assigned 12 districts to four sequential rollout waves following a 2-district pilot phase, introducing the implementation package over a one-year period [2]. On a Gantt chart that structure appears as a short pilot bar followed by staggered wave bars, which tells a reviewer far more than a single 12-month bar labeled rollout.
Research Proposal Timeline Template Step by Step
The steps below build the chart in a spreadsheet, then show two text-based alternatives for teams that keep proposals in version control.
Step 1: List every task and owner
Open a sheet and set up columns: A for Task, B for Start, C for Duration (days), D for End, and E onward for the month grid. Enter each task from your work breakdown structure as one row, with the responsible person in a final column if the team is larger than one. Keep task names under about six words so the printed chart stays readable.
Step 2: Estimate each duration
Estimate in the unit you will chart. For a 12-month project, months are the honest planning unit, converted to days for the formulas (calendar-day arithmetic treats a month as roughly 30 days).
Use real workloads as anchors rather than guesses. A published scoping review of foot drop after lumbar decompression, a review type that maps available evidence without the narrow inclusion rules of a systematic review, identified 1,195 records, screened 1,068 after removing duplicates, and included 22 studies [3]. If your proposal contains a systematic or scoping review, plan the screening stage in weeks, not days. Interview studies scale differently. A human-centered design study of trauma-informed care built its inspiration phase from 18 semistructured interviews with providers at one center [4], a realistic scale for a single-site qualitative phase. Count your planned interviews, add transcription and coding time, and write the total into the row.
For lab work, estimate from a pilot run or from the manufacturer's protocol timing, then add the turnaround you cannot control, such as ordering lead times and core facility queues.
Step 3: Sequence tasks and mark dependencies
A dependency states that one task cannot start until another finishes, the most common form being finish-to-start. Draw arrows on paper between your rows, then order the sheet so every task appears after its prerequisite. The chain of tasks with no slack, meaning no buffer between them, is the critical path. Any delay on the critical path moves the end date by the same amount. Mark those rows, because they are where your monitoring attention belongs after funding.
Step 4: Compute dates with formulas
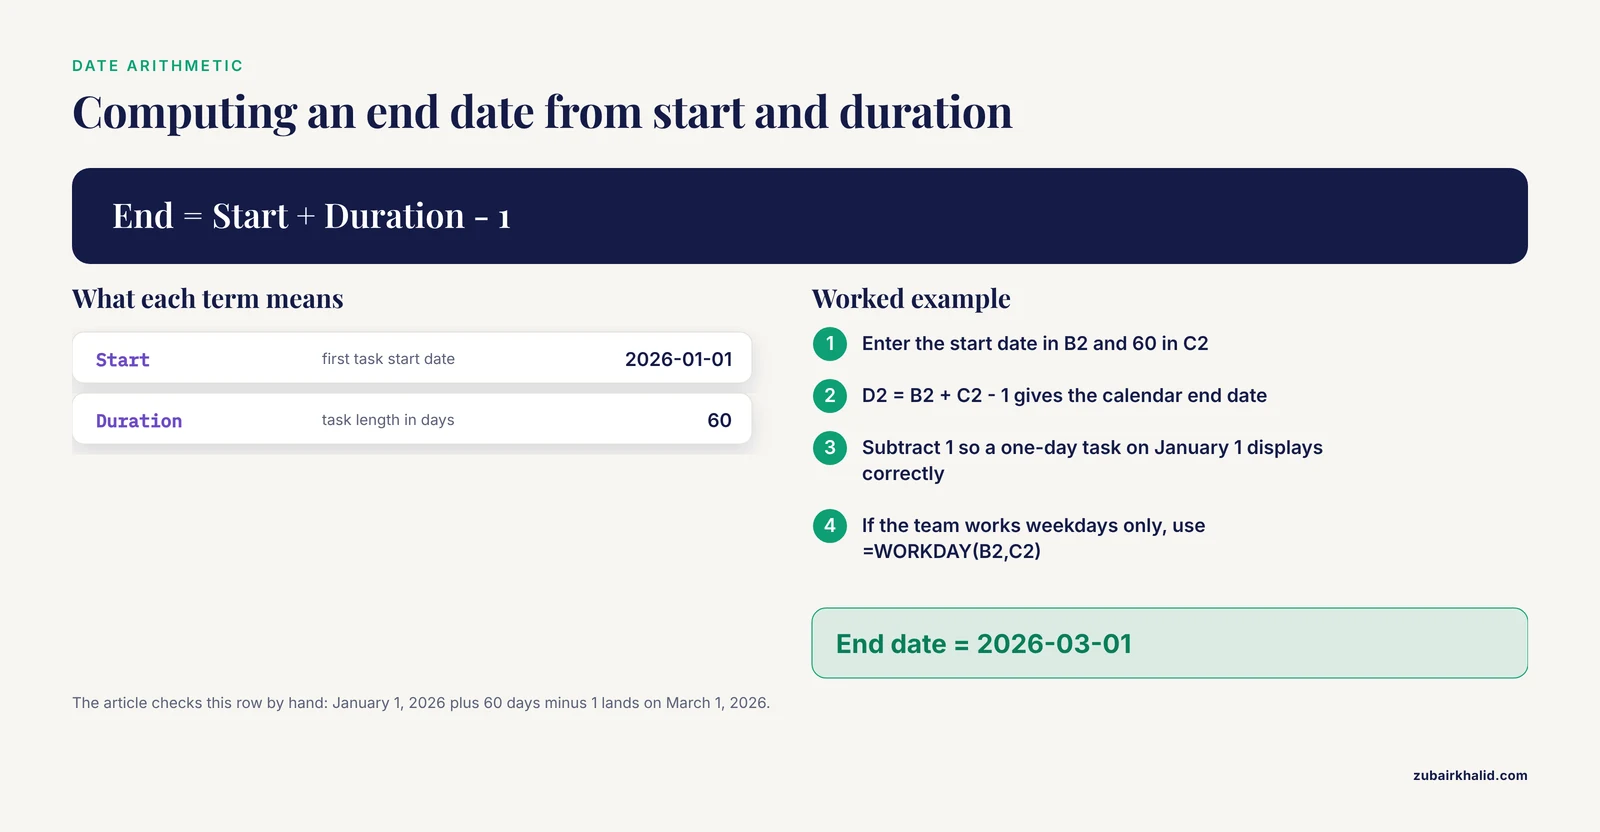
Enter the first start date in B2, then compute the rest:
D2:  =B2+C2-1
B3:  =D2+1
The first formula computes the calendar end date, subtracting 1 so that a one-day task on January 1 displays correctly. The second starts the next task the day after its dependency ends. If the team works weekdays only, replace the first formula with =WORKDAY(B2,C2), which returns the date C2 working days after B2 and skips weekends.
Check one row by hand before trusting the column. January 1, 2026 plus 60 days minus 1 lands on March 1, 2026, which matches the worked example below.
Step 5: Draw the chart
Two methods work in both Excel and Google Sheets. Method A gives the classic bar figure for the proposal. Method B gives a month grid that doubles as a tracking sheet.
Method A, stacked bar chart:
- Select the Task, Start, and Duration columns, including headers.
- In Excel, choose Insert, then Stacked Bar. In Google Sheets, choose Insert, then Chart, and pick Stacked bar chart.
- Set the Start series to no fill. In Excel, click the series, open Format Data Series, and choose No fill. In Google Sheets, open Customize, then Series, select Start, and set Fill opacity to 0 percent.
- Reverse the row order so the first task appears at the top. In Excel, right-click the vertical axis, choose Format Axis, and check Categories in reverse order. In Google Sheets, sort the table in descending order before inserting the chart.
- Set the horizontal axis minimum to the project start date so the bars fill the page.
Expected output: one horizontal bar per task, beginning at its start date, with length proportional to duration, and milestones appearing as thin slivers.
Method B, conditional-formatting grid:
Fill row 1 with month start dates. Enter 2026-01-01 in E1, then =EDATE(E1,1) in F1 and drag across twelve columns. EDATE returns the same day one month later. In E2, enter:
=IF(AND(E$1<=$D2, EOMONTH(E$1,0)>=$B2), 1, "")Drag the formula across the grid. EOMONTH(E1,0) returns the last day of the month in E1, so the cell fills with 1 whenever the task overlaps that month. Apply conditional formatting so cells equal to 1 take a fill color. In Google Sheets, use Format, then Conditional formatting, then Cell is equal to 1. In Excel, use Home, then Conditional Formatting, then Highlight Cells Rules, then Equal To.
Expected output: a colored band per task across its active months, in a chart that reads correctly even in black-and-white printing.
When the chart looks wrong
#VALUE!in the End column. The duration cell holds text such as "8 weeks". Enter a plain number of days and keep the units in the header.#NAME?in the End column. The function name is misspelled, or an older Excel version lacks EOMONTH or EDATE. Check spelling first.- Google Sheets error: "Function AND parameter 1 expects boolean values. But '1/1/2026' is a text and cannot be coerced to a boolean." The header date was stored as text. Re-enter it as a real date, or use
=DATE(2026,1,1)in E1. - Every bar starts at the left edge. The Start series is still filled. Set it to no fill.
- Bars cluster far to the right in Excel. The date axis minimum defaults to 0. Set the axis minimum to the first start date.
- Mermaid refuses to render and reports a parse error naming a line. A comma is missing in that task definition. Keep the pattern
name :id, after id, 30d.
Step 6: Add milestones and decision points
A milestone is a zero-length marker for a decision or a delivery. Add at least four: approvals secured, pilot complete, analysis complete, and final deliverable. In the stacked bar chart, a milestone is a task with a duration of 1 day, which renders as a thin bar. In the grid, give milestones their own row.
Make decision points explicit rather than implied. A proposed two-stage adaptive trial design for biosimilar studies, for example, allows decision-making at the end of the first stage, avoids duplicated effort, and shortens the overall development process [5]. The scheduling lesson generalizes. When a phase can stop, pivot, or proceed, put that decision on the chart as its own milestone, with the criteria written in the proposal text.
Step 7: Check the chart against the deadline
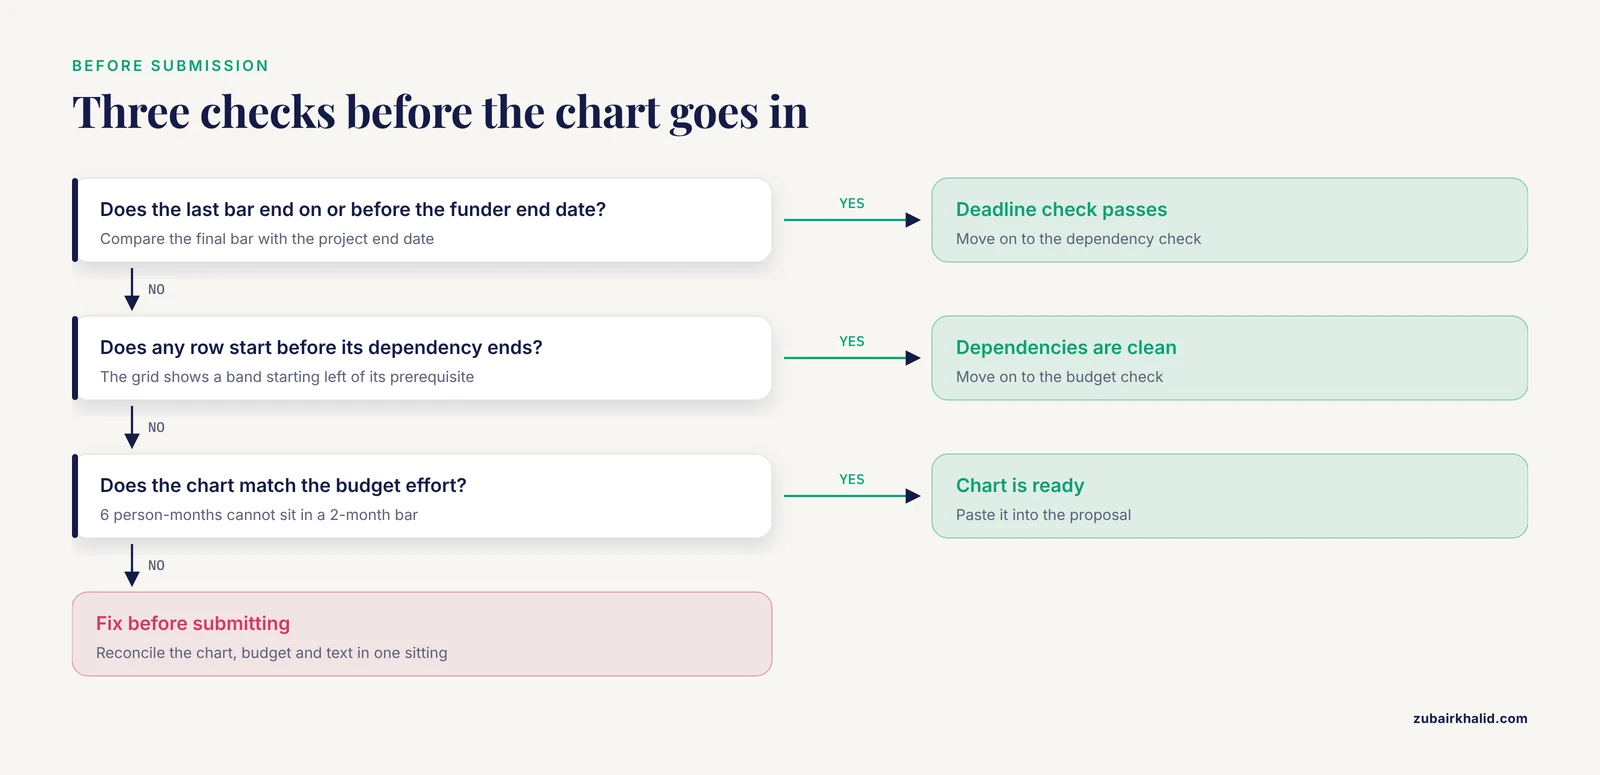
Three checks before the chart goes into the proposal. First, confirm the last bar ends on or before the funder's project end date. Second, confirm no row starts before its dependency ends, which the grid makes visible as a band starting left of its prerequisite's band. Third, confirm the chart matches the budget. If the budget charges 6 person-months (one person working full time for 6 months) to a task the chart gives 2 months, one of the two documents is wrong.
A Worked 12-Month Example
The table below shows a complete 12-month mixed methods project, the structure you would chart for an interview-plus-survey study. Dates use calendar-day arithmetic with the formulas above.
| Task | Start | Days | End |
|---|---|---|---|
| Literature review and concept development | 2026-01-01 | 60 | 2026-03-01 |
| Protocol finalization | 2026-02-15 | 30 | 2026-03-16 |
| IRB approval (milestone) | 2026-03-31 | 1 | 2026-03-31 |
| Pilot testing | 2026-04-01 | 30 | 2026-04-30 |
| Qualitative interviews | 2026-05-01 | 60 | 2026-06-29 |
| Survey data collection | 2026-06-01 | 90 | 2026-08-29 |
| Transcription and data cleaning | 2026-06-15 | 75 | 2026-08-28 |
| Analysis | 2026-09-01 | 60 | 2026-10-30 |
| Manuscript drafting | 2026-10-15 | 60 | 2026-12-13 |
| Revisions and final report | 2026-12-01 | 31 | 2026-12-31 |
Two features deserve attention. The interview and survey bars overlap by a month, which is deliberate. A mixed methods study (one combining qualitative and quantitative data) at a Norwegian university hospital gathered qualitative data from September 2023 to January 2024 and quantitative data from January 2024 to July 2024, so the two streams ran in sequence with a deliberate overlap at the transition [6]. Charting the overlap honestly signals to reviewers that you have thought about how one stream informs the other.
The second feature is the milestone row. IRB approval sits at the end of March as a one-day bar, and everything after it depends on that date. If the review board takes longer than planned, every later bar moves, which is exactly the conversation you want to have with yourself in month 2 rather than month 6.
Built with Method B, this table produces ten colored bands across twelve month columns, a single colored cell for the milestone at the end of March, and a visible overlap between the two collection bands in June.
Formula Reference
The formulas below cover everything the example uses.
| Goal | Formula | Returns |
|---|---|---|
| End date from start and duration | =B2+C2-1 | Calendar end date |
| End date in working days | =WORKDAY(B2,C2) | End date skipping weekends |
| Next month in the header row | =EDATE(E1,1) | Same day, next month |
| Last day of a header month | =EOMONTH(E1,0) | Month end date |
| Grid cell, task active in month | =IF(AND(E$1<=$D2,EOMONTH(E$1,0)>=$B2),1,"") | 1 when the task overlaps the month |
| Today marker row | =IF(AND(E$1<=TODAY(),EOMONTH(E$1,0)>=TODAY()),1,"") | 1 in the current month |
The dollar signs matter. In E$1, the row is locked so the formula can drag downward, while the column letter stays relative so the formula can drag across.
Tool Options Compared
| Tool | Best for | Effort | Notes |
|---|---|---|---|
| Excel or Google Sheets | Most proposals | Low | Both methods above, easy co-editing in Sheets |
| Mermaid | Markdown documents and repositories | Low | Chart lives as plain text beside the writing |
| R with ggplot2 | Figures that must regenerate from data | Medium | Reproducible and scriptable |
| Project management software | Multi-person teams with many dependencies | Medium to high | Usually overkill for a proposal figure |
Mermaid. Mermaid renders charts from plain text, so the figure version-controls alongside your proposal:
gantt
    title 12-Month Mixed Methods Project
    dateFormat  YYYY-MM-DD
    section Setup
    Literature review        :t1, 2026-01-01, 60d
    Protocol finalization    :t2, after t1, 30d
    IRB approval             :milestone, m1, after t2, 0d
    section Data collection
    Pilot testing            :t3, after m1, 30d
    Qualitative interviews   :t4, after t3, 60d
    Survey data collection   :t5, after t4, 90d
    section Analysis and writing
    Analysis                 :t6, after t5, 60d
    Manuscript drafting      :t7, after t6, 45d
    Final report             :milestone, m2, after t7, 0d
The after keyword chains tasks to their dependencies, so changing one date reschedules everything downstream.
R. For a figure that regenerates whenever the plan changes:
library(ggplot2)
tasks <- data.frame(
  task  = c("Literature review", "Protocol", "Pilot", "Interviews",
            "Survey", "Analysis", "Writing"),
  start = as.Date(c("2026-01-01", "2026-02-15", "2026-04-01", "2026-05-01",
                    "2026-06-01", "2026-09-01", "2026-10-15")),
  days  = c(60, 30, 30, 60, 90, 60, 60)
)
tasks$end <- tasks$start + tasks$days
ggplot(tasks, aes(x = start, y = reorder(task, start))) +
  geom_segment(aes(xend = end, yend = task), linewidth = 8, color = "#2C6E8F") +
  scale_x_date(date_labels = "%b %Y") +
  labs(x = NULL, y = NULL, title = "12-Month Mixed Methods Project")
Each change to the days column redraws the chart with correct dates.
Research Proposal Timeline Template Tips
- Build the chart after the budget. The two documents must agree on effort. A task budgeted at 6 person-months cannot sit in a 2-month bar.
- Anchor to the funder's cycle. Work backward from the submission deadline and the requested project period, not forward from today.
- Pilot the riskiest task first. Schedule a pilot before any full rollout so the go or no-go decision arrives while you can still change course.
- Keep color to two or three tones, one per phase. Rainbow charts hide structure.
- Keep the figure to one page. If it does not fit, move detail to an appendix table.
- Version the file. Save v1, v2, and so on with dates, because reviewers and program officers may see different versions.
- Pair the plan with a record. The timeline states what you intend, while a lab notebook template, which many departments and core facilities distribute as a PDF, records what actually happened through dated entries. Comparing the two at each milestone shows where estimates drift, and those observed durations become the evidence base for your next proposal.
- Treat the timeline as one part of a research template set. The aims page, budget justification, data management plan, and timeline all reference the same dates. When one changes, change all of them in the same sitting.
From template to working schedule takes one habit: paste the figure into the proposal, keep the live copy open, and log actual start and end dates as tasks close. The comparison at each milestone is what turns a first proposal's guesses into a resubmission's evidence.
Common Mistakes and Limitations
These are the planning errors that appear most often in first drafts of a research proposal timeline template:
- Scheduling backward from the deadline with no buffer. A chart where every bar abuts the next has zero slack, so any delay breaks the plan. Leave unallocated weeks at phase boundaries and before the final deliverable.
- Hiding overlaps. Two collection streams that run in parallel need two bars that overlap. Drawing them end-to-end misstates both the staffing and the schedule.
- Forgetting the uncontrolled waits. IRB review, animal protocol approval, material transfer agreements, and core facility queues each take time you do not control. Give each its own row, or fold an explicit wait into the preceding bar.
- Charting effort instead of calendar time. A task needing 20 hours of work can still span 6 calendar weeks if it waits on other people. Bars represent calendar time.
- Treating the chart as a contract. Funders expect adjustment. Update the live copy at each milestone and document material changes in your reports, rather than abandoning the schedule the first time reality disagrees.
- Letting the figure drift from the text. If the narrative says 18 months and the chart shows 12, a reviewer catches it. Reconcile the two before every submission.
A note on limits. The template is a planning frame, not a guarantee. Your institution's review boards, your funder's terms, equipment availability, and the scope you set decide the final schedule, and each project needs tailoring to those constraints. Recheck the chart with your mentor, business office, or statistics core before submission, because people who have run the specific assays or recruitments you propose will spot the optimistic rows immediately.
Frequently Asked Questions
What is a research proposal timeline template?
A preformatted structure that maps every task in a proposed study to dates, durations, phases, and owners, usually rendered as a Gantt chart. It serves reviewers as a feasibility test during review and serves you as a live schedule after funding.
How detailed should the task list be?
Ten to 25 rows grouped into phases. Fewer hides real work, more makes the figure unreadable. Move fine detail to an appendix table if a reviewer needs it.
What software should I use to make the Gantt chart?
A spreadsheet. Excel and Google Sheets both produce the chart with a stacked bar or a conditional-formatting grid, and either is enough for most proposals. Mermaid and R suit text-based and reproducible workflows.
How do I show overlapping phases?
Give each stream its own row and set the later task's start date inside the earlier task's span. The bars overlap visibly, which is the honest picture when one stream informs the other.
What counts as a milestone?
A zero-length checkpoint marking a decision or a delivery, such as ethics approval, a pilot go or no-go, database lock, or the final report. Give each milestone its own row and write its criteria in the proposal text.
How much buffer should I leave?
Leave unallocated time at the end of each phase and a block of free weeks before the final deliverable. The right amount depends on how much of the schedule depends on other people, such as review boards and facilities.
Can I use a Gantt chart for a qualitative or review-based project?
Yes. Reviews, interview studies, and design projects all map to phases. Screening volume and interview counts change the row labels and durations, not the method.
What is the difference between a Gantt chart and a simple timeline table?
A table lists tasks and months in text. A Gantt chart draws each task as a bar against a date axis, which makes overlaps, gaps, and crunch points visible at a glance.
Sources
- [[Advances in biodegradable medical magnesium alloys for orthopedic applications].](https://pubmed.ncbi.nlm.nih.gov/42897004/)
- Integration of VectorCam, an AI-Enabled Mosquito Surveillance Tool, Into Uganda's National Malaria Elimination Program: Protocol for a Mixed Methods Hybrid Type III Implementation Study.
- Foot drop secondary to lumbar degenerative disease: a scoping review of recovery patterns, predictors, and research gaps.
- Exploring Provider Perspectives on Gaps in Trauma-Informed Care Delivery Within the Acute Care Surgery Timeline at a Federally Qualified Health Center: Human-Centered Design Study.
- A Proposal for the Use of an Innovative Two-Stage PK-Clinical Adaptive Trial in Biosimilar Product Development.
- Physicians' Perceptions of Information Quality and Access in a New Cross-Institutional Electronic Health Record (EHR) System: Mixed Methods Design.