Why Your Research Project Is Behind Schedule: 7 Common Causes
By Dr. Zubair Khalid, DVM, MS, PhD ·

If your research project is behind schedule, the most likely cause is that the original plan was an estimate rather than a tested schedule. Most people build a plan by listing tasks and assigning optimistic durations, then discover three months in that cell culture takes longer than expected, an antibody shipment is delayed, or a dataset needs two more weeks of cleaning. In health information technology, one review found that projects were typically 100 percent over budget and about a year behind schedule [1]. Research is not immune to the same dynamics, and the same failure patterns show up whether you are running a bench experiment, a clinical registry analysis, or a computational pipeline.
The first thing to check is the gap between planned and actual progress at the task level, not the project level. A vague sense that "things feel slow" will not tell you anything. Open your project plan, pick the three tasks that should be complete right now, and write down what percent of each is actually done. If every task is at 80 to 90 percent, you have the most common pattern in research project management: work that is nearly finished but never finished, because hidden dependencies are blocking the last step.
A Fast Diagnostic Sequence
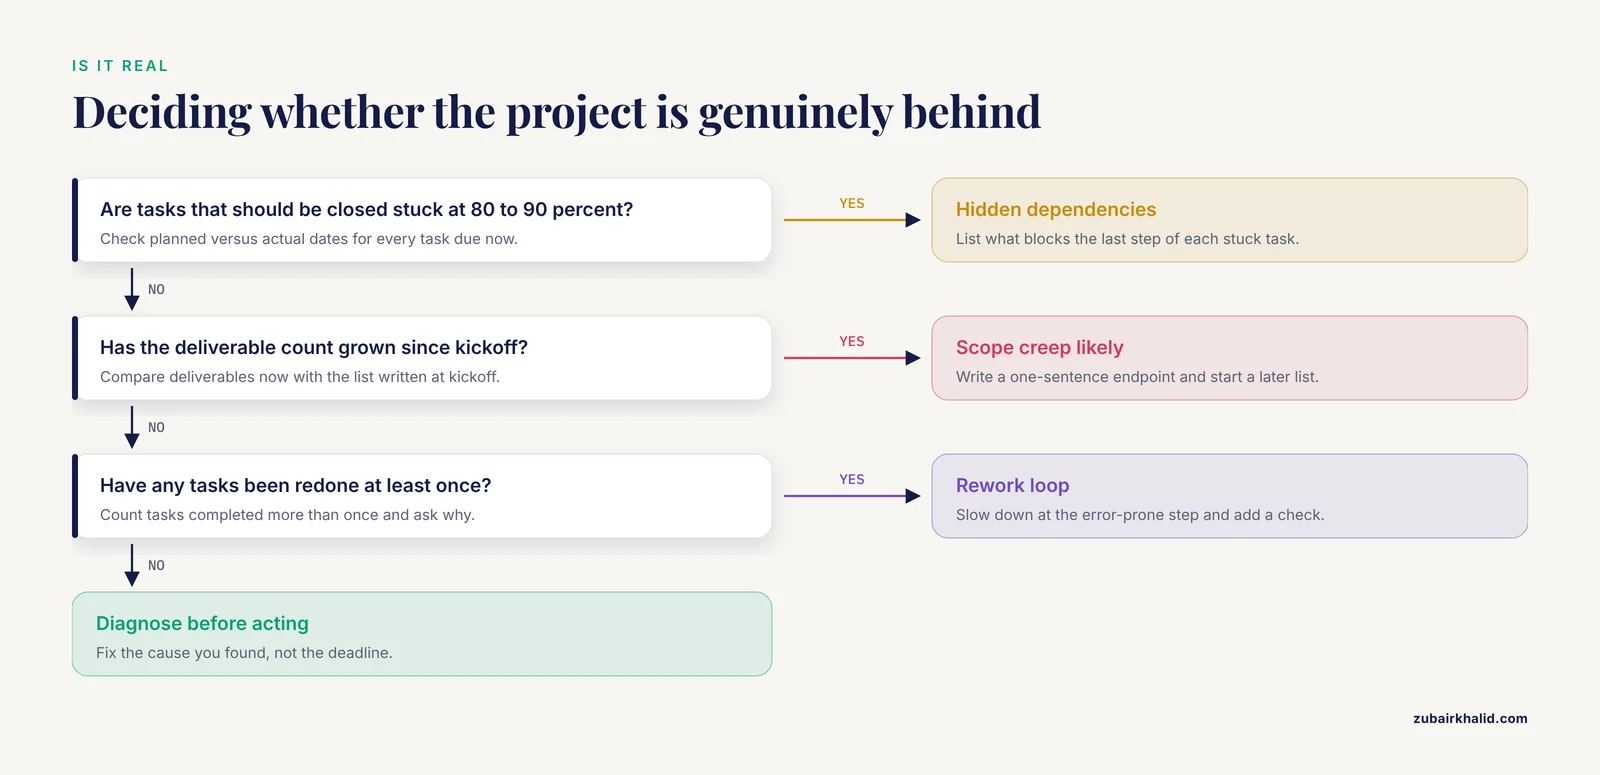
Work through this sequence before changing anything. Each step takes less than an hour and points you toward one of the seven causes described below.
- Compare planned versus actual dates for every task that should be complete. Note which tasks have been "almost done" for more than two weeks.
- Ask each team member what is blocking them right now. Write down the exact blocker, not the general feeling.
- Check whether the total scope of the project has grown since the plan was written. Count deliverables now versus deliverables at kickoff.
- Look at your data. How much time has gone into cleaning, formatting, or waiting for access, relative to actual analysis?
- Count how many tasks have been redone at least once. Rework is the single clearest signal of a schedule in trouble.
- Check whether you have any measurable indicator of progress that you review weekly. If the answer is no, you cannot detect the next delay until it happens.
- Check whether every person and collaborating group knows who owns each deliverable and by when.
Troubleshooting Table: Symptom, Likely Cause, Confirmation, and Fix
| Symptom | Likely cause | How to confirm | Fix |
|---|---|---|---|
| Every task is 80 to 90 percent done but nothing closes out | Optimistic planning, missing buffer | Compare planned vs. actual dates, list hidden dependencies | Re-baseline the schedule with 30 to 50 percent buffers on uncertain tasks |
| New analyses, subgroups, or co-author requests keep appearing | Scope creep | Count deliverables now vs. kickoff | Freeze scope, log new requests to a "later" list |
| Weeks spent reformatting, cleaning, or waiting for data | Data quality and access problems | Track hours spent on data preparation | Define quality indicators before analysis, agree on data standards early |
| Manual steps dominate, such as image annotation or transcription | Labor-intensive workflow | Time one full cycle of the manual step | Automate or semi-automate the bottleneck step |
| The same task is redone two or three times | Rework from rushing or unclear specs | Count tasks completed more than once | Slow down the error-prone step, add a check before proceeding |
| The delay was invisible until a deadline forced a crisis | No progress indicators | Ask whether any weekly metric exists | Define two or three indicators and review weekly |
| Collaborating groups miss handoffs repeatedly | Coordination failure | Check who owns each deliverable | Name one owner per deliverable with a date |
Cause 1: Optimistic Planning With No Buffer
Planning fallacy is the most common reason a research project is behind schedule. When you estimate how long an experiment will take, you imagine the version where nothing goes wrong. Real research is full of contamination, instrument downtime, failed validations, and ethics or procurement delays. The result is a schedule where every task has a single best-case duration and the project has zero slack.
The mechanism is straightforward. Each small overrun is absorbed silently because there is no buffer, so the delay only becomes visible near the deadline when it can no longer be absorbed. By then, recovery options are limited to cutting scope or cutting quality, and both damage the project.
To confirm this cause, look at your original plan and ask two questions. Did any task get a duration longer than best case? Was there any planned slack between the last experimental milestone and the writing deadline? If both answers are no, the plan was built to fail.
The fix is to re-baseline the schedule. Take every remaining uncertain task and multiply its current estimate by a factor that reflects its history. A task you have done twenty times needs a small buffer. A task you are attempting for the first time needs a large one. Then re-plan the end date from these buffered durations and communicate the new date once, clearly, rather than reporting optimistic dates repeatedly. Software teams responded to exactly this problem by adopting iterative methods with short cycles and frequent reassessment, and a scoping review of agile methods in health care settings found strong interest in such approaches precisely because conventional plans were routinely exceeded [1]. A parallel review concluded that research should look into management methodologies and identify where in the project lifecycle change is needed [1]. You can borrow the core idea without adopting a formal framework: plan in short cycles, re-estimate at the end of each cycle, and treat the schedule as a living document.
Cause 2: Scope Creep and Undefined Endpoints
The second most common cause is scope that grows after the plan is fixed. In research this rarely announces itself as a formal change request. It arrives as a reviewer suggesting an additional subgroup analysis, a supervisor asking for one more cohort, a collaborator wanting their dataset included, or your own realization mid-analysis that a secondary outcome would strengthen the paper. Each request looks small. Together they can double the work without anyone consciously deciding to expand the project.
The mechanism is that research questions are inherently open, so without a written endpoint the project has no natural stopping point. A project that "keeps going until the story is complete" will always find one more thing to do.
To confirm this cause, count your deliverables. Write down what the project promised at kickoff, in one sentence, then list everything currently in progress. If the second list is more than about 1.5 times the length of the first, scope creep is real.
The fix has three parts. First, write a one-sentence primary endpoint for the project and post it where the team can see it. Second, create a "later list" for every new idea, and commit to reviewing it only after the primary endpoint is met. Third, for collaborative studies, agree on the analysis plan before data collection matures. Large monitoring collaborations handle this deliberately. The Lancet Countdown, an international multidisciplinary collaboration of academic institutions and practitioners, defined its indicator domains and thematic working groups up front so that each annual report covers the same agreed structure rather than expanding without limit [2]. That early definition of scope is what allows a huge collaboration to produce comparable outputs year after year.
Cause 3: Data Quality and Access Problems
In modern life science research, data is the most common hidden dependency. Weeks disappear into requesting datasets, negotiating data use agreements, cleaning inconsistent entries, reconciling variables across sources, and discovering that a key field is missing for a subset of participants. A study can be technically "on schedule" through its design phase and still be unanalyzable at the analysis phase because the data was never fit for the planned questions.
The mechanism is that data problems are discovered late by design. You cannot know the data is incomplete until you start using it, and by then the schedule assumed analysis was already underway.
The fix is to treat data quality as a measurable property of the project, not an assumption. The CLARION study, which combined data from multiple sclerosis registries across 14 countries covering 5,069 patients, agreed on 28 data quality indicators with participating registries in advance [3]. These indicators assessed consistency, accuracy, completeness, and study representativeness, and each indicator was tied to a remedial measure if quality was not met [3]. That structure converts a vague worry about data into a checklist with owners.
You can apply a lightweight version to almost any project. Before analysis starts, define what a usable dataset means for your study. Specify the variables you require, the completeness threshold for each, the format, and who resolves discrepancies. Check these properties as soon as any data arrives, not when analysis begins. If you are using secondary or registry data, verify access and variable definitions during project planning, not after.
Cause 4: Manual Work That Should Be Automated or Delegated
Some delays are not caused by poor planning at all. They are caused by a workflow in which a single labor-intensive step throttles everything downstream. Common examples in life science research include manual image annotation, manual cell counting, manual data entry from paper forms, and hand-transcribed spreadsheets that later need reconciliation.
The mechanism is arithmetic. If annotating one microscopy field takes ten minutes and your study needs thousands of fields, the manual step alone consumes hundreds of hours, and no amount of schedule discipline fixes it.
To confirm this cause, time one full cycle of the suspected bottleneck. Multiply that time by the total number of cycles the project requires. If the product exceeds your available person-hours, the bottleneck is confirmed.
The fix is to reduce the labor per cycle, using automation, semi-automation, or smarter sampling. Progress here can be substantial. In biomedical imaging, fully supervised convolutional neural network approaches require large volumes of professionally annotated data, which is time-consuming to produce [4]. A weakly supervised method that trains on incomplete initial labels, then iteratively refines them by combining detection and tracking results, achieved cell detection accuracy of 0.862 and 0.924 on two fields of an induced pluripotent stem cell dataset [4]. The lesson generalizes beyond machine learning. If a manual step dominates your timeline, look for a way to make it partially automated, partially sampled, or partially delegated, and re-plan around the reduced cost.
Safety note: when a wet-lab task becomes a bottleneck, resist the temptation to compress handling steps for biological samples or hazardous reagents. Rushed preparation increases both error rates and exposure risk. Shorten timelines by removing unnecessary cycles or automating documentation, never by skipping validated safety steps such as personal protective equipment, biosafety cabinet use, or chemical fume hood requirements.
Cause 5: Rework Loops Driven by Schedule Pressure
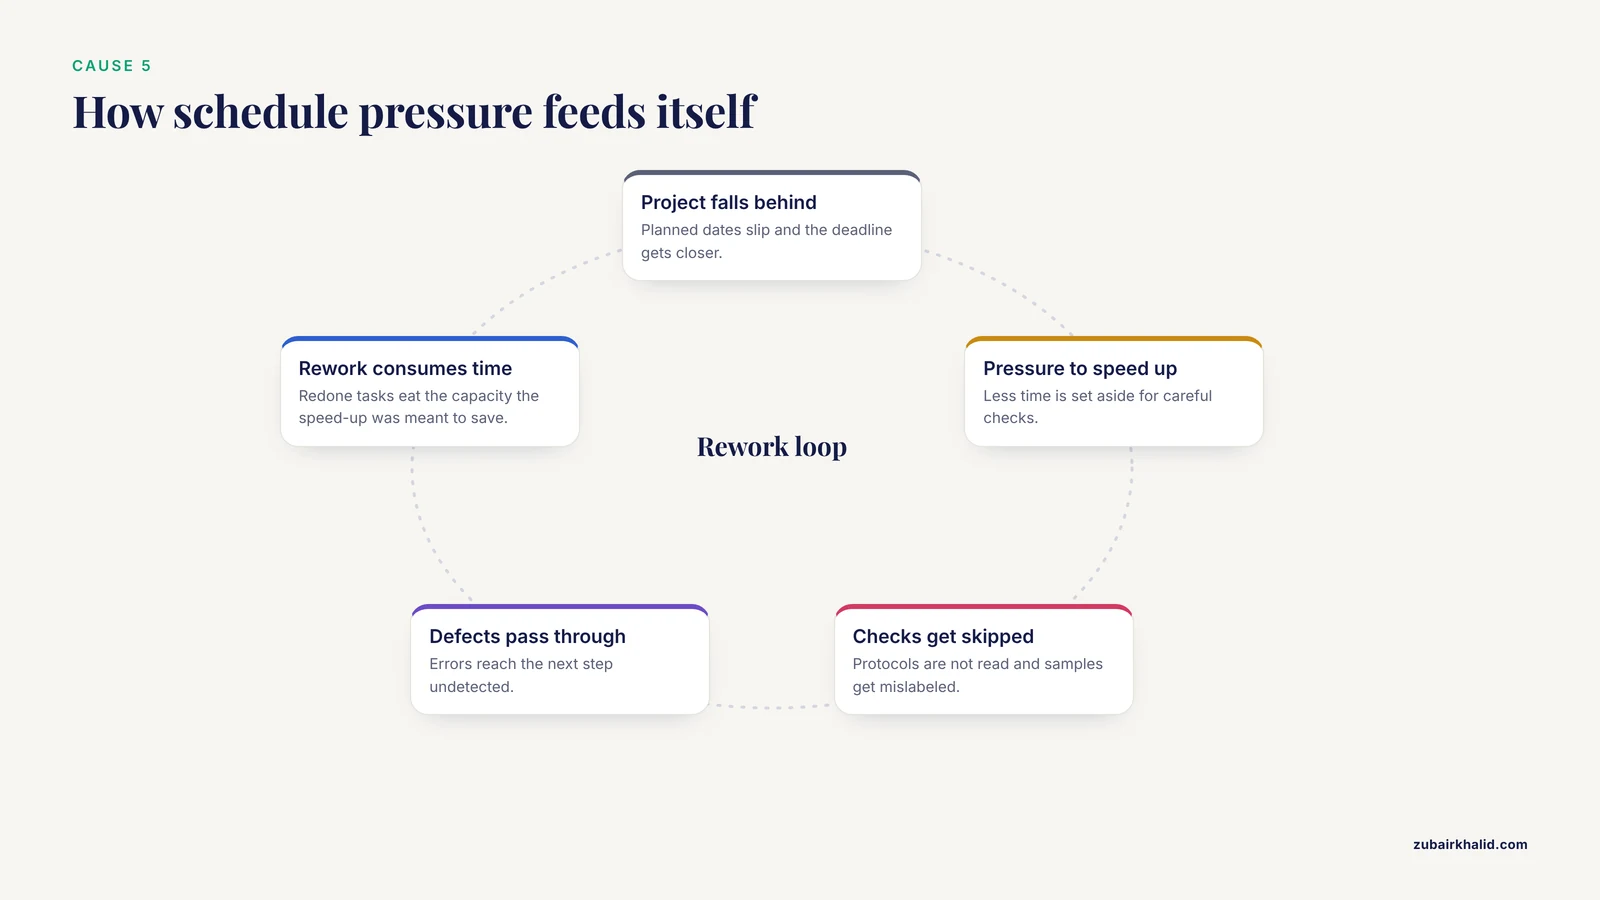
When a project falls behind, the instinctive response is to speed up. Paradoxically, speeding up often makes the project later, because speed produces errors, errors produce rework, and rework consumes the time the acceleration was supposed to save. System dynamics research on construction projects, which are frequently behind schedule and under deadline pressure, modeled exactly this feedback loop and showed how production pressure interacts with variables such as labor hours, planned versus actual progress, and rework [5]. The simulation demonstrated that pressure degrades quality, degraded quality generates rework, and rework consumes capacity, deepening the delay [5].
The mechanism is a reinforcing loop. Falling behind creates pressure, pressure reduces the time available for careful checks, poor checks let defects through, defects require rework, and rework makes the project fall further behind.
To confirm this cause, count how many tasks in your project have been redone. Ask why each was redone. If the answers cluster around "we did not check the protocol first" or "the sample was mislabeled," you are inside the loop.
The fix is counterintuitive: slow down at the highest-error steps. Add a short verification ritual before the expensive steps, such as a fifteen-minute peer check of the analysis script before the full run, or a second person confirming sample labels before processing. A quality improvement project in a newly established pediatric cardiac operating room used root cause analysis with fishbone diagrams and the 5 Whys technique to identify gaps before intervening, then tracked its key performance indicators on weekly spreadsheets with control charts [6]. On-time first case starts improved from 50 percent to 91 percent, mean turnover time fell from 34 to 27 minutes, and the case cancellation rate dropped from 30 percent to 7 percent [6]. The transferable principle is that targeted analysis of failure points, followed by small process changes, outperforms generic exhortations to work faster.
Cause 6: No Measurement, No Early Warning
Many delayed projects were not behind schedule in any visible way until they were badly behind, because nobody tracked a progress indicator. Without measurement, the first reliable signal of delay is the deadline itself. This is the cause that turns manageable delays into crises.
The mechanism is absence of feedback. A project plan created at kickoff describes intentions, not reality. Reality only becomes visible through indicators reviewed on a regular cycle.
To confirm this cause, answer one question. What number, reviewed weekly, would have told you two months ago that the project was slipping? If no such number exists, this is your cause.
The fix is to define two or three indicators tied to your critical path and review them on a fixed weekly cycle. Public health programs do this at scale. The National Tuberculosis Indicators Project is a web-based monitoring system that uses routinely collected surveillance data on individual tuberculosis cases to measure program performance, help programs prioritize improvement efforts, and track progress toward national objectives, with data reported yearly and updated frequently [7]. Its multi-year results showed mixed performance, with improvement in case management indicators but persistent shortfalls in contact investigation indicators, which allowed programs to focus improvement exactly where performance lagged [7]. Your project needs the same structure at miniature scale. Good candidate indicators include number of samples processed per week, percent of planned milestones completed on time, and hours logged on the critical-path task.
Once you are measuring, use a structured improvement cycle to act on what you see. The Plan-Do-Study-Act cycle, in which each indicator gets a baseline, a targeted intervention, and an outcome analysis, proved effective in the pediatric cardiac operating room project described above [6]. The same weekly rhythm works for research projects.
Cause 7: Coordination Failure Across Teams and Institutions
The rarest but most damaging cause is coordination failure, common in multi-institution collaborations, core facility work, and projects that depend on external providers. Each group performs well in isolation, yet the project stalls at handoffs. Sequencing samples goes to a facility with a four-week queue nobody accounted for. A collaborator's data arrives in a different format. A co-author review sits unanswered for six weeks because ownership of the next step was never assigned.
The mechanism is that distributed projects have distributed accountability. When everyone owns a deliverable, no one owns it.
To confirm this cause, build a handoff map. List every point where work passes from one person, group, or institution to another. For each, write the owner, the expected date, and the actual status. Handoffs with missing owners or missing dates are your failure points.
The fix is single-owner accountability plus process redesign. The Auburn Elective Surgery Pilot Project attacked a waiting-list problem by redesigning the process itself. It introduced a new booking and waiting list system administered by a dedicated nurse coordinator who generated the surgery lists, restructured the operating sessions, and planned post-discharge care at the time of operation [8]. During the project period, the number of selected procedures performed doubled, 57 percent of patients were discharged on the day of surgery, and operating costs fell by 25 percent [8]. The transferable element is the dedicated coordinator. In research projects, assigning one person to own the timeline, chase handoffs, and maintain the shared schedule often resolves coordination failure faster than any tool.
Large collaborations manage coordination through defined structures rather than goodwill. The Lancet Countdown organizes its work into five thematic working groups with defined indicator responsibilities and engages stakeholders through defined channels [2]. The principle scales down: every workstream needs a name attached to it.
Common Mistakes and Limitations
Avoid these errors when diagnosing and fixing a delayed project.
- Mistaking effort for progress. Long hours on data cleaning feel like progress but often signal a data quality problem that should have been caught earlier.
- Re-planning without re-baselining. If you repeatedly shift deadlines without changing task durations or adding buffers, the new plan is as unrealistic as the old one.
- Adding people to a late project. New team members need onboarding, which consumes time from the people already doing the work.
- Fixing the symptom, not the loop. If rework is the problem, working overtime does not help. Identifying where errors originate does.
- Treating the first failure as the whole story. A single late reagent shipment is bad luck. A pattern of late inputs is a planning or coordination problem.
- Skipping the data readiness check. Waiting until analysis starts to examine data quality guarantees a late discovery of problems.
- Cutting quality control under pressure. Rushing through verification steps creates the rework loops described in Cause 5.
One limitation deserves honest statement. Schedule problems in individual projects are shaped by local factors, including institutional policies, funder requirements, equipment availability, and team composition, that no general guide can fully anticipate. Use this article as a diagnostic framework and adapt the fixes to your own setting.
Prevention: Building a Schedule That Survives Contact With Reality
Prevention starts with how you write the plan. A useful research project plan template has six sections.
- Objective and endpoint. One sentence defining what "done" means, agreed before work starts.
- Deliverable list. Every concrete output, each with a single named owner and a due date.
- Task breakdown with buffers. Each task with its duration and a stated buffer. Mark tasks as routine, uncertain, or first-attempt.
- Dependency and handoff map. Every input you need from outside your immediate control, with the source, the request date, and the expected delivery date.
- Data readiness checklist. Required variables, completeness thresholds, format standards, and who resolves discrepancies, modeled on the indicator approach used in multi-registry studies [3].
- Weekly indicator review. Two or three metrics, a fixed review day, and a rule for what triggers action.
Iterative development keeps the plan honest. Curriculum developers at the Competence Center for General Practice in Baden-Wuerttemberg used the Kern cycle, an iterative planning method, within an open modified nominal group consensus process to build a seminar curriculum under explicit time and financial constraints, arriving at 62 basic modules across the training program [9]. The relevant lesson is the iteration itself. They did not attempt to define the entire structure perfectly in one pass. They planned, implemented, evaluated, and revised.
Reuse what exists before building anything new. When the Healthy Urban Design Index was developed for European cities, the team built a 13-indicator index across 917 cities using open-source spatial data on a fine 250 meter grid, extending coverage to small and medium-sized cities where most of the population lives [10]. Open data and existing frameworks let the project produce high-resolution output without primary data collection at every step. In the same way, before you plan months of new data collection, check whether validated public datasets, existing protocols, or published pipelines can remove entire work packages from your critical path.
Finally, protect the schedule from the pressure loops described in Cause 5 by institutionalizing the checks. The operating room improvement project succeeded partly because leadership maintained accountability, weekly performance was tracked visibly, and feedback sessions kept the team aligned [6]. A research project needs the same infrastructure at smaller scale. A fifteen-minute weekly meeting with a shared dashboard prevents the slow, invisible drift that turns a two-week delay into a semester-long one.
Frequently Asked Questions
What is the single most common reason a research project is behind schedule?
Optimistic planning with no buffer. Task durations are set to best-case outcomes, small overruns accumulate invisibly, and the delay only surfaces near the deadline when recovery options are limited.
How do I know whether my project is genuinely behind or just uncomfortable?
Compare planned versus actual completion dates at the task level. If tasks that should be closed are sitting at 80 to 90 percent complete for more than two weeks, you are behind and hidden dependencies are the reason.
How much buffer should I add to my research project schedule?
Base the buffer on your history with the task. Routine tasks need a small buffer, first-attempt tasks need a large one. Re-estimate at the end of each work cycle rather than trusting the original estimate for the whole project.
Can agile methods help a research project that is behind schedule?
The underlying principles can. Short work cycles, frequent reassessment, and early delivery of usable outputs counteract the optimistic planning that drives large overruns. Reviews of agile methods in health care settings found growing interest precisely because conventional schedules were routinely exceeded [1].
What should I do first when I discover my project is months behind?
Stop and diagnose before acting. Run the seven-step diagnostic sequence, identify which of the seven causes applies, and fix that cause. Reacting with overtime or deadline shifts alone usually deepens the problem through rework.
How can I stop my supervisor or collaborators from expanding the project scope?
Write a one-sentence primary endpoint and keep a visible "later list." Every new request goes on the list with a note that it will be considered after the primary endpoint is met. This converts ad hoc expansion into a deliberate decision.
Are there tools that reduce the manual labor slowing my project down?
Yes, depending on the bottleneck. For imaging studies, weakly supervised methods that learn from incomplete initial annotations have achieved strong cell detection accuracy while reducing annotation effort [4]. For general projects, any tool that reduces manual entry, reconciliation, or transcription removes hours from the critical path.
How often should I review my research project schedule?
Weekly. Pick two or three progress indicators tied to your critical path, review them on a fixed day, and act when an indicator slips. Indicator-based monitoring with regular updates is standard practice in large public health programs and works equally well at lab scale [7].
Sources
- Use of Agile Project Methodology in Health Care IT Implementations: A Scoping Review.
- The Lancet Countdown: tracking progress on health and climate change.
- Harmonized Data Quality Indicators Maintain Data Quality in Long-Term Safety Studies Using Multiple Sclerosis Registries/Data Sources: Experience from the CLARION Study.
- A Weakly Supervised Learning Method for Cell Detection and Tracking Using Incomplete Initial Annotations.
- Modeling the effects of production pressure on safety performance in construction projects using system dynamics.
- A Plan-Do-Study-Act Cycle to Enhance Operational Efficiency in a Newly Established Paediatric Cardiac Operating Room.
- Monitoring tuberculosis programs - National Tuberculosis Indicator Project, United States, 2002-2008.
- The Auburn Elective Surgery Pilot Project.
- Developing a seminar curriculum for the Competence Center for General Practice in Baden-Wuerttemberg - a progress report.
- Building a Healthy Urban Design Index (HUDI): how to promote health and sustainability in European cities.