Python vs R for Scientific Figure Generation: A Practical Guide
By Dr. Zubair Khalid, DVM, MS, PhD ·
The core difference between Python and R for scientific figures is that Python is a general-purpose programming language with plotting libraries bolted on, while R is a statistical language where plotting is built into the language's core design. The rule of thumb is simple. If your figure is the last step of a machine learning or image-processing pipeline, use Python. If your figure is the last step of a statistical analysis, use R.
Both languages produce publication-quality figures. Reviewers do not care which language drew your volcano plot. They care whether the plot is accurate, readable, and honest about the data. The real question is which workflow gets you from raw data to a finished figure with the least friction in your specific project.
This guide walks through both ecosystems, compares them on the criteria that actually decide the choice, and works through concrete scenarios so you can pick a tool with confidence rather than by following the loudest opinion in your lab.
The Two Ecosystems in Brief
You are never choosing "Python" or "R" as monoliths. You are choosing between ecosystems of plotting libraries, each with a different philosophy.
The Python plotting stack
Python's dominant plotting library is matplotlib, a low-level library that gives you control over every element of a figure but expects you to specify most things yourself. Seaborn sits on top of matplotlib and provides higher-level statistical plots with better defaults. Plotly handles interactive graphics that can live in a web browser. Pandas, the standard library for tabular data in Python, carries its own plotting interface so that a DataFrame can produce a chart directly.
The friction point is that common scientific plot types are not always one command away. Developers of pyOpenMS-viz, a mass spectrometry visualization framework built on pandas, note that generating commonly used mass spectrometry plots in Python has historically been cumbersome, which is precisely why they built a unified layer that produces figures in a single line of code [1]. Similarly, the authors of plot-misc, a Python package for biomedical visualization, observe that matplotlib and seaborn omit visualization archetypes that are routine in biomedical research, and that building such plots from matplotlib's low-level interface produces verbose, brittle code that demands considerable programming experience [2].
The R plotting stack
R was designed by statisticians for statistics, and plotting is treated as a first-class part of data analysis rather than an add-on. The workhorse is ggplot2, built on the "grammar of graphics," a formal system where you build a plot by declaring its data, its aesthetic mappings, and its layers. Base R graphics remain useful for quick exploratory plots. R Shiny turns R code into interactive web applications without requiring a separate web framework.
The pattern in the literature is consistent. PopGenHelpR, an R package for population genomics, generates near-publication-quality figures for genetic diversity and differentiation as a natural byproduct of the analysis itself [3]. xOmicsShiny, an R Shiny application for cross-omics analysis, produces both interactive plots and publication-ready figures for tasks like PCA, volcano plots, and heatmaps [4]. BiomiX, a multi-omics analysis tool, leans on established R packages such as DESeq2 and Limma for transcriptomics and generates report figures as part of the same workflow [5]. In R, the analysis and the figure tend to live in one continuous script.
Side-by-Side Comparison
| Criterion | Python | R |
|---|---|---|
| Core philosophy | General-purpose language, plotting via libraries | Statistical language, plotting built in |
| Flagship plotting library | matplotlib (low level), seaborn (statistical layer) | ggplot2 (grammar of graphics) |
| Statistical analysis | Solid via SciPy, statsmodels, scikit-learn | Best in class, most new statistical methods appear in R first |
| Machine learning pipelines | Strong default choice (scikit-learn, PyTorch) | Capable but not the ecosystem center of gravity |
| Biomedical plot archetypes | Need add-on packages such as plot-misc for forest, survival, and volcano plots [2] | Archetypes often ship inside domain packages with the analysis [3] |
| Interactivity | Plotly, Bokeh, Dash, Streamlit | Shiny, plotly through R bindings |
| GUI options for non-coders | Packages such as GENOVIS offer command-line and graphical interfaces [6] | Many R Shiny web apps expose point-and-click analysis [4] |
| Tabular data handling | pandas DataFrames, now with dedicated plotting layers [1] | Native data frames, tidyverse tooling |
| Typical user profile | Engineers, computational biologists, image analysts, students in programming-focused courses [7] | Statisticians, epidemiologists, population geneticists, wet-lab biologists using packaged pipelines |
| Web deployment for figure sharing | Requires a web framework or hosting setup | Shiny apps deploy with modest extra work [4] |
Python for Scientific Figure Generation
Python's case rests on three pillars: pipeline integration, tabular data tooling, and breadth.
The first pillar is that Python often already contains your analysis. If you are training a classifier, aligning images, or parsing terabyte-scale sequencing output, the code that produces your results is Python. Plotting in matplotlib or seaborn keeps the whole workflow in one language, one environment, and one version-controlled repository. GENOVIS, a Python package for population genetic visualizations such as SNP density heatmaps, 3D PCA, admixture barplots, and Manhattan plots, was created in part because many existing tools rely on language-specific scripting in either R or Python and produce non-interactive outputs that are hard to integrate into existing pipelines [6]. Its authors released it with both a command-line and a graphical interface so researchers without deep bioinformatics backgrounds could still generate the six key population genomics visualizations it covers [6].
The second pillar is the pandas DataFrame. Because so much scientific data already lives in pandas, plotting libraries that extend pandas directly inherit a consistent data interface. pyOpenMS-viz demonstrates the payoff, extending pandas DataFrame plotting so that standard mass spectrometry figures, including spectrum and peptide-intensity plots used for quality control and benchmarking, come out in a single line of code and integrate cleanly with other Python-based proteomics tools [1].
The third pillar is teaching and onboarding. Python is frequently the first programming language students encounter, and introductory science courses now use it for modeling, quantitative analysis, and data visualization, with students producing publication-quality figures within a short course format [7]. If your lab recruits rotating students or collaborators who already know some Python, staying in Python lowers the training cost.
The tradeoff is that Python's flexibility puts more design decisions on you. Without a curated package, you may spend time writing custom wrapper code around matplotlib to get the look that a domain-specific R package gives you out of the box. Packages such as plot-misc exist to close that gap for common biomedical archetypes, combining fine-grained control with ready-made plot types while deliberately leaving statistical routines to other tools [2].
R for Scientific Figure Generation
R's case rests on three pillars: the grammar of graphics, the analysis-to-figure pipeline, and domain packages that bundle both.
The grammar of graphics is why ggplot2 code reads like a description of the figure rather than a list of drawing instructions. You state the data, map variables to visual properties, and add layers. Changing a color scale or facet layout is a one-line edit that applies everywhere. This design makes iterative refinement fast, and refinement is most of the work in producing a final figure.
The second pillar is statistical provenance. When the statistical test and the figure come from the same script, the connection between the result and its display is explicit. PopGenHelpR illustrates this well, letting users estimate observed heterozygosity, FST, and related measures from SNP data and then immediately plot ancestry bar charts, pie chart maps, and genetic differentiation heatmaps that would otherwise require additional software [3]. The package is deliberately minimally dependent on other R packages, which its authors note reduces the chance of installation breakage [3].
The third pillar is the R Shiny ecosystem, which turns analyses into interactive tools that non-programmers can use. xOmicsShiny lets biologists merge transcriptomics, proteomics, metabolomics, and lipidomics data, run pathway mapping against WikiPathways, Reactome, and KEGG, and generate both interactive plots and publication-ready figures through a browser interface [4]. BiomiX similarly wraps DESeq2, Limma, the ChAMP methylomics package, and MOFA integration behind a user-friendly interface that outputs statistics and report figures together [5].
R also underpins many web tools that you might never realize are R. visPIG, a web application for producing multi-track, multi-scale plots of genetic data, was designed for researchers not versed in packages such as R, Matlab, or Python, and it even lets users download the underlying R code to run sensitive analyses locally [8]. If you have ever used a genomics web tool and downloaded a polished PDF, there is a reasonable chance R generated it.
How the Two Compare on the Criteria That Decide Real Choices
A useful research software comparison comes down to a handful of criteria rather than a feature list. The M.E.D.V.I.S. framework, developed to score the quality of biomedical figures, evaluates plots on complexity, color usage, whitespace, and the number of distinct visualizations, and its authors paired this with a comparative analysis of 26 widely used visualization tools judged on ease of use, customizability, financial cost, and required background knowledge [9]. Those four criteria are a good lens for the Python versus R decision as well.
Ease of use and required background
Point-and-click platforms score highest on ease of use but lowest on flexibility. Command-line scripting scores the opposite. Between the two languages, the honest answer is that the learning curves are comparable for a newcomer, but they curve in different directions. Python feels more like ordinary programming, which helps if you have prior coding experience or plan to write software beyond plots. R feels more like statistical notation, which helps if your mental model comes from a statistics course. The authors of visPIG built their web tool precisely because many researchers prefer to avoid both languages entirely for routine plotting tasks [8], which tells you something about the perceived barrier.
Customizability
Both languages reach the same ceiling. A matplotlib figure and a ggplot2 figure can each be tuned to any journal specification. The difference is the floor and the path. In R, an archetype package often gets you most of the way with defaults designed for that exact plot type. In Python, you may reach the same result through a domain package such as plot-misc [2] or through more manual matplotlib work. Either way, the figure quality ceiling is identical, so customizability should rarely decide the choice on its own.
Reproducibility and shareability
Reproducibility is where scripted languages beat manual drawing regardless of which script you use. The FLASHApp team notes that when existing tools force researchers into additional manual processing to generate publication-ready results, that manual layer threatens reproducibility and consistency of scientific outcomes [10]. Code-generated figures avoid that failure mode because the figure is regenerated exactly from the data every time.
There is a subtler reproducibility point about language choice. A review of Global Burden of Disease secondary-analysis articles found that reporting varied widely across papers on which software versions were used, whether code was available, and whether generative AI use was declared [11]. The lesson transfers directly to your own work. Whichever language you pick, record the version number, fix your random seeds where relevant, and deposit the script alongside the data. A figure that cannot be regenerated is a liability no matter how attractive it looks.
Shareable, interactive outputs
If your deliverable includes interactive exploration, both languages deliver but through different doors. R offers Shiny, and xOmicsShiny shows how a modular Shiny design can serve interactive plots and static publication figures from the same codebase [4]. Python offers Dash, Streamlit, and Plotly. FLASHApp demonstrates the collaborative end state, a platform-independent web application where interactive publication-ready visualizations can be shared through URLs so teams can inspect and validate results together [10].
The no-code middle ground
A growing class of tools makes the Python versus R question moot for many users. ProteoArk, a web-based tool built on the Django framework, takes proteomics search results from common pipelines and generates manuscript-ready figures, including PCA, heatmaps, MA plots, volcano plots, and circular bar plots, with a single click [12]. SPDEv3.0 consolidates more than 130 functions for plant genomics into a graphical platform that includes over 30 customizable visualization functions designed to produce publication-ready figures without coding [13]. PopMLvis offers an interactive environment to visualize genetic similarity using several algorithms and generate figures that slot directly into scientific articles [14]. TaxaScope packages validated bacterial taxonomy tools behind a local graphical interface to avoid command-line friction [15]. When one of these tools covers your exact analysis, using it beats writing your own plot code in either language.
When to Use Python
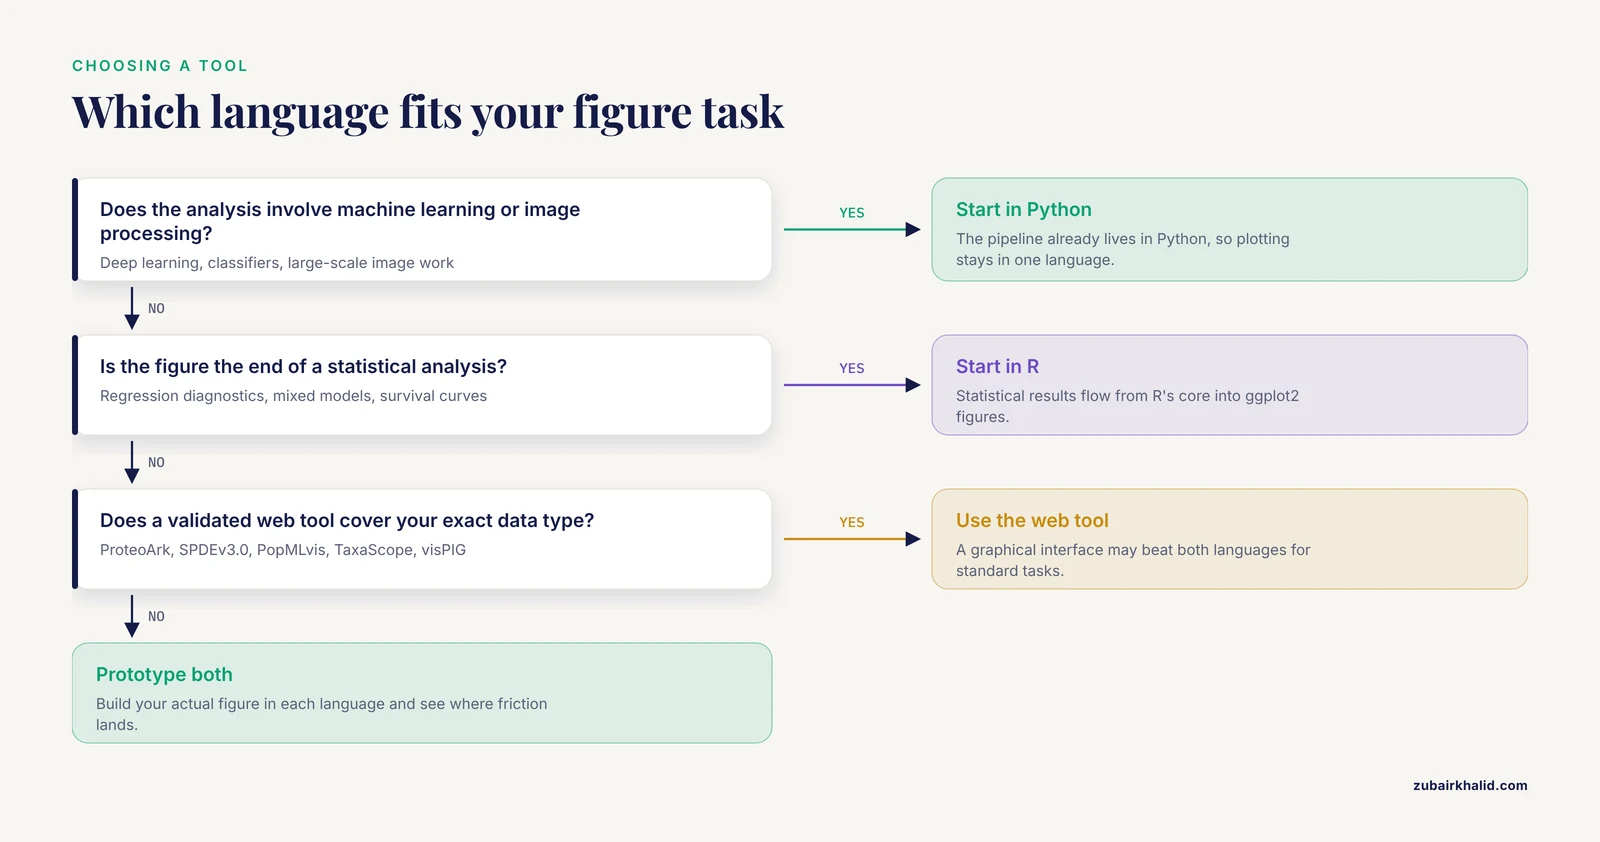
Choose Python when the figure sits at the end of a computational pipeline.
- Your analysis involves machine learning, deep learning, or large-scale image processing. The pipeline already lives in Python, and exporting results to a second language adds a failure point.
- Your data is tabular and lives in pandas. Plotting layers built on DataFrames, such as pyOpenMS-viz, make standard figures nearly free once the data is loaded [1].
- You need custom, non-standard visualizations. Python's low-level access to every graphical element gives you maximum freedom to build unusual plots, at the cost of more code.
- Your group includes students or collaborators with Python experience. Short courses regularly bring students from zero to publication-quality figures in Python, so the local expertise may already exist [7].
- You want both a script and a point-and-click front end for the same tool. GENOVIS shows that a single Python package can serve command-line users and GUI users at once [6].
When to Use R
Choose R when the figure sits at the end of a statistical analysis.
- Your figure must faithfully represent a statistical model. Regression diagnostics, mixed model summaries, and survival curves flow naturally from R's statistical core into ggplot2.
- Your field has a mature R package that bundles analysis and plotting. Population genomics [3], cross-omics pathway analysis [4], and multi-omics integration [5] all have current R tools that generate near-publication-quality figures as part of the workflow.
- You want an interactive app quickly. Shiny remains one of the fastest routes from an R script to a shareable browser tool.
- Your collaborators already speak R. A lab whose existing pipelines run on R packages gains nothing by switching languages for the plotting step.
- You need a web tool but want to inspect or rerun the underlying code locally. Some web applications expose their R code for exactly this purpose [8].
Using Both in One Project
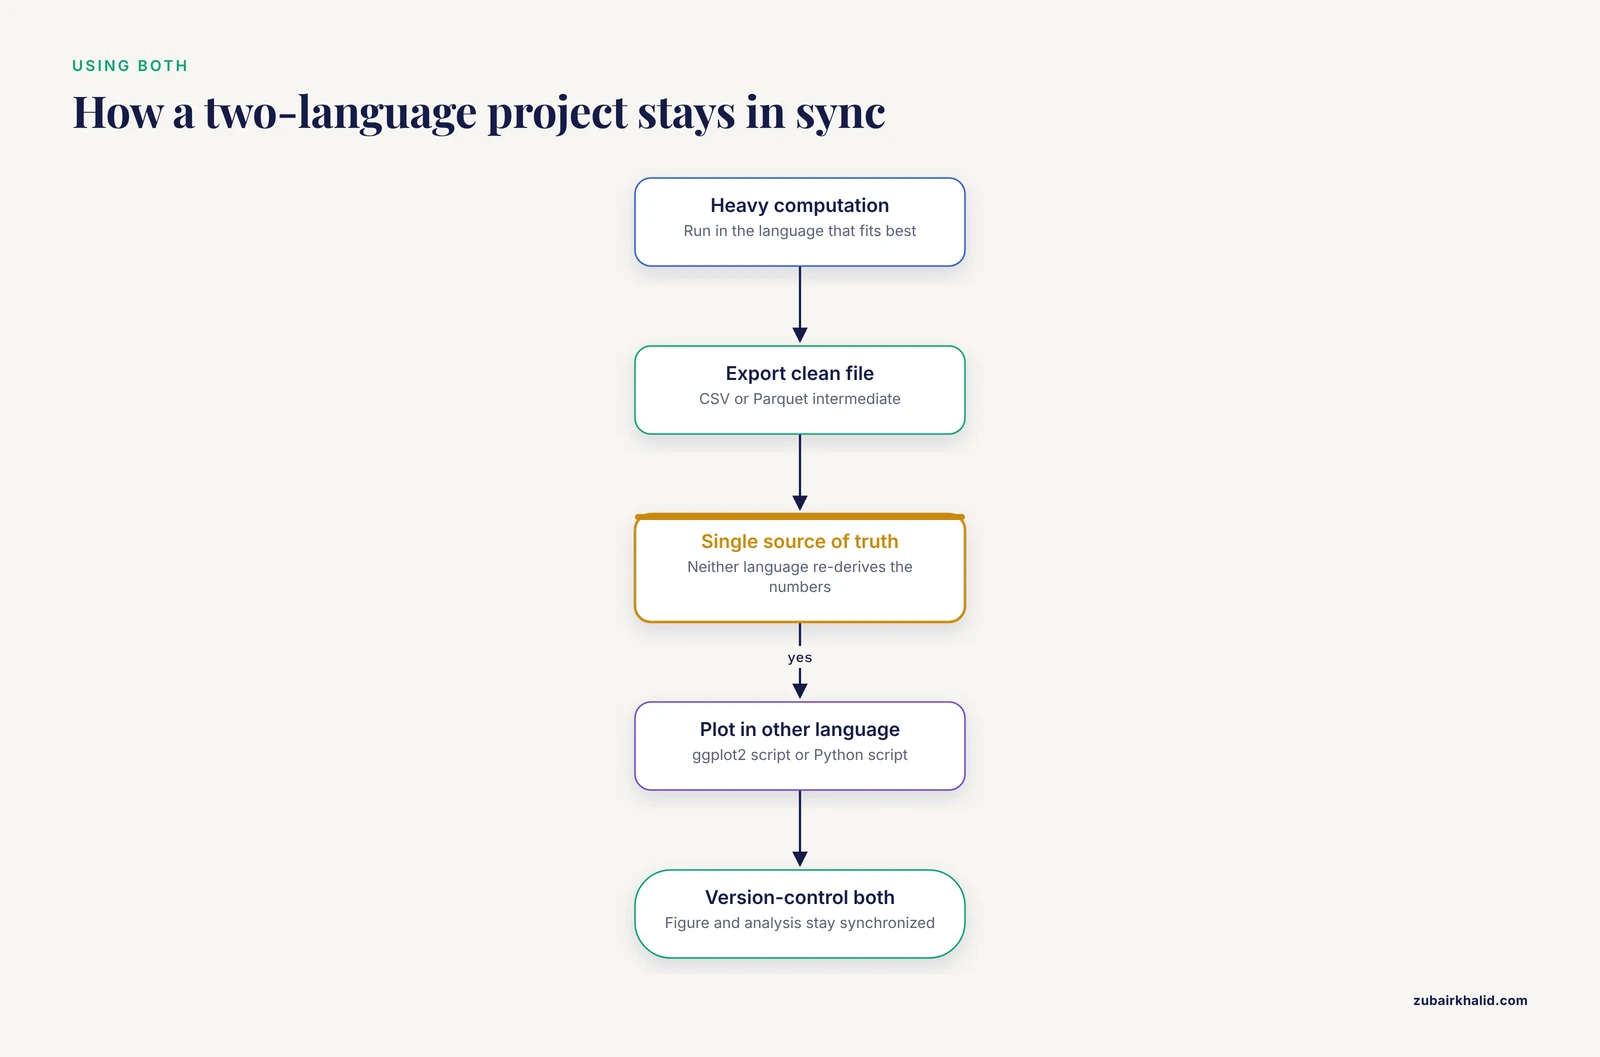
The Python versus R choice is not exclusive. A common and defensible pattern is to run the heavy computation in whichever language fits best and hand a clean intermediate file to the other language for plotting. A CSV or Parquet file written by a Python machine learning pipeline can feed a ggplot2 figure script, and the reverse works too. Multi-tool platforms acknowledge this reality, with BiomiX combining R packages across transcriptomics, methylomics, and metabolomics within a single pipeline [5], and population genetics developers explicitly designing for researchers who face tooling split across R and Python [6].
Two practical rules keep a two-language project healthy. First, make the intermediate data file the single source of truth, so neither language ever re-derives the numbers. Second, version-control both scripts together, so the figure and the analysis that produced it stay synchronized.
Common Mistakes and Limitations
Choosing the language before examining the domain tooling. The best software for researchers in a given field is often a domain package rather than a general plotting library. Before writing custom code, check whether a package for your data type already ships the plot you need, whether that is a mass spectrometry framework [1], a population genomics toolkit [3][6], or a plant genomics platform [13].
Treating defaults as finished figures. Figure quality varies widely across tools and applications, which is why formal evaluation frameworks like M.E.D.V.I.S. exist to score complexity, color usage, whitespace, and visualization count [9]. Default output from any library is a starting point. Colorblind-safe palettes, adequate whitespace, and legible font sizes at final print dimensions all require deliberate choices.
Regenerating figures by hand after every data update. If you export data, redraw the figure manually, and tweak it in a drawing program, you have recreated the reproducibility problem that tool developers specifically warn about [10]. Keep the figure in code or in a one-click pipeline [12] so updates cost nothing.
Omitting software version reporting. Reviews of published secondary analyses show inconsistent reporting of software versions and code availability across large bodies of literature [11]. State the language version and package versions in your methods section.
Assuming the languages are interchangeable for statistics. They are largely interchangeable for plotting, but statistical method availability differs. Cutting-edge statistical methods frequently appear in R packages first. If your analysis depends on a brand-new statistical method, check its implementation language before deciding where the figure gets made.
Overlooking the web-tool option entirely. If your task is standard, a validated web application such as visPIG for multi-track genetic plots [8], ProteoArk for proteomics [12], or PopMLvis for population structure [14] may produce a manuscript-ready figure faster than either scripting language.
Underestimating interactivity as a deliverable. Static PDFs suit journals, but exploratory work often benefits from shareable interactive views. Platforms built for this, whether Shiny-based or web-based with shareable URLs [10], change how collaborators engage with your results.
A final limitation applies to the choice itself. Individual projects vary enough that the scenarios above are starting points, and the only reliable test is to prototype your actual figure in both languages and see where the friction lands.
Frequently Asked Questions
Python or R for scientific figures, which should I learn first?
Learn the language that matches your nearest analysis task. If your work involves machine learning or image processing, start with Python. If your work centers on statistics or you plan to use domain packages built in R, start with R. Both produce publication-quality figures, so the analysis context should drive the choice.
What is the difference between Python and R for scientific figure generation?
Python is a general-purpose language where you add plotting libraries, which gives you flexibility but sometimes requires extra packages for domain-specific plot types. R is a statistical language where plotting is integrated with analysis, and many field-specific packages generate figures alongside their statistical outputs.
Can I make publication-ready figures without any coding?
Yes. Tools such as ProteoArk, SPDEv3.0, PopMLvis, and TaxaScope provide graphical interfaces that generate manuscript-ready or publication-ready figures from uploaded data without writing code. Check whether a platform exists for your exact data type before committing to a scripting language.
Which language makes better-looking figures?
Neither. Both can reach any journal specification, and formal figure-quality frameworks evaluate the output, not the language that produced it. The visual ceiling is identical. Differences lie in how much effort the path requires for a given plot type.
Do journals care whether figures were made in Python or R?
No. Journals evaluate the figure itself and the reproducibility of the underlying analysis. What matters is that you report software versions, provide code where feasible, and produce figures that accurately represent the data.
Can I use Python and R together in the same project?
Yes. A common pattern is to compute in one language, export a clean data file, and plot in the other. Treat the intermediate data file as the single source of truth and version-control both scripts so analysis and figure stay synchronized.
Sources
- pyOpenMS-viz: Streamlining Mass Spectrometry Data Visualization with pandas.
- Effective visualization of biomedical data using plot-misc.
- PopGenHelpR: An R Package to Streamline and Facilitate Informed Population Genomic Analyses and Visualization of Genetic Ancestry, Diversity and Differentiation.
- xOmicsShiny: an R Shiny application for cross-omics data analysis and pathway mapping.
- BiomiX, a user-friendly bioinformatic tool for democratized analysis and integration of multiomics data.
- GENOVIS: a Python package for the visualization of population genetic analyses.
- The Chocolate Curriculum: A Gateway to Materials Science and Engineering and Python Programming.
- visPIG--a web tool for producing multi-region, multi-track, multi-scale plots of genetic data.
- What is a "Good" figure: Scoring of biomedical data visualization.
- FLASHApp: Interactive Data Analysis and Visualization for Top-Down Proteomics.
- Paper mill or paper mine? A tentative answer to the sharp increase in research papers based on the Global Burden of Disease database.
- ProteoArk: A One-Pot Proteomics Data Analysis and Visualization Tool for Biologists.
- SPDEv3.0: A multidisciplinary integrated data analysis platform.
- PopMLvis: a tool for analysis and visualization of population structure using genotype data from genome-wide association studies.
- TaxaScope: a container-native, visualization-centric workstation for genome-based bacterial taxonomy.