How to Pilot Open-Source and Commercial Research Software
By Dr. Zubair Khalid, DVM, MS, PhD ·

By the end of this article you will be able to design and run a small, defensible pilot that compares open-source and commercial research software on your own data, and turn the results into a written recommendation your lab or department can act on. You will need a candidate list of two or three tools, a small fixed dataset, a spreadsheet or script for scoring, and permission from your data owner to use those files for testing. No special hardware is required to follow the walkthrough, although compute-heavy domains such as imaging or high-throughput sequencing benefit from a workstation you can dedicate to the trial.
A pilot research software evaluation plan is a short, structured trial in which two or more candidate tools process the same inputs under the same conditions, and their outputs are judged against success criteria you define in advance. Research teams increasingly need this skill because the software market now spans vendor products, community packages, and hybrid arrangements, and the differences between them are rarely visible from a product page. Published evaluations show why the trial matters. In an untargeted metabolomics study, the commercial Compound Discoverer and the open-source MS-DIAL produced very different numbers of putative compound annotations, 52 versus 115 at the same confidence level, on identical plant metabolomics data [1]. In clinical simulation planning, an open-source surgical planning pipeline achieved a mean Hausdorff distance of 1.22 plus or minus 0.40 and a mean Dice coefficient of 0.77 plus or minus 0.07 when planned reconstructions were compared with postoperative 3D imaging, which the authors judged satisfactory accuracy at zero license cost [2]. Neither result could have been predicted without running the tools.
What a Pilot Research Software Evaluation Plan Covers
A good pilot answers four questions. Does the tool produce correct results on data like yours? Can your team operate it at the pace your projects demand? What does it cost in licenses, labor, and maintenance? And can the workflow be reproduced months later, by someone who did not run the pilot?
The pilot is deliberately small. Published software evaluations often run on a handful of cases rather than a full study. The surgical planning pilot included eight patients [2]. A usability pilot of an adapted mobile health app recruited a small cohort over a defined observation window rather than attempting a full trial [3]. The goal is a decision-grade signal at a fraction of the cost of a full deployment, followed by a staged rollout. The roadmap for automated biomedical research laboratories makes this explicit, listing needs assessment, pilot deployment, workflow standardization with validation, and cost recovery as sequential stages before institutional adoption [4].
Before You Start: What to Have on Hand
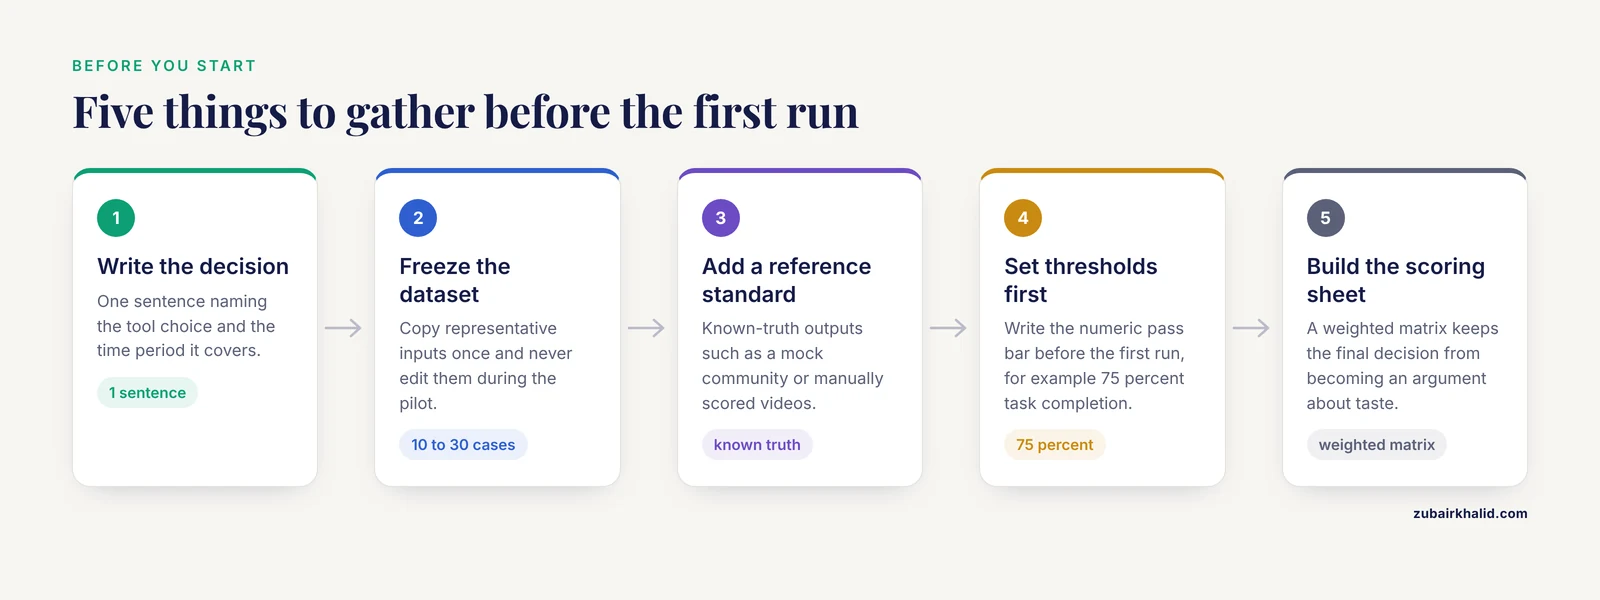
Gather these five items before touching any installer or container image.
- A written statement of the decision. Write one sentence such as "We will choose one primary tool for metabolomics feature detection for the next two years."
- A fixed benchmark dataset. Freeze a copy of representative inputs and never edit it during the pilot.
- A reference standard. This is a dataset or set of outputs with known truth against which you score accuracy. Examples include a mock community with a known composition, a set of manually scored videos, or a decoy-augmented compound library for virtual screening.
- Success thresholds written before the first run. Publish-style pilots do this routinely. One education tool pilot defined success in advance as at least 60 percent of participants rating each domain 4 or higher on a 5-point Likert scale [5]. A survivorship app pilot set a feasibility threshold of a 75 percent task completion rate [6].
- A scoring sheet with weights. A simple weighted matrix, described in Step 7, keeps the final decision from becoming a argument about taste.
Your Pilot Research Software Evaluation Plan, Step by Step
The following seven steps form a complete plan you can adapt to any domain. The worked examples assume a small data-processing comparison, but the same skeleton applies to analysis pipelines, imaging tools, and behavioral coding software.
Step 1. Define the Decision and the Success Thresholds
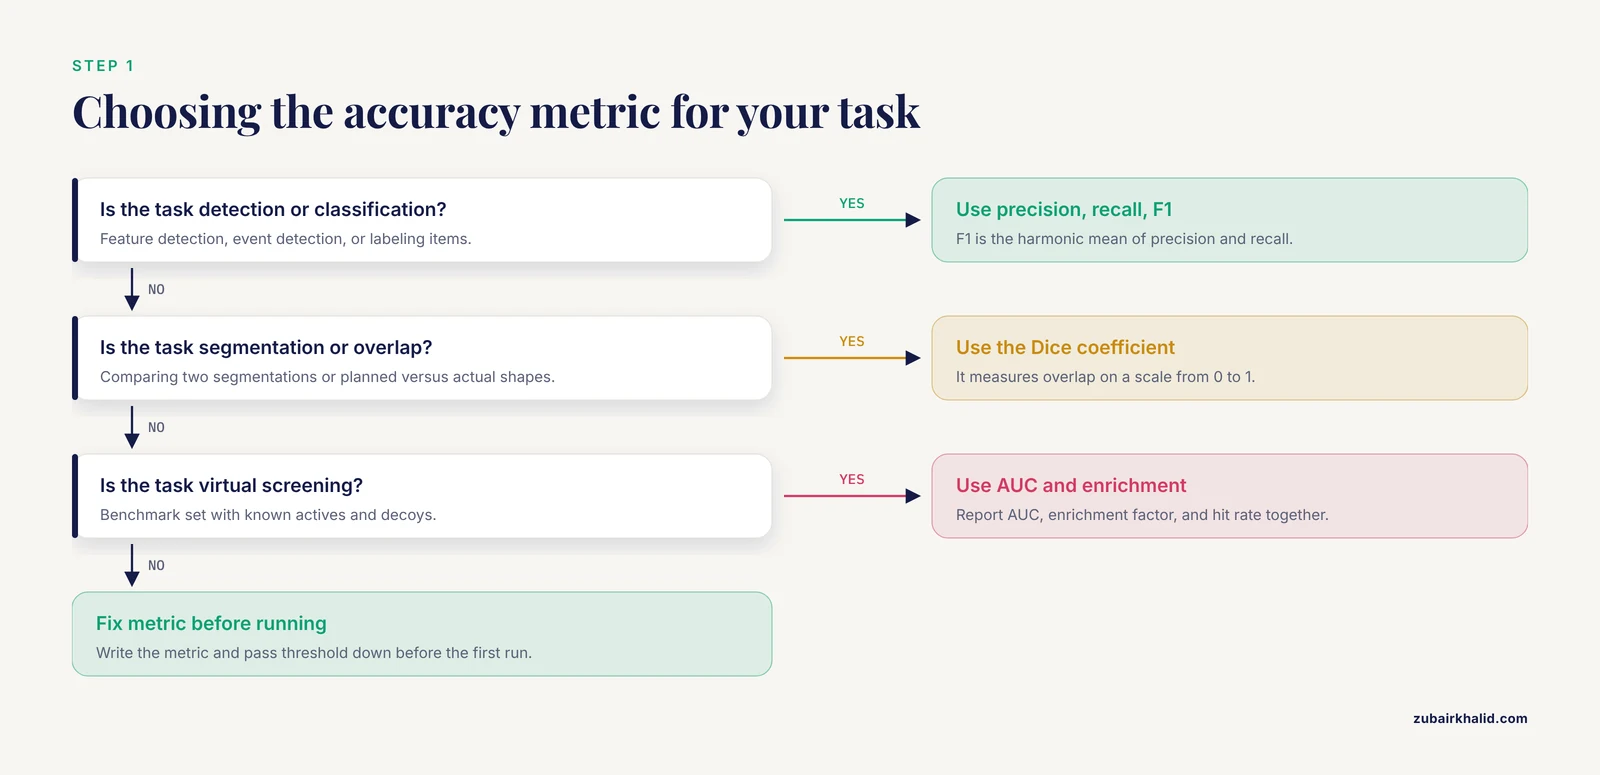
Write down the task, the data types, the users, and the numeric bar each candidate must clear. Vague goals such as "better results" doom the comparison. Pick metrics that match your task type. Classification and detection tasks suit precision, recall, and the F1 score, which is the harmonic mean of precision and recall. Segmentation tasks suit the Dice coefficient, which measures overlap between two segmentations on a scale from 0 to 1. Virtual screening tasks suit the area under the ROC curve, abbreviated AUC, plus enrichment metrics.
The behavioral neuroscience field offers a model of this discipline. A pilot of automated head twitch response quantification trained deep learning models on 13 body parts and then validated them against visually scored videos, reporting precision of 95.45, recall of 95.56, and an F1 of 95.51 at 50 percent video resolution and 120 frames per second, while also reporting performance at reduced resolutions and frame rates [7]. The team chose the metric before running the comparison and reported performance across realistic operating conditions.
Step 2. Assemble a Fixed Benchmark Dataset
Freeze your inputs and record their identity with checksums so any later dispute about "which data did we use" ends immediately. For a small pilot, 10 to 30 representative cases is usually enough to reveal gross differences in accuracy and throughput.
mkdir -p pilot/data pilot/results/candidateA pilot/results/candidateB
cp ~/raw/2026_qc_pool/*.mzML pilot/data/
find pilot/data -type f -name "*.mzML" | wc -l
md5sum pilot/data/*.mzML > pilot/data_manifest.md5
md5sum -c pilot/data_manifest.md5
Expected output:
12
pilot/data/QC_pool_01.mzML: OK
pilot/data/QC_pool_02.mzML: OK
pilot/data/QC_pool_03.mzML: OK
The md5sum command writes a fingerprint of every input file. If any line reports FAILED, a file changed after you froze the dataset, and you must rebuild the manifest before running anything.
If a reference standard exists for your domain, include it here. Microbiome researchers benchmarked a proprietary platform against eight open-source pipelines using a commercially available mock community with a shotgun-sequenced reference profile as the ground truth [8]. A known-truth sample converts a vague comparison into a scored one.
Step 3. Build a Reproducible Environment for Each Candidate
Reproducibility separates a pilot from a demonstration. Record exact versions, because two builds of the same open-source tool can behave differently. A versioned environment record looks like this:
# record_versions.py, run once inside each candidate's environment
import platform
import sys

print(sys.version)
print(platform.platform())
Expected output:
3.11.5 (main, Sep 11 2024, 14:21:23) [GCC 11.4.0]
Linux-5.15.0-91-generic-x86_64-with-glibc2.35
For open-source candidates, prefer a package manager or container so the environment can be rebuilt on another machine. For commercial candidates, record the product version, build number, and any default parameter presets the vendor applies, and save the vendor's project file alongside your results. If a vendor supplies validation documentation or a qualification guide, archive it with the pilot record.
Step 4. Run the Identical Workflow in Every Tool
Every candidate must receive the same inputs, the same amount of human attention, and the same stopping rules. Resist the temptation to tune one tool carefully and run the other on defaults. A fair protocol gives each candidate one tuning session of equal length, then freezes parameters.
Wrap each run in a timing harness so throughput numbers come from the same measurement procedure:
# time_candidate.py
import pathlib
import subprocess
import time

tool = ["your-command-here", "pilot/data", "pilot/results/candidateA"]
start = time.perf_counter()
run = subprocess.run(tool, capture_output=True, text=True)
elapsed = time.perf_counter() - start

print(f"exit code: {run.returncode}")
print(f"wall time: {elapsed:.1f} s")
pathlib.Path("pilot/results/candidateA/stderr.txt").write_text(run.stderr)
Expected output:
exit code: 0
wall time: 613.4 s
Replace your-command-here with the actual command for each candidate, taken from its official documentation. Run each workflow at least twice on the benchmark set. The second run reveals caching effects and flaky failures, and rerunning the checksum on outputs confirms the tool is deterministic. If two runs on identical input give different outputs, record that as a reproducibility finding, because it will matter when you publish.
Step 5. Measure Accuracy Against the Reference Standard
Score every candidate's output against your reference standard using the metric you fixed in Step 1. The metabolomics study cited above illustrates why this step changes decisions. Both tools detected features, but the feature lists were contaminated by unknown metabolites, background signals, and duplicate features, all of which had to be assessed before downstream multivariate analysis could be trusted [1]. Annotation count alone was not the real quality signal. Data quality after filtering was.
Plan for the same rigor in your domain. If you are comparing video coding tools, have a human expert score a subset of videos by hand and treat that as truth, then compute precision and recall for each candidate. If you are comparing virtual screening tools, use a benchmark set with known actives and decoys and report AUC, enrichment factor, and hit rate, the same trio used to validate the open-source LIGSIFT alignment tool across 40 protein targets [9]. If you are comparing segmentation or surgical planning outputs, use overlap measures such as the Dice coefficient and boundary distance measures such as the Hausdorff distance, the pairing used in the surgical pilot described earlier [2].
Step 6. Measure Throughput, Cost, and Support
Accuracy is one axis. Operational reality is another. Record wall time per sample, hands-on time per batch, how many clicks or commands a routine task takes, and how quickly each vendor or community responds when something breaks. Ask the commercial vendor for license terms in writing during the pilot, including what happens when your grant or subscription lapses. For open-source candidates, inspect the issue tracker for response times and record which institutional staff could maintain the tool if the original developers move on.
These operational numbers often decide the outcome. The open-source driver video analysis framework cited earlier detected driver activities, glance patterns, and automation mode with over 96 percent accuracy while cutting manual video analysis time by over 90 percent, which transformed the economics of large naturalistic driving studies [10]. Accuracy and labor savings together made the case, not either factor alone.
Step 7. Score, Decide, and Document
Convert your findings into a weighted decision matrix, discuss it with the people who will use the tool daily, and write a two-page memo recording the decision. A minimal scoring script looks like this:
# score_candidates.py
weights = {
    "accuracy_against_reference": 0.40,
    "throughput": 0.20,
    "usability": 0.15,
    "support_and_docs": 0.15,
    "cost_and_licensing": 0.10,
}
scores = {
    "Candidate A (open-source)": {
        "accuracy_against_reference": 4,
        "throughput": 3,
        "usability": 3,
        "support_and_docs": 3,
        "cost_and_licensing": 5,
    },
    "Candidate B (commercial)": {
        "accuracy_against_reference": 4,
        "throughput": 4,
        "usability": 4,
        "support_and_docs": 4,
        "cost_and_licensing": 2,
    },
}
for name, rows in scores.items():
    total = sum(weights[k] * v for k, v in rows.items())
    print(f"{name}: {total:.2f}")
Expected output:
Candidate A (open-source): 3.60
Candidate B (commercial): 3.80
Each criterion is scored from 1 to 5 by the evaluation team, multiplied by its weight, and summed. The weights encode your priorities, so set them before you see the scores. The memo should attach the data manifest, the frozen parameters, the raw outputs, the scoring sheet, and the signed recommendation. When the pilot is done, the staged adoption path from the automated laboratory roadmap applies: standardize the chosen workflow, validate it under routine conditions, then plan training and cost recovery before scaling to the whole group [4].
The table below summarizes the dimensions every pilot should record.
| Dimension | What to record | Common metric or evidence |
|---|---|---|
| , - | , - | , - |
| Accuracy | Agreement with the reference standard | F1 score, Dice coefficient, AUC |
| Throughput | Wall time and hands-on time per sample | Minutes per sample |
| Robustness | Behavior on reruns and edge cases | Identical output checksums, failure log |
| Usability | Effort for a routine task | Steps to completion, Likert ratings |
| Support | Responsiveness of vendor or community | Hours to first reply on a test question |
| Cost | Licenses, labor, maintenance, training | License terms, analyst hours per batch |
| Reproducibility | Ability to rebuild the run later | Pinned versions, saved project files |
Research Software Comparison: How Open-Source and Commercial Candidates Differ
Open-source and commercial candidates bring different strengths, and published head-to-head studies show the pattern repeating across domains.
Open-source software gives you full visibility and usually zero license cost, but it asks more of your team. The surgical planning pilot succeeded because the authors could chain open-source components and 3D printing in-house and measure the result quantitatively [2]. The DeepLabCut and SimBA behavior quantification work required training pose estimation models and random forest classifiers, skilled labor that replaced a commercial semi-automated alternative [7]. The insulin delivery field offers a striking population-level comparison: in a retrospective analysis of 144 users, people using open-source automated insulin delivery systems spent 81.7 percent of time in the target glucose range versus 73.9 percent for the commercial system, with lower HbA1c values of 6.2 versus 7.0 percent, results attributed to the open-source community's rapid iteration and the users' deep engagement with the technology [11].
Commercial software buys you vendor support, polished interfaces, validation documentation, and often smoother integration with proprietary instruments. In the microbiome benchmark, the proprietary platform produced stable consensus predictions at the phylum level, while single-region open-source pipelines performed better at species-level resolution [8]. That result captures the practical tradeoff well. The proprietary tool bundled a coherent, tested workflow, and the open-source alternatives offered more granular control that paid off only with expert configuration.
Neither category is automatically the best software for researchers. The metabolomics comparison found each tool annotating different compound sets, 52 versus 115 at Level 2 confidence, on the same samples [1]. A hybrid outcome, in which one tool serves routine production and the other serves discovery or cross-checking, is a legitimate pilot conclusion. State it explicitly in your memo if the data support it.
Pilot Research Software Evaluation Plan Tips
These tactics raise the quality of a small pilot more than anything else.
- Test at degraded operating conditions, not just ideal ones. The behavior quantification team deliberately re-scored videos at 12.5 percent resolution and 30 frames per second to find the cheapest acceptable setting [7]. Your pilot should find the lowest resource level that still meets your accuracy threshold.
- Use pre-registered thresholds for subjective measures. When human raters judge usability, write the pass bar first. The AI education pilot that required 60 percent of raters to score 4 or above on each domain could report cleanly that credibility and satisfaction passed while understanding did not [5].
- Track engagement decay, not just first impressions. In the survivorship app pilot, monthly task completion fell over the six-month follow-up, dropping from the low 60 percent range for questionnaires to 37 percent for activity reminders [6]. A two-week demo can hide a tool people abandon by month three.
- Include the maintainers. Sit a prospective daily user in front of each candidate with a real task and watch where they stall. Friction that looks trivial to the evaluator dominates the workday of the technician.
- Benchmark against a purchased reference where one exists. The microbiome study's use of a commercially characterized mock community gave every pipeline, open and proprietary, the same objective yardstick [8].
- Write the pilot memo the same week the runs finish. Details about parameter settings and failure modes evaporate fast, and the memo is what survives staff turnover.
Common Mistakes and Limitations
These are the errors that most often invalidate a pilot research software evaluation plan.
Comparing on different data. If candidate A sees 2019 samples and candidate B sees 2024 samples, you learned nothing. Freeze one dataset and checksum it, as shown in Step 2.
Tuning one candidate and not the other. Equal tuning budgets, frozen in writing before the runs, keep the comparison honest.
Reading annotation counts as accuracy. More features or more annotations is not better output. The metabolomics study showed that raw feature lists carried background signals and duplicates that had to be cleaned before any conclusion [1]. Always apply your quality filters before scoring.
Judging a pilot by a single metric. A tool with the best F1 score can fail on throughput, and a fast tool can fail on reproducibility. Score all fixed dimensions.
Ignoring licensing and export terms until the decision is made. License terms affect whether results can be shared, archived, and rerun by reviewers. Capture them in Step 6, not after the purchase order.
Confusing a pilot with a validation study. A pilot with eight cases [2] or a handful of usability participants [3] can identify gross failures and inform a decision, but it cannot establish performance across your whole sample universe. Say so in the memo, and plan confirmatory runs on a larger batch after adoption.
Letting familiarity decide. Teams gravitate toward the tool they already know. The weighted matrix exists precisely to force every criterion onto the record, including the ones that favor the unfamiliar candidate.
One limitation applies to every pilot, in software as in any other domain: individual datasets can behave atypically, and a result that transfers for most labs may not transfer to yours. The pilot exists to test the candidates on your data precisely because general claims from vendors and papers are starting points, not verdicts.
Frequently Asked Questions
How many software candidates should a pilot include?
Two or three. A single candidate cannot be compared against anything, and four or more candidates multiply tuning and scoring work without adding much decision value. Include one open-source and one commercial candidate as a minimum so the comparison reflects both worlds.
How long should a software pilot run?
Long enough to cover the full workflow at least twice and to include one routine failure, such as a corrupted file or an instrument outage. Days to a few weeks is typical for a tool pilot, and longer observation windows are needed when engagement over time is part of the success criteria.
Do I need to know how to code to evaluate open-source research software?
Not always, but it helps. Many open-source tools now ship graphical interfaces or containerized launchers. You do need someone on the team who can record versions, run a checksum, and execute a command line, since those steps make the pilot reproducible.
What accuracy metric should I use in my pilot?
Match the metric to the task. Use precision, recall, and F1 for detection and classification, the Dice coefficient for segmentation overlap, and AUC with enrichment metrics for virtual screening. Fix the metric and the pass threshold in writing before the first run.
Can I evaluate commercial software without committing to a purchase?
Yes, most vendors offer trial licenses, demo datasets, or evaluation access, and their technical support teams expect pilot questions. Request written license terms during the trial so cost and data rights enter the scoring matrix alongside performance.
How many test users does a usability pilot need?
Small, structured panels are standard. Published pilots have drawn useful decisions from cohorts in the range of 5 to 15 participants when each participant completes defined tasks and predefined rating thresholds are set in advance.
Should the pilot use real project data or public test data?
Both, if you can. Public test data with known truth lets you score accuracy objectively, while a frozen sample of your own real data reveals format quirks, edge cases, and throughput on the inputs you actually process.
How do I document a pilot so the decision holds up later?
Archive the data manifest, the checksums, the pinned software versions, the frozen parameter sets, the raw outputs, the scoring sheet with weights, and the signed recommendation memo. Together these let a colleague rerun the comparison and confirm, or challenge, your conclusion.
Sources
- Comparison of data processing strategies using commercial vs. open-source software in GC-Orbitrap-HRMS untargeted metabolomics analysis for food authentication: thyme geographical differentiation and marker identification as a case study.
- Realizing in-house algorithm-driven free fibula flap set up within 24 hours: a pilot study evaluating accuracy with open-source tools.
- An Evaluation of the Usability of ReACT (Responsive Asthma Care for Teens), an Adaptive Mobile Health Intervention for Adolescents With Asthma: Feasibility and Acceptability Trial.
- Automated Biomedical Research Laboratories: Development, Current State, and a Roadmap for Adaptation into Shared Research Resources.
- Development and Evaluation of an AI Avatar Educational Tool for Depression and Anxiety: A Qualitative Pilot Study.
- Pilot implementation to assess the feasibility and care team impact of an app-based interactive care plan to remotely monitor breast cancer survivors.
- Rapid, Open-Source, and Automated Quantification of the Head Twitch Response in C57BL/6J Mice Using DeepLabCut and Simple Behavioral Analysis.
- Evaluating 16S metagenomics data analysis pipelines using an Ion Torrent sequencer for human gut microbiome research.
- LIGSIFT: an open-source tool for ligand structural alignment and virtual screening.
- An Integrated Open-Source Framework for Automated Analysis of Driver Activity, Glance, and Vehicle Automation Mode.
- Retrospective Comparison of Commercially Available Automated Insulin Delivery With Open-Source Automated Insulin Delivery Systems in Type 1 Diabetes.