Molecular Biology Lab Report Example: An Annotated Model
By Dr. Zubair Khalid, DVM, MS, PhD ·
By the end of this article you will be able to write a complete molecular biology lab report: a title page, abstract, introduction, materials and methods, results, discussion, and reference list. You will see a full worked model built around a realistic yeast CRISPR gene-editing experiment, with each section annotated to explain what earns credit and what loses it. You will also get a reusable molecular biology lab report example template, a numbered walkthrough of the writing process, and worked calculations you can adapt to your own data.
Nothing needs to be installed for most of this article. A spreadsheet program or a Python installation is enough to reproduce the sample calculations. If your course requires statistical tests or figure generation, any standard package such as R, GraphPad Prism, or Python with matplotlib will do.
What a Molecular Biology Lab Report Is For
A lab report is a written argument that your experiment produced a defensible conclusion. The structure, usually called IMRaD (Introduction, Methods, Results, and Discussion), exists so a reader can judge the claim, check the evidence, and repeat the work if needed. Style guidelines used in undergraduate biology courses describe the same expectation: reports should follow a conventional format, state a clear hypothesis, present results without interpretation in the Results section, and reserve interpretation for the Discussion [1].
Course instructors treat the report as evidence of thinking, not just of pipetting. In one study of an undergraduate molecular biology laboratory course, instructors explicitly assessed the quality of experiment execution, report writing, and group collaboration as separate learning outcomes [2]. A skills-based approach published in Biochemistry and Molecular Biology Education makes the same point from the other direction: students who prepare before lab ("Prepare"), engage deliberately during lab ("Do"), and consolidate afterward ("Review") produce better analyses, and the written report is where that Review step becomes visible [3].
Lab Report Format at a Glance
Most molecular biology courses use the same lab report format, with small variations in what each instructor wants in the abstract or in how raw data are handled.
| Section | What it must contain | Typical length | Most common failure |
|---|---|---|---|
| Title and authors | Specific descriptive title, full names, course, date | 1 line to half a page | Vague titles like "Yeast Lab" |
| Abstract | One-paragraph summary: question, approach, key result with a number, conclusion | 150 to 250 words | Omitting the actual quantitative result |
| Introduction | Background, gap, hypothesis or objective, logic of the approach | 1 to 2 pages | Reviewing everything about the field instead of building one argument |
| Materials and Methods | Reagents, strains, equipment, parameters, and sources, written so the work could be repeated | 1 to 2 pages | Recipe-style narration with missing concentrations or conditions |
| Results | Figures, tables, and text that present data without interpretation | 1 to 3 pages | Explaining results in the Results section or labeling figures poorly |
| Discussion | Interpretation, comparison to expectations, error analysis, future directions | 1 to 2 pages | Listing every conceivable source of error instead of the plausible ones |
| References | Cited sources in a consistent citation style | As needed | Citing lecture notes instead of primary literature |
The model report below follows this structure exactly. Use it as a molecular biology lab report example template and swap in your own organism, gene, and assay.
Annotated Model: CRISPR Editing of the Yeast ADE2 Gene
The model experiment comes from the type of teaching lab used in real molecular biology courses. A published description of a course that converted its face-to-face molecular biology lab to an online format centers on using CRISPR-Cas9 editing to introduce mutations into the ADE2 gene in the budding yeast Saccharomyces cerevisiae, with students analyzing data, troubleshooting, and drawing conclusions from the outcomes [4]. That experiment works well as a model because it has a clean, visible phenotype and a quantitative endpoint.
Background of the Model Experiment
In the model, students attempt to disrupt the ADE2 gene in S. cerevisiae. ADE2 encodes an enzyme in the adenine biosynthesis pathway. Loss of ADE2 function causes accumulation of a red pigment in the yeast vacuole, so successful editing turns colonies from cream-colored to red. This color readout is why the experiment appears in teaching labs. Students co-transform yeast with a plasmid carrying Cas9 and a guide RNA targeting ADE2, plus a repair fragment. Cells that repair the double-strand break incorrectly or through the supplied fragment lose ADE2 function and turn red.
The model report presents the following fictional but realistic data set, which you can replace with your own counts.
- Three transformation plates for the experimental condition
- Colony counts on selective medium after three days of growth at 30 degrees Celsius
- Colony PCR on a sample of colonies to confirm the edit at the DNA level
Title and Authors
**Efficiency of CRISPR-Cas9 Disruption of ADE2 in Saccharomyces cerevisiae Assessed by Colony Phenotype and Colony PCR**
A. Rivera and B. Chen BIO 3420 Molecular Biology Laboratory, Section 002 Date of submission: March 14
Annotation. A strong title names the organism, the technique, the gene, and the measurement. "CRISPR Lab" would not. The title is the first thing a grader reads and the last thing most students write, so draft it last, once you know what the report actually shows.
Abstract
We disrupted the ADE2 gene in Saccharomyces cerevisiae using CRISPR-Cas9 to test whether homology-directed repair with a supplied repair fragment produces detectable loss-of-function colonies. Yeast were co-transformed with a Cas9 and guide RNA plasmid and an ADE2 repair fragment, then plated on selective medium. After three days, 47 of 212 colonies (22.2 percent) showed the red phenotype associated with ade2 loss of function. Colony PCR of 12 red colonies produced amplicons consistent with the expected disrupted allele in 11 of 12 cases. These results indicate that the co-transformation workflow yields a moderate editing frequency detectable by colony phenotype, and that phenotype screening is a reliable first-pass readout before molecular confirmation.
Annotation. The abstract contains all four moves in four sentences: question, method, quantitative result, conclusion. Notice that the key numbers (47 of 212, 22.2 percent, 11 of 12) appear here. An abstract without a number is the single most common reason abstracts lose points.
Introduction
Adenine biosynthesis in S. cerevisiae requires the phosphoribosylaminoimidazole carboxylase encoded by ADE2. Cells carrying loss-of-function ade2 alleles accumulate a red pigment derived from the pathway intermediate phosphoribosylaminoimidazole, giving colonies a distinctive color that geneticists have used for decades as a selection and screening marker. This visible phenotype makes ADE2 a practical target for teaching genome editing. CRISPR-Cas9 genome editing introduces a double-strand break at a guide RNA-specified site. Repair of that break determines the outcome. When a repair fragment with homology to the cut site is supplied, the cell can use it as a template. Our objective was to measure the fraction of transformants that show an ade2 loss-of-function phenotype after co-transformation with an ADE2-targeting CRISPR plasmid and a repair fragment. We hypothesized that a majority of colonies surviving selection would carry the editing plasmid, and that a measurable subset, roughly 10 to 30 percent based on comparable teaching-lab outcomes, would show the red phenotype.
Annotation. The introduction moves from gene function, to why the phenotype matters, to the editing mechanism, to a specific hypothesis with a predicted range. It never wanders into a general history of CRISPR. Every sentence exists to set up the measurement in the Results.
Materials and Methods
Strains and media. S. cerevisiae strain BY4741 was grown on YPD agar and in YPD broth. Transformants were selected on synthetic dropout medium lacking uracil. Plasmids and repair fragment. pCAS, a Cas9 expression plasmid with a sgRNA cloning site, carried a guide RNA sequence targeting the ADE2 coding sequence. A double-stranded repair fragment with 40 base pairs of homology to each side of the cut site was synthesized commercially. Yeast transformation. Cells were transformed using a standard lithium acetate and polyethylene glycol-based chemical transformation protocol. The experimental condition received plasmid plus repair fragment. A control transformation received plasmid without repair fragment. Cells were plated on selective medium and incubated at 30 degrees Celsius for three days. Colony PCR. Twelve red colonies were picked and lysed, and PCR was performed with primers flanking the ADE2 target site. Products were resolved by electrophoresis in a 1 percent agarose gel alongside a DNA ladder, and expected amplicon sizes were compared to the parental allele prediction.
Annotation. Four things distinguish a strong Methods section. First, it is organized by what was done, in the order it was done. Second, it names strains, plasmids, media, and conditions precisely. Third, it states the control, which graders look for immediately. Fourth, it is written in past tense, passive or first person depending on your instructor, and never as an imperative recipe ("pick colonies" is wrong, "colonies were picked" is right). Modern molecular biology increasingly outsources steps such as gene synthesis to core facilities and companies, and a good Methods section names those external steps plainly rather than pretending they happened on the bench [5].
Results
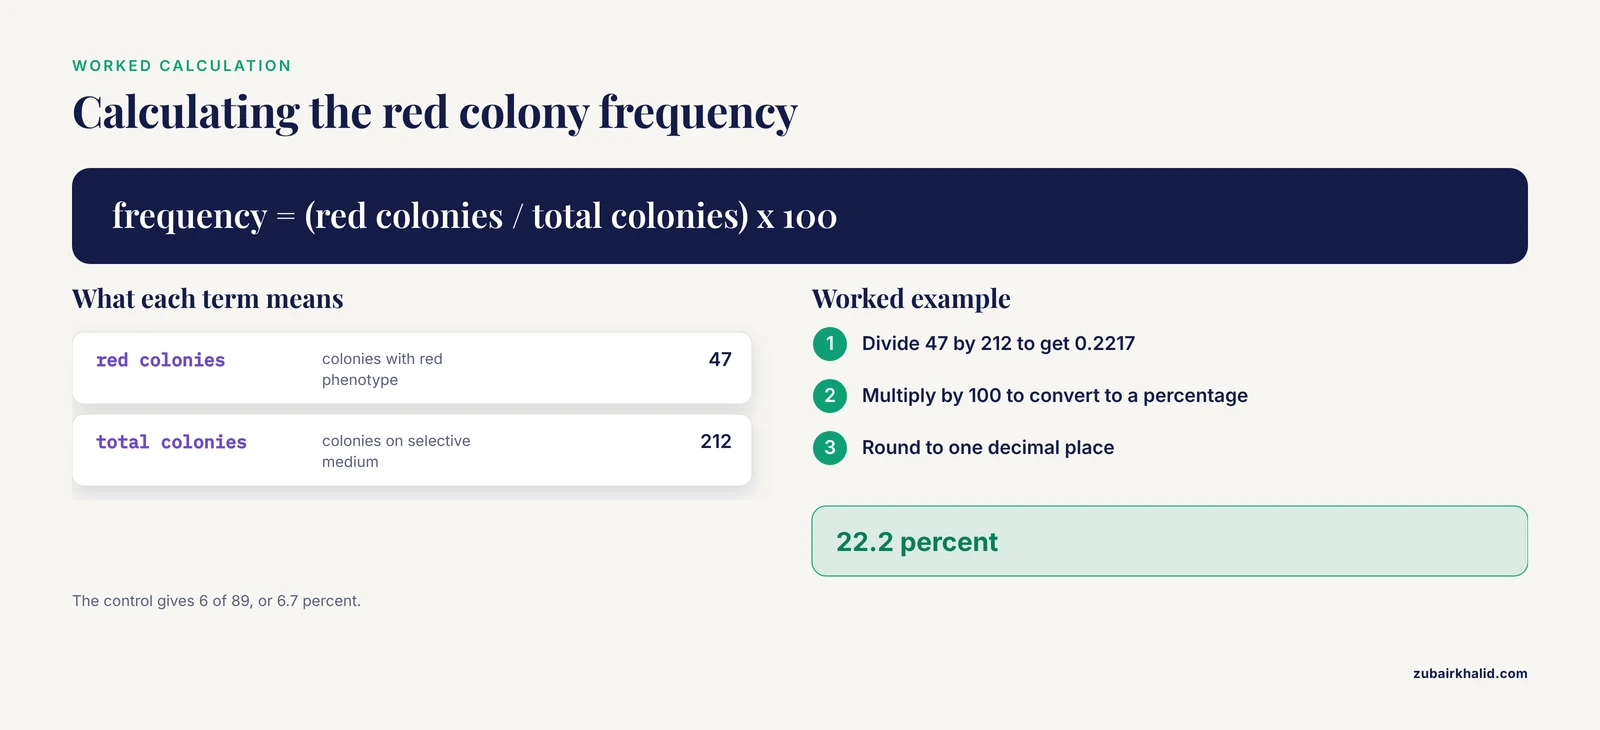
Transformation yield and phenotype frequency. The experimental transformation produced 212 colonies on selective medium after three days. Of these, 47 were red. The editing-associated phenotype frequency was therefore 22.2 percent (Table 1). The control transformation, which received the plasmid without the repair fragment, produced 89 colonies, of which 6 were red (6.7 percent). Colony PCR confirmation. PCR of the 12 sampled red colonies produced bands at the size expected for the disrupted allele in 11 colonies. One red colony produced a band matching the parental allele size, consistent with a red phenotype arising from a cause other than the intended edit. Gel summary. The parental allele was expected to produce a 900 base pair amplicon and the disrupted allele a 620 base pair amplicon. Lanes loaded with the 11 confirmed colonies showed a single band near 620 base pairs. The ladder confirmed band sizing within the expected range.
Compute the phenotype frequency exactly as shown so a reader can retrace the arithmetic:
red_colonies = 47
total_colonies = 212
phenotype_frequency = red_colonies / total_colonies * 100

print(f"{phenotype_frequency:.1f} percent")
Expected output:
22.2 percentThe control comparison matters because red colonies in the control show that some redness arises independently of the repair fragment. The difference between conditions can be stated as a ratio:
experimental_freq = 47 / 212 * 100
control_freq = 6 / 89 * 100

print(f"Experimental: {experimental_freq:.1f} percent")
print(f"Control: {control_freq:.1f} percent")
Expected output:
Experimental: 22.2 percent
Control: 6.7 percent
Annotation. Three habits define a good Results section. First, every number in the text appears in a table or figure, and every figure is called out in the text. Second, the section states what the data show without saying what they mean. "11 of 12 colonies produced the disrupted-allele band" belongs here. "The edit was successful" does not, because that is interpretation. Third, raw counts are shown, not just percentages, so a reader can check the math. Restriction-mapping exercises used in undergraduate molecular biology labs teach exactly this skill of reading fragment sizes off a gel and reconciling them with a predicted map, and the same discipline applies to interpreting any PCR or digest result [6].
Discussion
The 22.2 percent phenotype frequency confirms that the co-transformation workflow produces detectable ade2 loss-of-function colonies at a rate within the hypothesized 10 to 30 percent range. The control result sharpens this conclusion. Red colonies appeared at 6.7 percent even without the repair fragment, which indicates that a minority of red phenotypes arise from indel formation at the cut site or from spontaneous ade2 mutations rather than template-directed repair. The colony PCR data support the phenotype screen as a first-pass readout, with 11 of 12 red colonies carrying a disrupted-allele-sized amplicon. The single discrepancy, a red colony with a parental-sized band, is best explained by a mutation elsewhere in ADE2 or in a pigment pathway gene, though we cannot distinguish these with the data collected. Two improvements follow directly. Increasing the number of colonies sampled by PCR would tighten the estimate of how often the red phenotype reflects the intended edit. Sequencing the amplicons would identify the actual lesion rather than inferring it from band size.
Annotation. The Discussion does four things in order: answers the question posed in the Introduction, uses the control to refine the claim, offers one specific explanation for the anomalous result, and proposes concrete next steps tied to the limitations. Compare this to professional practice. When Molecular Systems Biology accepts a paper, the editors issue a transaction report consolidating reviewer points, and authors must respond point by point with evidence before publication [7]. The same dynamic plays out in that journal's handling of a combined experimental and computational study, where reviewer queries drove specific revisions to the analysis before acceptance [8]. Writing your Discussion as if a reviewer will probe each claim is the fastest way to make it rigorous.
How to Write a Lab Report: A Numbered Walkthrough
Write your Methods section first, the day of the experiment. Open a document during lab and record strains, reagents, concentrations, incubation times, and temperatures as you use them. The Prepare, Do, Review model shows that this consolidation step is where most learning and most report quality is generated [3]. [7] Organize raw data in a spreadsheet. One row per sample or colony. Label plates and tubes identically to the spreadsheet headers. For the model experiment, this is a row per colony with columns for plate, color, PCR result, and band size. [8] Calculate your key numbers. Use the code blocks above as patterns. Replace the counts with yours. Run the calculation twice, once by hand and once in code, and check the outputs agree. Build figures and tables before writing prose. A Results section is easier to write when the figure exists. Every figure needs a numbered caption that states what is shown and the key conditions, for example "Figure 1. Agarose gel of colony PCR products from 12 red colonies. Lanes 1 through 12, one colony each. M, DNA ladder. The arrow marks the 620 base pair disrupted-allele band." Draft the Results text around the figures. One short paragraph per figure or table. State the observation, the direction of the effect, and the numbers. No interpretation. [2] Write the Introduction. End it with your objective and hypothesis, which you now know precisely because the experiment is done. [11] Write the Discussion. Answer the introduction's question, explain the control's contribution, address the most plausible error, and propose next steps. Write the Abstract last. Copy your best sentence from each section into one paragraph, then cut to under 250 words. Choose a title that names organism, technique, and measurement. Check the report against the format checklist. Confirm every section from the table above is present, every figure is cited in text, every in-text citation appears in the reference list, and the tense and voice are consistent.
Using the Example as a Template
To adapt this molecular biology lab report example to your own experiment, hold the skeleton and swap the specifics. The elements that survive any substitution are the hypothesis sentence in the Introduction, the control statement in the Methods, the count-and-frequency structure in the Results, and the answer-the-question order of the Discussion.
Three extensions are common in current courses. First, many labs now combine wet-bench work with sequence analysis, and integrated teaching models that pair molecular biology with bioinformatics have students process their own data computationally, with peer review of the resulting reports used deliberately as a teaching method [12]. If your course does this, add a short "Data analysis" subsection under Methods naming the tools and parameters. Second, image-based assays such as the Cell Painting platform, which uses fluorescence microscopy to generate bioactivity fingerprints for small molecules, have entered smaller labs, and reports from such labs emphasize detailed protocol documentation and clear descriptions of how data are analyzed and represented [9]. If your assay is image-based, your figure captions carry extra weight. Third, clinical and diagnostic lab reports follow a different convention, presenting values alongside reference ranges stratified by risk category, as formalized in a joint document from the Italian Society of Cardiology and the Italian Society of Clinical Biochemistry and Clinical Molecular Biology on reporting lipid profiles [10]. If you rotate through a clinical laboratory, expect your reports to look like that, not like IMRaD.
For courses that moved partially or fully online, the report often becomes the primary artifact of assessment. A hybrid undergraduate molecular biology course in China paired virtual simulated experiments before the in-person session with online debriefs afterward and found that report quality and experiment execution both benefited from the practice-run structure [4][2]. If your course uses a similar model, treat the pre-lab simulation as a draft of your Methods section.
Common Mistakes and Limitations
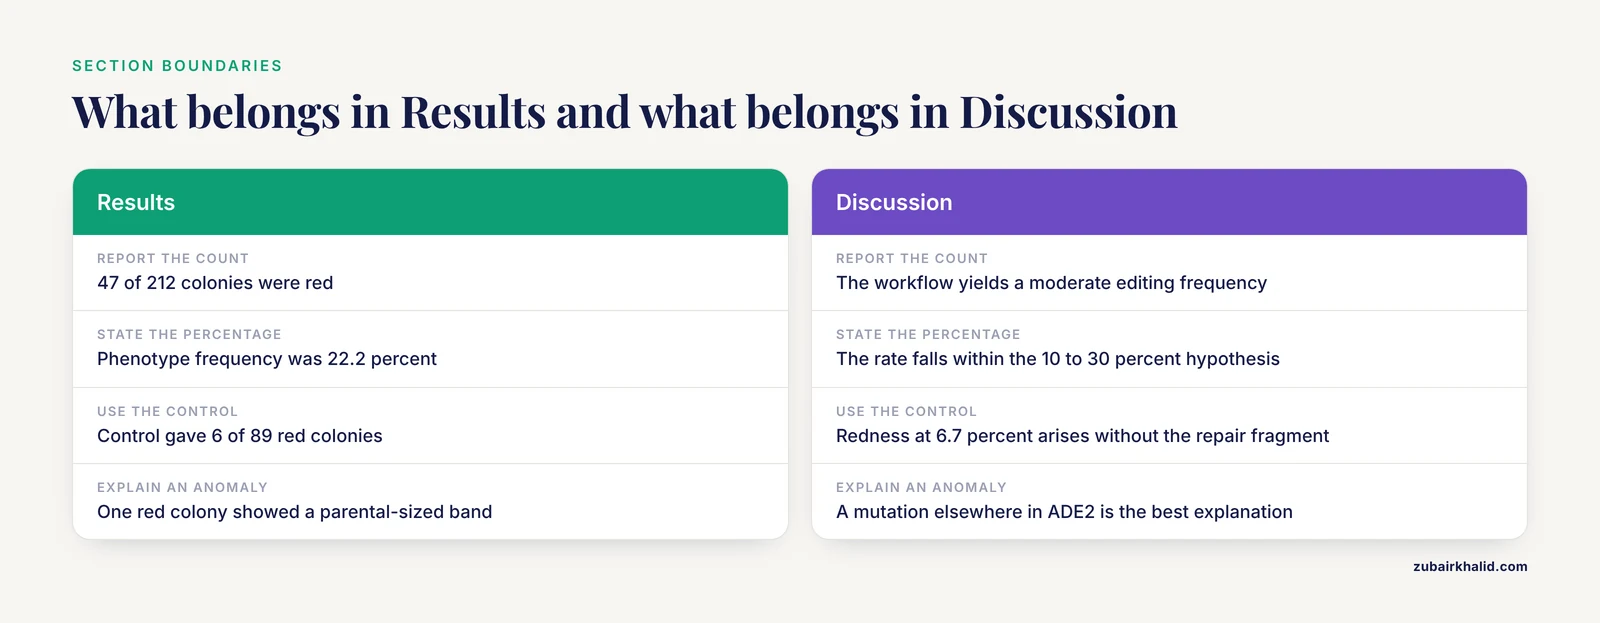
- Interpreting in the Results section. Keep claims about meaning out of Results. Save them for the Discussion.
- Missing numbers in the abstract. If the abstract lacks the key count or percentage, it fails its only job.
- Vague Methods. Omitting a temperature, an incubation time, or the strain name makes repeat work impossible and costs points.
- Ignoring the control. A control that produced data must be reported and discussed. In the model, the 6.7 percent control frequency changes how the 22.2 percent figure should be read.
- Error-list padding. Naming ten hypothetical error sources is weaker than analyzing the two or three that could plausibly explain your anomaly.
- Figure-caption neglect. An unlabeled lane or an undefined abbreviation in a caption is a guaranteed deduction.
- Citation mismatch. Every in-text citation must appear in the reference list and vice versa.
- Overstating one experiment. A single transformation with 212 colonies supports a moderate claim, not a universal one. Match claim strength to sample size.
- Copying templates without adapting them. Instructors recognize recycled text. The template supplies structure, not sentences.
- A general limitation. A lab report reflects one experiment under one set of conditions. Your instructor's rubric, not this article, defines the final expectations for your course, so read it before you write.
Frequently Asked Questions
How long should a molecular biology lab report be?
Most undergraduate molecular biology lab reports run 6 to 10 pages of text plus figures, tables, and references. Follow your course rubric if it specifies a length, because expectations vary more between courses than any other parameter.
What is the standard lab report format?
The standard lab report format is IMRaD: Title, Abstract, Introduction, Materials and Methods, Results, Discussion, and References. Some courses add a separate Conclusion or require raw data as an appendix.
How do I write the abstract for a lab report?
Write it last. Include one sentence each for the question, the approach, the key quantitative result, and the conclusion. If your abstract has no number in it, revise it.
What should go in the Materials and Methods section?
Everything a competent person would need to repeat the work: strains, plasmids, reagents with concentrations, media, equipment settings, incubation conditions, and the identity of any control. Write it in past tense.
How do I present gel electrophoresis results?
Include a labeled figure with lane numbers, a ladder lane, and a caption giving expected band sizes. In the Results text, state which lanes showed which bands and compare them to the predicted sizes.
Should I include failed experiments in a lab report?
Yes, when they bear on the conclusion. A failed control or a contaminated plate belongs in Results and Discussion because it constrains what your data can support. Do not include failures that are irrelevant to the question.
How is a lab report graded?
Most rubrics grade abstract, introduction, methods, results, discussion, figures, references, and writing quality as separate line items. In course evaluations of molecular biology labs, report writing is typically scored as its own outcome, separate from execution of the experiment.
Can I use first person in a lab report?
Check your instructor's policy. "We transformed the cells" is acceptable in many journals and courses, while others prefer passive voice. Pick one and stay consistent throughout the report.
Sources
- Writing a Biology Lab Report Style Guidelines
- Effectiveness of an “online + in-person” hybrid model for an undergraduate molecular biology lab during COVID-19
- Prepare, Do, Review: A skills-based approach for laboratory practical classes in biochemistry and molecular biology
- Converting a Face-to-Face Lab to Online: An Example of Process and Outcomes for a CRISPR-Based Molecular Biology Lab
- How advancements in molecular biology impact education and training
- Using restriction mapping to teach basic skills in the molecular biology lab
- Molecular Systems Biology Peer Review Process File Phosphoproteome Dynamics Reveal Novel Erk1/2 Map Kinase Substrates with Broad Spectrum of Functions Transaction Report
- Molecular Systems Biology Peer Review Process File Combined Experimental and Computational Analysis of Dna Damage Signaling Reveals Context-dependent Roles for Erk in Apoptosis and G1/s Arrest after Genotoxic Stress Transaction Report
- Establishing cell painting in a smaller chemical biology lab - A report from the frontier.
- [[Hypercholesterolemia and laboratory reports: joint document from the Italian Society of Cardiology (SIC) and the Italian Society of Clinical Biochemistry and Clinical Molecular Biology - Lab Medicine (SIBioC)].](https://pubmed.ncbi.nlm.nih.gov/39342561/)
- Using a (patho)histology lab to teach cell & molecular biology concepts
- Integrating Molecular Biology and Bioinformatics Education