Data Dictionaries for Longitudinal Studies
By Dr. Zubair Khalid, DVM, MS, PhD ·

By the end of this article you will be able to build a machine-readable data dictionary for a longitudinal study, validate your actual data files against it with a short script, version it so that wave-to-wave changes are traceable, and package it so that a collaborator or reviewer can reproduce your dataset without emailing you. You need a spreadsheet program, Python 3 with pandas installed (or R with the readr package), and your study's variable list or codebook from at least two waves of data collection.
What a Longitudinal Data Dictionary Is
A data dictionary is a structured document that defines every variable in a dataset: its name, meaning, measurement units, allowed values, missing codes, and origin. A longitudinal data dictionary does the same job, but it must also describe the time dimension. It answers questions that a cross-sectional dictionary never faces. Which variables were collected at which wave? Did the response scale change between wave 2 and wave 3? Which visit date anchors each record? How do records link back to the same person, animal, or sample over time?
Large collaborative projects treat the dictionary as a first-class artifact rather than an afterthought. The ICGC ARGO project, which sequences germline and tumor genomes from 100,000 cancer patients across 13 countries and 22 tumor types, built its clinical data dictionary around an event-based data model explicitly designed to capture clinical relationships and support longitudinal data collection, grounded in standardized terminology so that data from diverse tumor types remain interoperable [1]. That is the model to aim for, scaled to your study.
Best-practice reviews of data management in experimental biomedicine make the same point at any scale. Well-organized and well-documented data are what allow others to validate results and build on them, and documentation of procedures, data collection, and analysis methods is the foundation of transparent, accountable research [2].
One word, two meanings
A caution on terminology. In machine learning, "dictionary learning" refers to algorithms that decompose signals into sparse basis elements. Recent examples include longitudinal sparse dictionary learning, which extracted 21 consistent intrinsic connectivity networks from longitudinal macaque fMRI data [3], and a discriminative dictionary learning framework applied to longitudinal structural MRI from 164 patients with mild cognitive impairment, which predicted progression to Alzheimer's disease with a mean accuracy of 0.973 and an area under the ROC curve of 0.984 [4]. Those methods share nothing with a data dictionary except the word. This article is about the documentation artifact that defines your variables, not the decomposition method.
Why Longitudinal Studies Need Dictionaries More Than Cross-Sectional Ones
Repeated measurement multiplies the ways a dataset can go quietly wrong. Four problems show up in almost every longitudinal project.
Wave-specific instruments. Protocols evolve. A questionnaire adds items in wave 2, an assay switches platforms in wave 3, a sensor firmware update changes units. A dictionary with a single row per variable cannot represent this. You need wave applicability and version fields.
Record linking. Analysis of repeated measures requires an unambiguous key that combines a stable subject identifier with a wave or visit identifier. If the key is ambiguous, joins silently duplicate or drop rows.
Temporal alignment. Timestamps drift across years of collection. Daylight saving changes, device clock skew, and mixed date formats are chronic in longitudinal sensor work. A reproducible R workflow for school-based air quality campaigns dealt with exactly this by standardizing timestamps, including daylight saving changes, before harmonizing sensor signals with activity logs [5].
Attrition and missingness patterns. In longitudinal data, missingness is informative. A subject who leaves the study after wave 2 is not the same as a variable that was not measured at wave 2. The dictionary must distinguish "not collected at this wave" from "collected but missing" from "collected but failed quality control."
The scale of the problem grows fast. The Preclinical Addiction Research Consortium phenotyped over 3,000 rats for addiction-like behaviors, producing more than 100,000 data files, and managed them by converting raw operant output into structured spreadsheets, integrating standardized experimental, behavioral, and metadata spreadsheets, and loading everything into a relational SQL database with automated quality control [6]. The metadata spreadsheets in that pipeline are, in effect, operational data dictionaries. The Swiss HIV Cohort Study, which has enrolled 21,876 people with HIV since 1988, faced comparable challenges with next-generation sequencing data and set up a dedicated database to handle storage, downstream tooling, and reproducibility across decades of follow-up [7].
Anatomy of a Longitudinal Data Dictionary
A usable dictionary has one row per variable per wave applicability, with at minimum the fields below. Anything less and downstream users will guess.
| Field | What it defines | Example |
|---|---|---|
| variable_name | Machine-readable, snake_case, unique per row | crp_mg_l |
| label | Human-readable description | C-reactive protein, serum |
| data_type | numeric, integer, character, categorical, date, datetime | numeric |
| units | Measurement unit, SI preferred | mg/L |
| allowed_values | Range, enumeration, or format pattern | 0.1 to 200 |
| missing_codes | Sentinels and their meanings | -99 = not collected at this wave, -77 = failed QC |
| waves_collected | Which waves the variable applies to | 1, 2, 3 |
| instrument_version | Protocol or device version per wave | Assay kit v2 from wave 2 |
| source | File, form, or device the value came from | lab_assay_w3.csv |
| derivation | Formula if the variable is computed | bmi = weight_kg / (height_m ** 2) |
| key_role | Whether the variable is part of the primary key | wave is part of key |
| notes | Free text for caveats | Platform changed in wave 3 |
Two structural decisions matter more than any individual field.
Long format versus wide format. In long format, each row is one subject at one wave, with columns subject_id, wave, and then one column per variable. In wide format, each wave gets its own set of columns, such as weight_w1, weight_w2, weight_w3. Long format is almost always the better backbone for a longitudinal dictionary because new waves extend rows rather than force a schema rewrite, and most statistical software for repeated measures expects it. If you must also deliver wide format, generate it from the long format with a script, and document that script.
Missing codes. Pick a small, documented set of sentinel values and never reuse them as real data. Common conventions reserve negative numbers as sentinels, for example -99 for not collected, -88 for not applicable, -77 for failed quality control, and -66 for refused. The specific numbers matter less than the rule that every sentinel appears in the dictionary with a defined meaning and is excluded from numeric summaries.
Building a Longitudinal Data Dictionary Step by Step
This walkthrough uses a small fictional cohort study with three annual waves measuring body weight, C-reactive protein, and a quality-of-life score. Adapt the steps to your own variables.
Step 1: Inventory every variable across every wave
Before writing anything, list every variable that has ever existed in the study, including the ones you dropped. Pull this from data collection forms, instrument manuals, and raw export files. For each variable, record which waves it appears in. A plain CSV is fine at this stage.
variable_name,waves_present
subject_id,1;2;3
wave,1;2;3
visit_date,1;2;3
weight_kg,1;2;3
crp_mg_l,2;3
qol_score,1;2;3
qol_scale_version,1;2;3
Note that crp_mg_l only exists in waves 2 and 3. That fact belongs in the dictionary, not in tribal knowledge.
Step 2: Define the primary key
For a cohort followed at repeated visits, the primary key is almost always the pair of subject identifier and wave (or visit date). State this explicitly in the dictionary and enforce uniqueness. Write it down even if it feels obvious. Six months from now, a collaborator will ask whether there can be two visits per wave.
Step 3: Fill in the core fields for each variable
For each row, set the data type, units, allowed values, and missing codes. Use controlled vocabularies where they exist. If your field is a clinical concept, anchoring terminology to an established standard, as the ICGC ARGO dictionary does, keeps your data interoperable with other standards [1]. If your variable comes from a validated instrument, record the instrument name and version, because version changes are a leading source of silent non-comparability across waves.
Step 4: Document derivations exactly
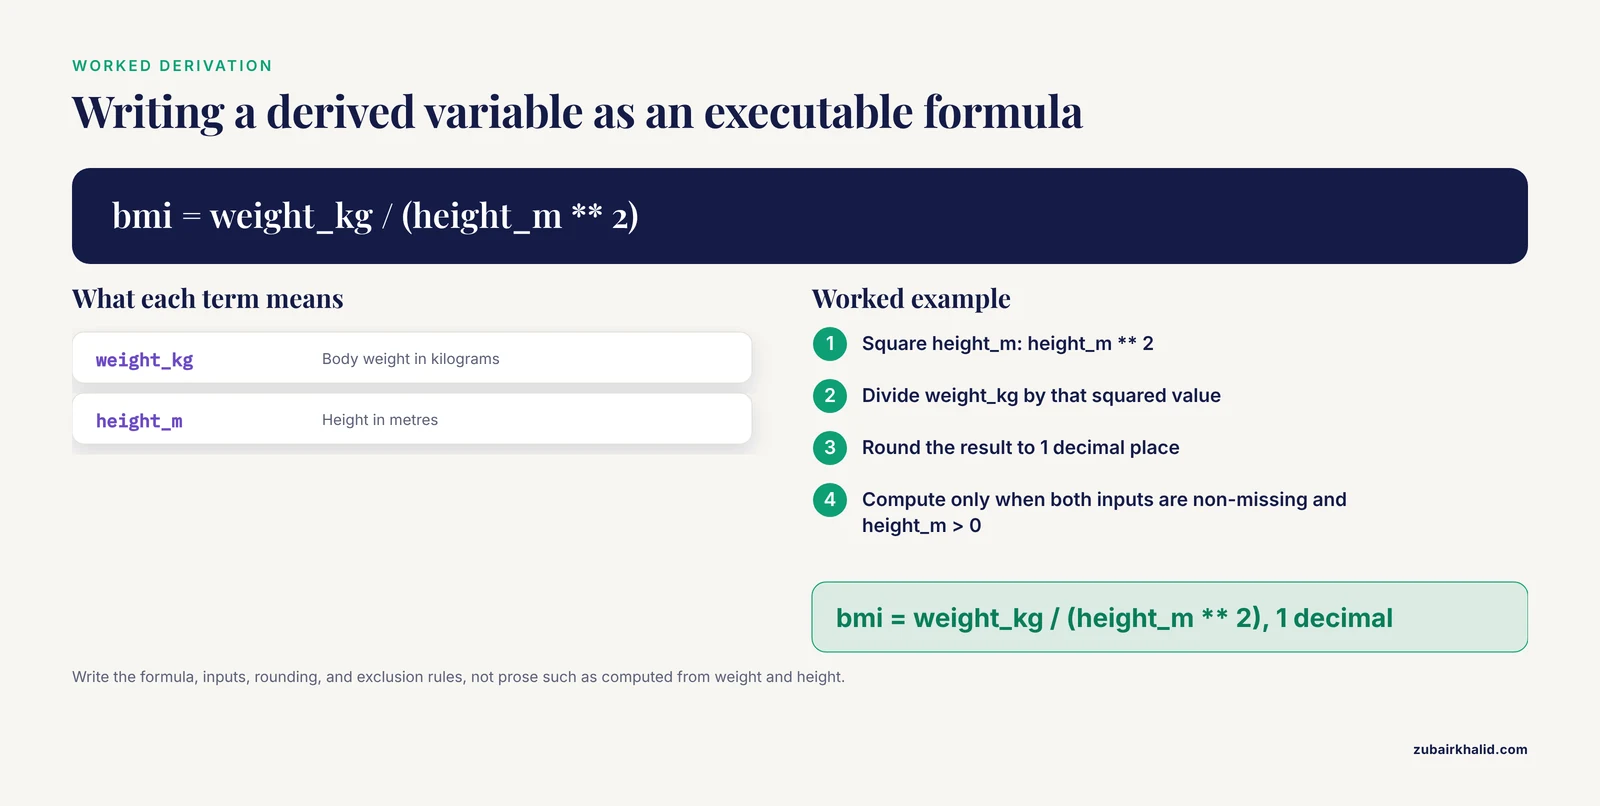
Any computed variable needs its formula, its inputs, and its rounding or exclusion rules. Write derivations as executable expressions, not prose. For example:
bmi = weight_kg / (height_m ** 2), round to 1 decimal, computed only when both inputs are non-missing and height_m > 0This principle generalizes far beyond simple derived columns. In toxicology, the pipeline from raw machine output to a final hit classification passes through multiple data layers, and because different processing of the same raw data can change the final classification, processing steps are now treated as an essential part of method descriptions and reporting templates [8]. Your derivation field is the same idea at notebook scale.
Step 5: Make the dictionary machine-readable
A human-readable spreadsheet helps people. A machine-readable file helps both people and scripts. Two practical formats work well: a UTF-8 CSV with one row per variable per wave applicability, or a YAML file that groups variables and lists wave-specific attributes. Here is the same information as YAML for one variable:
crp_mg_l:
  label: "C-reactive protein, serum"
  data_type: numeric
  units: "mg/L"
  allowed_range: [0.1, 200]
  missing_codes:
    -99: "not collected at this wave"
    -77: "assay failed quality control"
  waves_collected: [2, 3]
  instrument_version:
    2: "assay kit v1"
    3: "assay kit v2"
  source: "lab_assay_export"
  notes: "Platform changed between wave 2 and wave 3. Record kit lot in source file."
Step 6: Validate the data against the dictionary
Validation turns the dictionary from documentation into a quality control tool. The script below checks four things: that every dictionary variable exists in the data, that types match, that values fall in allowed ranges or match sentinels, and that the primary key is unique.
import pandas as pd
import yaml

# Load the dictionary and one wave of data
with open("data_dictionary.yml") as f:
    dd = yaml.safe_load(f)

df = pd.read_csv("wave3_cohort.csv")

problems = []

# 1. Every dictionary variable present in the data
for var in dd:
    if var not in df.columns:
        problems.append(f"MISSING COLUMN: {var} in dictionary but not in data")

# 2. Type check: numeric variables must parse as numbers
for var, spec in dd.items():
    if var in df.columns and spec["data_type"] == "numeric":
        parsed = pd.to_numeric(df[var], errors="coerce")
        # Coercion failures are values that are neither numbers nor documented sentinels
        bad = df[var][parsed.isna() & ~df[var].isin(spec["missing_codes"].keys())]
        if len(bad):
            problems.append(f"TYPE ERROR: {var} has {len(bad)} non-numeric, non-sentinel values")

# 3. Range check on non-missing values
for var, spec in dd.items():
    if var in df.columns and spec["data_type"] == "numeric":
        vals = pd.to_numeric(df[var], errors="coerce").dropna()
        sentinels = list(spec["missing_codes"].keys())
        vals = vals[~vals.isin(sentinels)]
        lo, hi = spec["allowed_range"]
        out = vals[(vals < lo) | (vals > hi)]
        if len(out):
            problems.append(f"RANGE ERROR: {var} has {len(out)} values outside {lo}-{hi}")

# 4. Uniqueness of the primary key
if df.duplicated(subset=["subject_id", "wave"]).any():
    problems.append(f"KEY ERROR: {df.duplicated(subset=['subject_id','wave']).sum()} duplicate subject_id-wave rows")

if problems:
    print("\n".join(problems))
else:
    print("All dictionary checks passed.")
Expected output against a clean file:
All dictionary checks passed.Expected output against a file where one CRP value was entered as "1,2" with a comma decimal and one subject appears twice:
TYPE ERROR: crp_mg_l has 1 non-numeric, non-sentinel values
KEY ERROR: 1 duplicate subject_id-wave rows
Step 7: Interpret errors and fix them
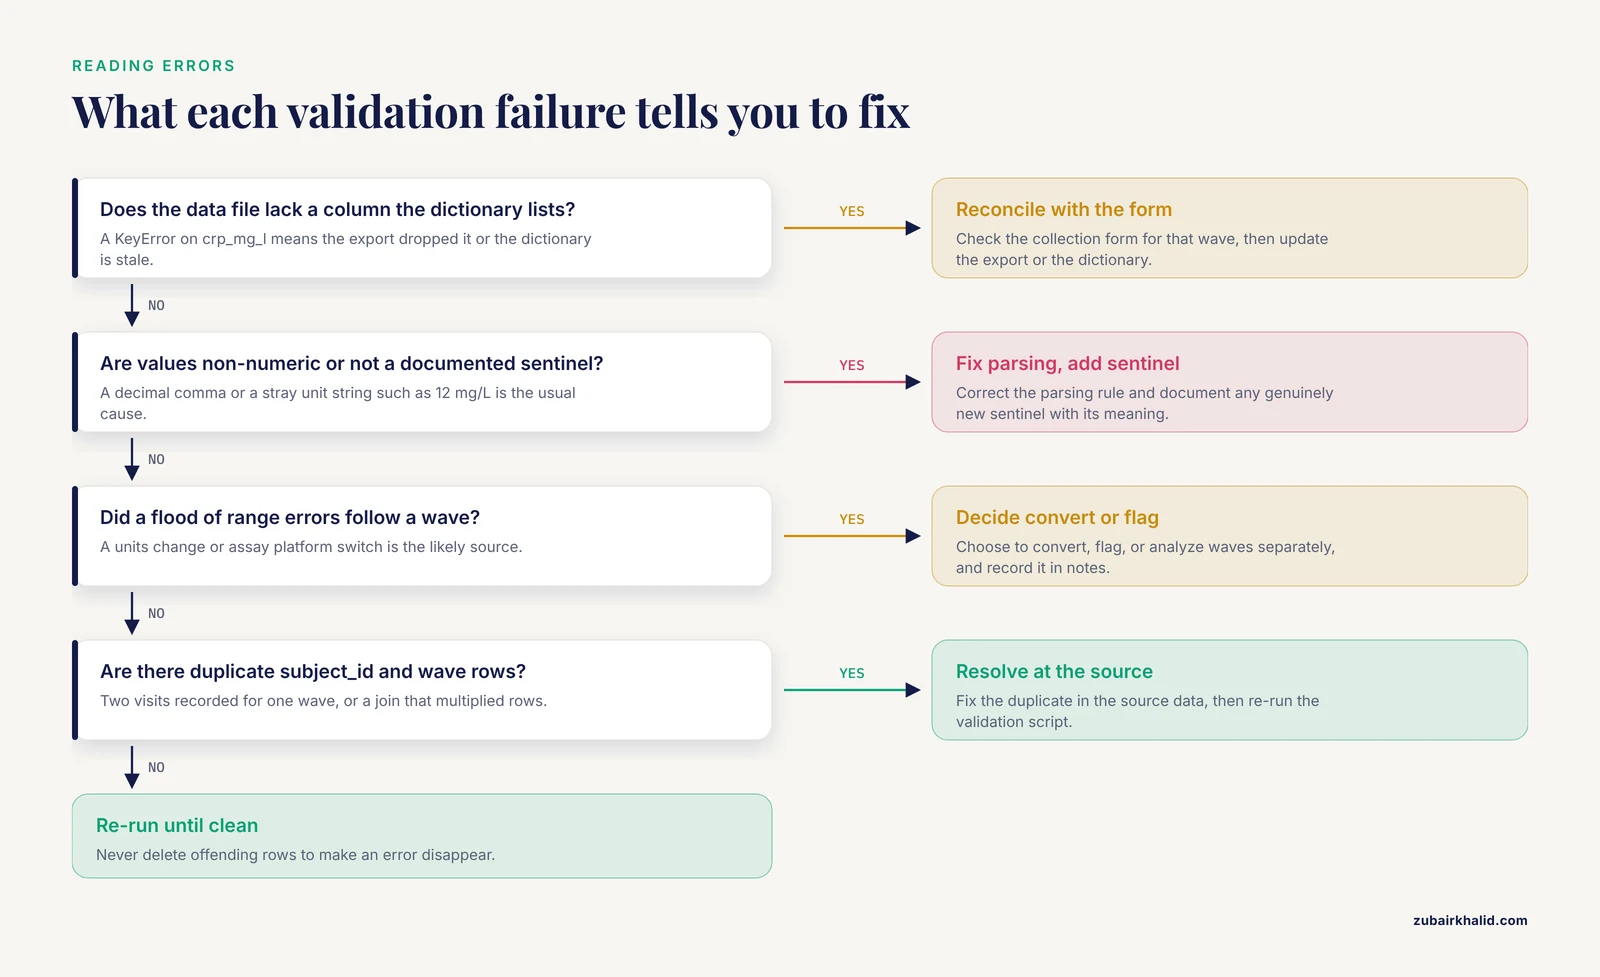
Common validation failures and their fixes:
KeyError: 'crp_mg_l'inside the loop means the dictionary lists a variable the data file lacks. Either the export dropped a column or the dictionary is out of date. Reconcile against the collection form for that wave.ValueError: could not convert string to floator the coerce path above usually means a decimal comma, a stray unit string such as "12 mg/L", or an undocumented sentinel. Fix the parsing rule, then add any genuinely new sentinel to the dictionary with a meaning. Never delete the offending rows to make the error disappear.- A flood of RANGE ERRORs after a wave typically means a units change. If the assay platform changed, as in the worked example, decide whether to convert, flag, or analyze waves separately, and record the decision in the notes field. Many field datasets hide exactly this problem under timestamps and sensor drift. The school air quality workflow mentioned earlier built temporal alignment and harmonization into the pipeline precisely because raw signals from different campaigns are incomplete, noisy, and inconsistently timed [5].
- Duplicate key rows usually mean two visits were recorded for one wave or a join during export multiplied rows. Resolve at the source, then re-run.
Step 8: Version the dictionary and release it with the data
Store the dictionary file in the same repository as the data and analysis code, and give it a version number that changes whenever a definition changes. When an analysis result depends on a dictionary version, cite that version in the analysis script. Electronic lab notebook frameworks that consolidate data, documents, and code into one tracked system exist precisely because fragmented documentation undermines reproducibility, and immutably recorded project history makes authorship and provenance verifiable [9]. You do not need blockchain to get the benefit. A git tag on the dictionary file at each data release achieves the core guarantee.
A useful release rule: if a change would alter any downstream number, it is a major version change. Renaming a label is minor. Changing a missing code, a derivation, or a units field is major.
Real-World Examples From Published Studies
Published projects show the pattern across data types.
Clinical and genomic cohorts. The Swiss HIV Cohort Study viral sequencing database was designed to handle high volumes of raw and processed sequencing data, downstream bioinformatic tooling, and reproducibility requirements for a cohort followed since 1988 [7]. The dictionary and data model had to survive decades and multiple sequencing generations.
High-throughput behavioral phenotyping. The PARC pipeline integrated standardized experimental, behavioral, and metadata spreadsheets into a relational database, enabling automated quality control, backups, and daily summary reports while reducing human workload and error [6]. Structured metadata was the price of admission for automation.
Clinical data platforms. A methodology for mapping REDCap project folders into a standardized hierarchy, from raw acquisition to processed outcomes, improved traceability and reduced time spent retrieving data in a cardiovascular bioengineering use case [10]. Folder structure and the variable dictionary together define where a value came from and where derived outputs go.
AI-ready clinical data. Work preparing electronic health record data for machine learning emphasized curating raw data with validated definitions to create variables such as age, race, gender, and healthcare utilization, drawing on clinical, statistical, and data expertise, which reduced missingness and improved representation before any model was trained [11]. The dictionary, in that setting, is where bias reduction starts.
Structured representations for high-volume signals. The Meta-EEGs framework addressed inconsistent windowing, timestamp misalignment, and unstructured large-scale EEG recordings by defining a structured, domain-agnostic representation with consistent windows and event-based segmentation [12]. That representation is a dictionary of time structure rather than of scalar variables, but the design goal is identical.
Longitudinal text and social media data. Multi-year social media studies define their analysis dictionaries up front. A study of 86,581,237 US tweets during the COVID-19 pandemic used latent Dirichlet allocation topic modeling to track theme evolution over time [13]. A Japanese study of 2,625,807 tweets from 1,052,976 unique users about older drivers, spanning 2010 to 2022, applied the Japanese version of the Linguistic Inquiry and Word Count dictionary quarterly for sentiment analysis alongside dynamic topic modeling [14]. In text research, the "dictionary" of coded word categories plays the same role your variable dictionary plays for tabular data, and it must be fixed and reported for the longitudinal trends to mean anything.
FAIR data releases. A FAIR-compliant bovine vocalization dataset of 569 expertly curated clips spanning 48 behavioral classes, expanded to 2,900 samples through augmentation, paired the raw recordings with standardized feature engineering and documented pipelines so that others could reuse the resource [15]. FAIR-compliance is largely a documentation commitment, and the dictionary is its core.
Longitudinal Data Dictionary Tips
- Write the dictionary before the first wave of collection. It is cheaper to fix a variable definition on paper than to reconcile three years of inconsistent data. If the study already started, build the dictionary retrospectively from wave 1 forms, then maintain it prospectively.
- One row per variable per context. If a variable's units, scale, or allowed values differ by wave, give it distinct rows or explicit wave-conditioned attributes. A single ambiguous row is worse than two clear ones.
- Record the instrument version as data, not as an email. A column in the dataset that says which questionnaire version or kit lot produced each value costs almost nothing to add and saves entire re-analyses.
- Keep sentinels out of your statistics. Code summaries to mask documented missing codes before computing means and ranges. A mean that includes -99 is the most common visible symptom of a dictionary that nobody consulted.
- Automate the check. Run the validation script in continuous integration so every data update is checked against the dictionary before it reaches analysts. Pipelines built on workflow managers such as Snakemake achieve the same guarantee for whole analysis workflows, covering quality control through final outputs in a single reproducible path [16]. Declarative, shareable configuration files that encode entire processing pipelines serve the same goal in spectral preprocessing across heterogeneous instruments [17].
- Document the reader, not just the writer. Include a short "how to load this dataset" section in the dictionary release: file names, encodings, the expected key, and one load command that works. Tools exist to lower the expertise barrier for complex formats such as DICOM by consolidating reading, visualization, and processing in one interface [18], and the same spirit applies to tabular cohorts. Your dictionary should make the first hour with the data painless.
- Freeze definitions at analysis time. When a paper is submitted, tag the dictionary version used. If definitions later change, the published result remains traceable to the exact definitions that produced it.
Common Mistakes and Limitations
- Defining variables only in the data entry tool. Form builders and REDCap projects generate their own metadata, but analysts receive flat files. Export and version the definitions alongside the data, and map the folder or project structure so raw files, forms, and processed outputs trace to each other [10].
- Treating the dictionary as static. Longitudinal protocols change. If the dictionary has no version history, wave 3 changes contaminate wave 1 definitions retroactively. Version every change and note which waves it affects.
- Conflating missingness types. Collapsing "not collected," "not applicable," "refused," and "failed QC" into a single NA destroys the information analysts need to model attrition. Use distinct sentinels with documented meanings.
- Ambiguous keys. Allowing two rows for one subject and wave without a visit ordinal makes every downstream join a gamble. Add a visit_number column if repeated visits within a wave are possible.
- Unrecorded unit and platform changes. A scale recalibration or assay platform switch mid-study can create a step change that looks like a biological finding. The dictionary notes field is where you prevent that misreading.
- Derivations described in prose. "Computed from weight and height" is not a derivation. Write the exact formula, input variables, exclusion rules, and rounding.
- Assuming dictionary learning methods will fix documentation problems. Methods such as longitudinal sparse dictionary learning improve modeling of repeated neuroimaging data [3], and longitudinal MRI dictionary learning improved prediction of cognitive impairment progression relative to single-timepoint data [4]. No modeling method compensates for undocumented variables. The dictionary comes first.
- A limitation to state plainly. A data dictionary documents what was collected and how. It cannot make a poorly designed study analysable, and it cannot replace domain judgment when definitions conflict. Individual datasets, like individual cases in clinical work, still require expert review, and for medical questions that means a qualified clinician.
A Reproducibility Checklist for Your Data Dictionary
Use this checklist before each data release. Checking every box is a concrete, auditable definition of reproducible research for the documentation layer.
- The dictionary file is machine-readable (CSV, YAML, or JSON) and UTF-8 encoded.
- Every variable in every released data file has a dictionary row.
- Every dictionary variable exists in at least one released file, or is explicitly marked as retired.
- Data types, units, allowed values, and missing codes are specified for every variable.
- Wave applicability and instrument versions are recorded for every variable.
- The primary key is stated, and uniqueness has been verified by script.
- All derived variables have executable formulas.
- The validation script runs in continuous integration and passed on the current release.
- The dictionary has a version number, and the version is recorded in every analysis that consumes the data.
- The dictionary is stored in the same repository as the data and code, with a tagged release.
- A short load instructions section ships with the dictionary.
- Deprecated variables and codes remain documented with their retirement wave, rather than deleted.
Items 8 through 10 echo a broader point from best-practice reviews: meeting funder and journal expectations increasingly requires rigorous methodology, comprehensive documentation, and sharing of data and code [2]. The checklist operationalizes that for longitudinal work.
Frequently Asked Questions
What is a longitudinal data dictionary?
It is a structured, machine-readable document that defines every variable in a repeated-measures dataset, including which waves each variable was collected in, its units and allowed values, its missing codes, and the key that links records across time.
How is a longitudinal data dictionary different from a regular codebook?
A regular codebook describes one snapshot of variables. A longitudinal dictionary adds wave applicability, instrument versions per wave, temporal keys, and missingness categories that distinguish attrition from item-level nonresponse.
What format should I use for the dictionary?
Use a machine-readable format such as CSV, YAML, or JSON, stored under version control next to the data. Keep a human-readable rendered version for collaborators, but generate it from the machine-readable source so the two never diverge.
How do I handle variables that change between waves?
Give each distinct definition its own row or wave-conditioned attributes, record the instrument or platform version per wave, and add a version note explaining the change. Never overwrite a definition silently.
What missing codes should I use?
Adopt a small fixed set of negative sentinels, for example -99 for not collected, -88 for not applicable, -77 for failed quality control, and -66 for refused, and document each one in the dictionary. Consistency across waves matters more than the specific values.
Do I need a data dictionary if I use REDCap or another EDC system?
Yes. EDC platforms store metadata inside the project, but analysts receive exports, and large multidisciplinary projects still need standardized external structure for traceability and retrieval [10]. Export the definitions and version them with the data.
Can a data dictionary help with reproducibility?
Directly. It fixes variable definitions, enables automated validation, and, when versioned and released with the data and code, lets another researcher recreate your dataset exactly. Comprehensive documentation of data collection and analysis is the foundation of reproducible research in experimental biomedicine [2].
How often should I update the dictionary?
Update it whenever a definition, unit, allowed value, missing code, or instrument version changes, and assign a new version at each data release. Run your validation script on every update so the dictionary and the data never drift apart.
Sources
- The ICGC ARGO data dictionary for standardizing global cancer clinical data.
- Best practices for data management and sharing in experimental biomedical research.
- Mapping longitudinally consistent intrinsic connectivity networks in macaque brain via longitudinal sparse dictionary learning.
- Predicting the progression of mild cognitive impairment to Alzheimer's disease by longitudinal magnetic resonance imaging-based dictionary learning.
- A reproducible R workflow for harmonizing indoor air quality sensor data and cleaning activity logs in school-based field campaigns.
- Automated pipeline for operant behavior phenotyping for high-throughput data management, processing, and visualization.
- Addressing data management and analysis challenges in viral genomics: The Swiss HIV cohort study viral next generation sequencing database.
- The long way from raw data to NAM-based information: Overview on data layers and processing steps.
- IntegriLAB: a blockchain-enabled electronic lab notebook for reproducible neuroimaging research.
- An Automatic Data Extracting Method for REDCap Folder Mapping: An Example for Cardiological Clinical Case.
- A roadmap to artificial intelligence (AI): Methods for designing and building AI ready data to promote fairness.
- Meta-EEGs: A structured approach for processing high-volume EEG data.
- Social Media Insights Into US Mental Health During the COVID-19 Pandemic: Longitudinal Analysis of Twitter Data.
- Public Discourse Toward Older Drivers in Japan Using Social Media Data From 2010 to 2022: Longitudinal Analysis.
- Big data approaches to bovine bioacoustics: a FAIR-compliant dataset and scalable ML framework for precision livestock welfare.
- A Comprehensive Integrated Pipeline for Detection and Annotation of Variants in Whole Exome Sequencing Data.
- TRaP: An Open-source, Reproducible Framework for Raman Spectral Preprocessing across Heterogeneous Systems.
- MedicalDataHandler, a research-oriented graphical user interface for DICOM data management.