Literature Review Summary Table Template
By Dr. Zubair Khalid, DVM, MS, PhD ·

By the end of this guide you will have a working literature review summary table template built in a spreadsheet, a clear rule set for which columns to include, and a worked example you can copy. You need only three things on hand: a spreadsheet program such as Excel or Google Sheets, a citation manager such as Zotero or EndNote for reference data, and the list of studies you plan to screen. No paid software is required.
A summary table is the single most reused research template in the life sciences. Published reviews across medicine and biology depend on it, from scoping reviews that chart study characteristics in extraction tables [1][2] to diagnostic accuracy meta-analyses that rebuild 2 × 2 contingency tables for every included study [3][4][5]. The template below works for all of these.
What a Literature Review Summary Table Does
A literature review summary table is a structured grid in which each row is one study (or one source) and each column is a fixed attribute of that study. When filled in, the table lets you compare studies side by side, spot gaps in the evidence, and write your synthesis without rereading every paper.
The table serves three jobs at different stages of a review:
- During screening. It records why you included or excluded each record, which supports the flow diagram required by reporting standards such as PRISMA-ScR, the Preferred Reporting Items for Systematic Reviews and Meta-Analyses extension for Scoping Reviews [6][7][8].
- During data extraction. Review teams chart study information, methods, population data, and outcomes into the table. A recent scoping review of fluid balance after gastrointestinal surgery, for example, charted study information, methodology, monitoring methods, and outcomes into extraction tables before synthesis [1]. A scoping review of postpartum hypertension assessment developed and pilot-tested a data extraction tool before applying it to 96 included papers [9].
- During synthesis. The finished table becomes the descriptive summary readers see. Several published reviews present their findings exactly this way, as summary tables accompanied by narrative synthesis [10][9][11][12].
The vocabulary varies by tradition. Scoping reviews following the Joanna Briggs Institute (JBI) methodology call this process "data charting" [6][7][13]. Systematic reviews call it "data extraction." Narrative reviews may organize the material into author-curated taxonomy tables instead [14]. The underlying research template is the same: rows are sources, columns are attributes.
The Core Column Set
Start with a short core set of columns and add subject-specific columns only when your review question demands them. The table below lists the columns that appear in nearly every published summary table, why they matter, and an example entry.
| Column | What to record | Why it matters | Example entry |
|---|---|---|---|
| Study ID | Short code you assign (S01, S02) | Lets you refer to studies unambiguously in notes | S01 |
| Citation | Authors, year, journal | Anchor for the reference list | Gao and Chen 2026, Front Cell Infect Microbiol |
| Design | Study type | Determines what conclusions the study can support | Systematic review and meta-analysis |
| Setting and dates | Country, sites, search or recruitment window | Reveals geographic and temporal coverage | Five databases, inception to March 2026 |
| Population or sample | Who or what was studied, sample size | Basis for comparing applicability | 1,579 cases from 14 studies |
| Exposure, intervention, or index test | What was applied or measured | The central variable of your question | Shotgun metagenomic next-generation sequencing |
| Comparator or reference standard | What the index test was judged against | Required for accuracy and comparative questions | Conventional microbiological culture |
| Outcomes | What was measured, with units and timepoints | Prevents mixing incompatible endpoints | Pooled sensitivity and specificity with 95% CI |
| Key results | Numbers exactly as reported | Raw material for synthesis | Sensitivity 84.3% (95% CI 77.3 to 89.4%) |
| Quality appraisal | Tool used and verdict | Flags studies that may drive bias | QUADAS-2, high risk of bias in index test domain |
| Notes | Free text | Captures anomalies, missing data, queries | No reconstructable 2 × 2 table |
Two columns deserve extra explanation because they are frequent sources of error.
Effect estimates. Record the point estimate and its confidence interval as published. For a diagnostic accuracy review, the pooled numbers are the product of a bivariate random-effects model, sometimes called the Reitsma model, which models sensitivity and specificity jointly [3][4][15]. Write down which model produced each number, because a pooled sensitivity from a bivariate model is not interchangeable with a simple average across studies.
The 2 × 2 table. Diagnostic accuracy reviews pool data from four counts per study: true positives (TP), false positives (FP), false negatives (FN), and true negatives (TN). Sensitivity equals TP divided by (TP plus FN), and specificity equals TN divided by (TN plus FP). Many primary papers never print the four counts, so review teams reconstruct them from sensitivity, specificity, and sample size where possible [4][5]. When reconstruction is impossible, the study simply cannot enter the pooled analysis, which is exactly what happened in a review of automated micronucleus detection where no included study reported a reconstructable 2 × 2 table and the authors fell back on descriptive pooling of scalar metrics [16]. Add a column flagging whether your counts were "reported," "reconstructed," or "unavailable."
Building the Template Step by Step
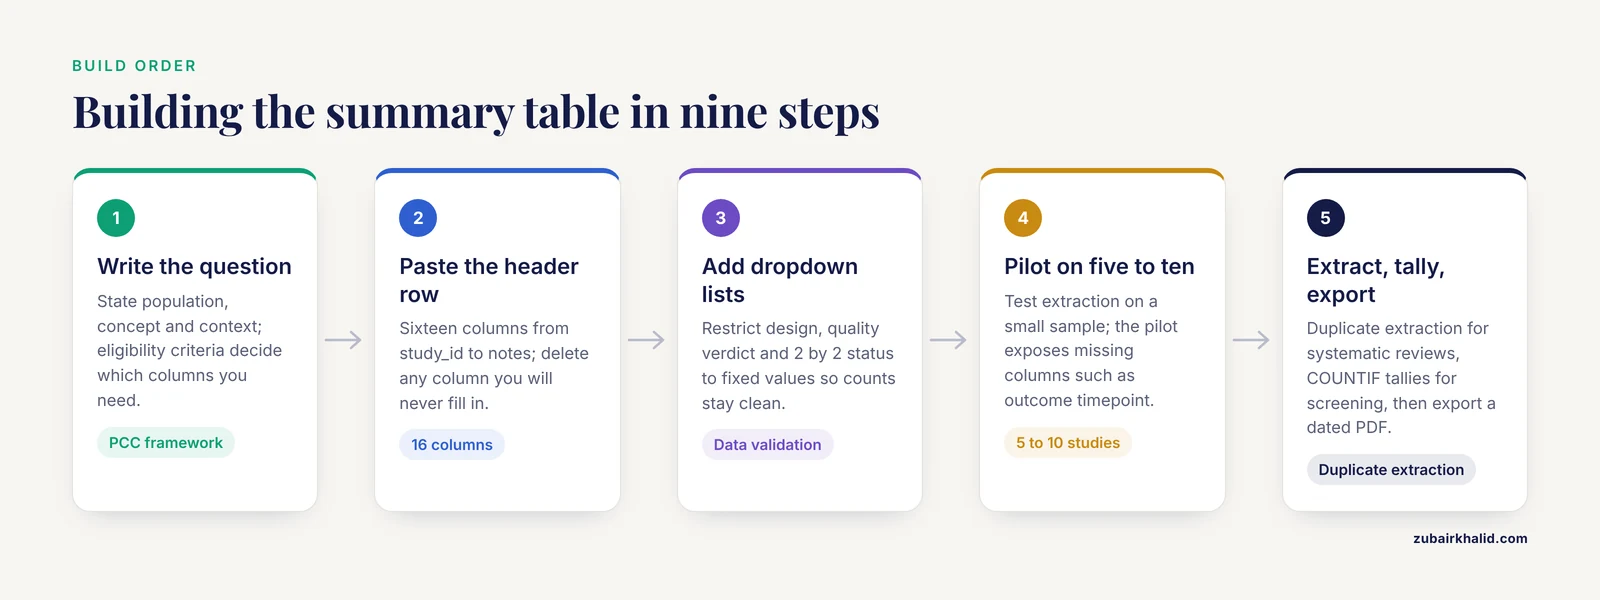
This walkthrough builds a working summary table in Google Sheets or Excel. The same steps apply to any spreadsheet.
Step 1. Define your review question and eligibility criteria
Before touching the spreadsheet, write one sentence stating the population, concept, and context of your review. Scoping reviews following JBI methodology commonly use the PCC framework (Population, Concept, Context) to anchor eligibility [6][7]. Eligibility criteria determine your columns. If your question compares an index test against a reference standard, you need index test and reference standard columns plus the four 2 × 2 counts. If your question maps interventions, you need intervention components, timing, and intensity columns instead, in the way a scoping review of rehabilitation after lower-limb revascularization charted exercise modality, timing of initiation, intensity, and supervision [8].
Step 2. Create the header row
Open a new sheet and paste this header row. The first cell is A1.
study_id,citation,year,country_setting,design,population,sample_n,intervention_or_index_test,comparator_or_reference_standard,outcomes,key_results,quality_tool,quality_verdict,twobytwo_status,effect_measure,notesSixteen columns cover most life science reviews. Delete what you will never fill in. Every column you keep must earn its place, because an overwide table becomes unreadable in a manuscript.
Step 3. Add dropdown validation for fixed categories
Columns such as design, quality verdict, and 2 × 2 status should accept only a small set of values. In Google Sheets, select the design column range, open Data, then Data validation, and add a list of items. In Excel, use Data, then Data Validation, then List. A sensible list for a review that mixes evidence types:
RCT, cohort, case-control, cross-sectional, case report, case series, systematic review, scoping review, narrative review, guidelineFor the 2 × 2 status column, use:
reported, reconstructed, unavailable, not applicableDropdowns keep your later pivot tables clean. Free text entries like "case report." and "case-report" will fragment any count you attempt.
Step 4. Pilot the template on five to ten studies
Test the template on a small sample before committing. The postpartum hypertension scoping review pilot-tested its data extraction tool before full deployment [9], and a terminology scoping review piloted its search strategy in one database before expanding across eight databases [13]. Pilot extraction exposes missing columns early. A typical discovery: you need a column for the outcome timepoint, because a study reporting sensitivity at 6 weeks and 6 months cannot share a row.
Step 5. Extract in duplicate for systematic reviews
If your review is systematic or a meta-analysis, have two people independently screen and extract, then reconcile. This is the standard practice reported across recent reviews, where screening, extraction, and risk of bias assessment were performed independently in duplicate [3][4]. Assign a third person as arbiter for disagreements.
Step 6. Add calculated columns for diagnostic accuracy data
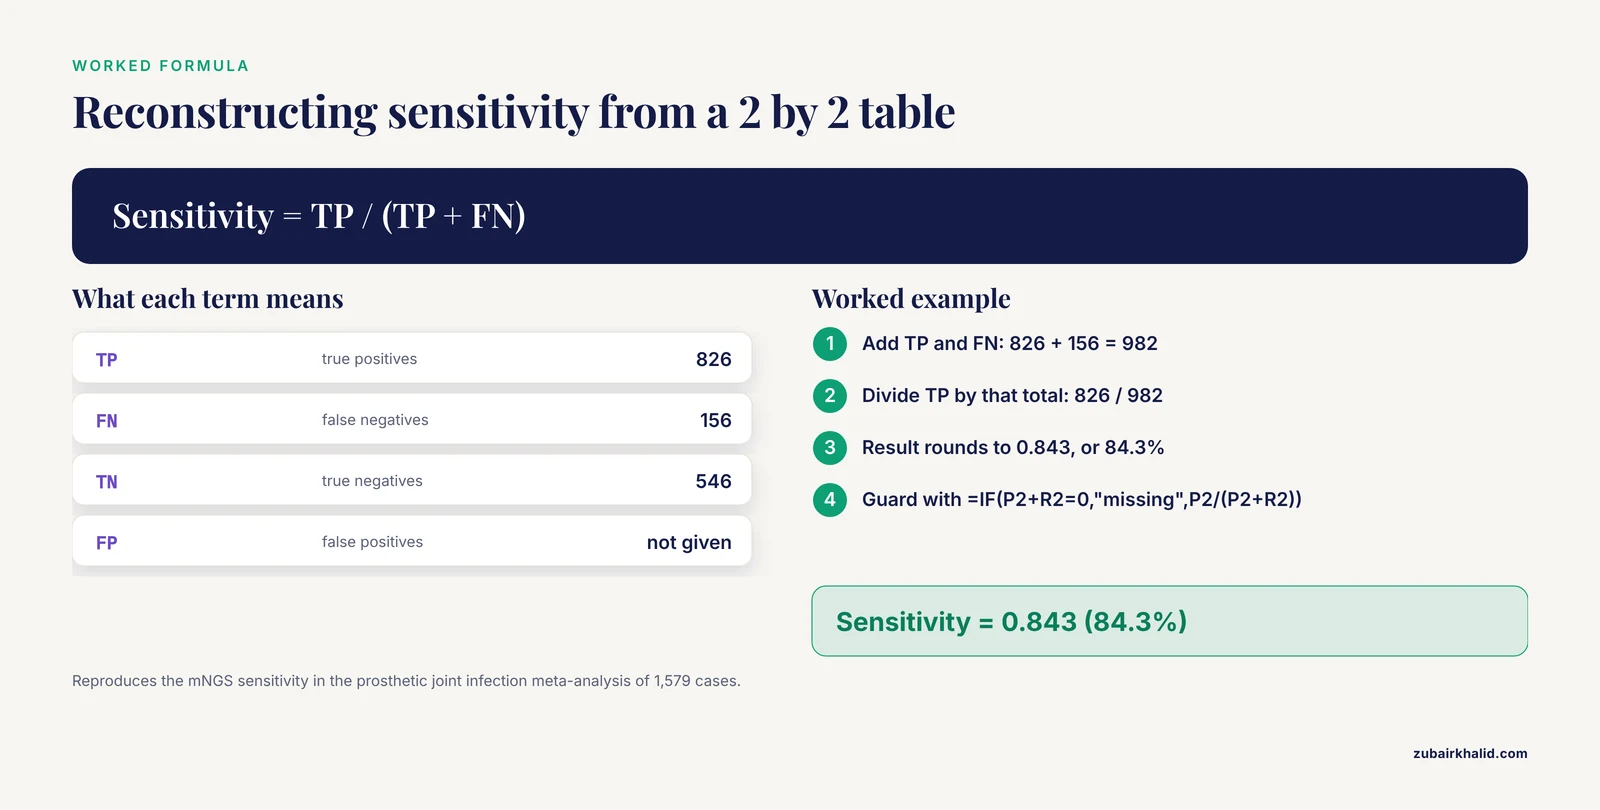
If you reconstruct 2 × 2 tables, add four count columns and two formula columns. Suppose TP is in column P, FP in Q, FN in R, and TN in S, starting at row 2.
Sensitivity (T2):  =P2/(P2+R2)
Specificity  (U2): =S2/(S2+Q2)
Guard against division by zero with a conditional:
=IF(P2+R2=0,"missing",P2/(P2+R2))A completed row might read TP = 826, FN = 156, TN = 546, TN denominator checks out, and the sheet computes sensitivity 0.843 and specificity 0.915, which reproduces the mNGS figures reported in the prosthetic joint infection meta-analysis of 1,579 cases [15]. Verify your reconstruction against any published counts before trusting it.
Step 7. Tally screening decisions with COUNTIF
To build the numbers for your PRISMA flow diagram, count records by status. If screening status sits in column V:
=COUNTIF(V2:V2000,"included")
=COUNTIF(V2:V2000,"excluded - wrong population")
A scoping review of postpartum hypertension screened 14,593 records down to 96 included papers [9], and each of those numbers must be traceable to a logged decision. Your COUNTIF tallies supply them.
Step 8. Synthesize from the table, not from memory
Use a pivot table to summarize categorical columns. For a scoping review of therapeutic apheresis in severe immune-related adverse events, the authors summarized 34 articles covering 42 patients and could have pivoted on indication, since the main indications were neurological at 40.6%, overlap manifestations at 23.8%, and hepatitis at 21.4% [10]. A pivot on your indication column would produce that distribution automatically.
Step 9. Export a printable copy
Once the table is stable, use File, then Download, then PDF in Google Sheets (or Save As PDF in Excel) to produce a print version. Many students keep this printed beside a lab notebook template pdf they already use for bench work, so the same one-document-per-project habit covers both wet-lab records and literature notes. Mark the PDF with a version date, because the table will change.
A Worked Example
Here is the template in use, with rows drawn from four published reviews. In your own table the citation column would carry full references.
| Study ID | Design | Population | Focus | Key results |
|---|---|---|---|---|
| S01 [5] | Systematic review and meta-analysis | 1,027 validation patients across 11 studies | Deep learning on ultrasound for breast cancer axillary nodal status | Pooled sensitivity 0.75 (95% CI 0.66 to 0.81), specificity 0.89 (95% CI 0.83 to 0.93) |
| S02 [15] | Systematic review and meta-analysis | 1,579 cases across 14 studies | Metagenomic next-generation sequencing vs culture in prosthetic joint infection | mNGS sensitivity 84.3%, specificity 91.5%, SROC AUC 0.941 |
| S03 [10] | Scoping review | 42 patients across 34 articles | Therapeutic apheresis for severe immune-related adverse events | Main indications neurological 40.6%, overlap 23.8%, hepatitis 21.4% |
| S04 [11] | Scoping review | 13 studies from 5,007 unique records | Economic evaluations of workplace physical exercise | 9 of 13 included studies were randomized controlled trials |
Notice how each row answers the same questions in the same order. That uniformity is what turns 40 separate papers into one arguable claim.
Adapting the Template to Your Review Type
Scoping reviews
Scoping reviews map the extent, range, and nature of a literature rather than pooling effect sizes. Follow the JBI methodology for scoping reviews and plan to report under PRISMA-ScR [6][7][17][13][8]. Your summary table should emphasize mapping columns: definitions used, settings, populations, and the frameworks or classifications each source applied. The Arksey and O'Malley methodological framework, used in a scoping review of persistent postpartum hypertension, pairs well with a table-based descriptive synthesis [9]. Expect heterogeneity and resist forcing incompatible studies into one metric.
Systematic reviews with meta-analysis
When studies share a comparable effect measure, add columns for the estimate, its confidence interval, and the weight it would carry. For diagnostic test accuracy reviews, follow PRISMA-DTA reporting, use QUADAS-2 for risk of bias, and pool with a bivariate random-effects model when four or more studies share a target condition [3]. A review of IVIM MRI for IDH mutation status in glioma illustrates the discipline required: 13 studies, QUADAS-2 assessment, GRADE certainty ratings, and explicit flags that all studies carried high index test risk of bias because thresholds were selected after the fact [4]. That threshold detail belongs in its own column.
Narrative reviews
Narrative reviews tolerate more author judgment in how evidence is organized. A review of diluted calcium hydroxylapatite built a preparation taxonomy table, an anatomy-based injection map table, and a combination-treatment table, each curated by the authors to impose order on heterogeneous protocols [14]. If your evidence resists uniform columns, consider several smaller tables organized by theme rather than one oversized grid.
Literature Review Summary Table Template Tips
- One row per study-cohort, not per paper. If one paper reports two independent cohorts, give each cohort its own row and say so in the notes column. A breast cancer ultrasound review applying one prespecified hierarchy to select a single cohort per study shows the alternative, and both approaches are legitimate if documented [5].
- Record thresholds and definitions verbatim. Post hoc threshold selection was the dominant source of risk of bias in a glioma imaging meta-analysis [4], and metric definition was the dominant moderator of heterogeneity in an automated micronucleus review [16]. A column for "outcome definition or threshold" pays for itself.
- Capture heterogeneity moderators as columns. Dataset size, class imbalance, and validation design influenced pooled performance in an AI urolithiasis review [18], and imaging modality tracked residual variation in precision in a micronucleus review [16]. If you suspect a moderator, give it a column and your meta-regression or subgroup plan becomes trivial.
- Note the search window on the template itself. Reviews searched "inception to 31 March 2026" [3], "through 24 August 2026" [5], and "January 2000 to March 2025" [11]. Put the window and the databases in a header block above row 1 so the table is self-documenting.
- Keep your reference manager and table linked. Export citations from Zotero or EndNote in a format that pastes cleanly, and keep the study ID column synchronized with your reference manager tags.
- Log extraction queries. When a paper reports an unclear number, add a dated note in the notes column and email the authors if the protocol allows. The note trail is what you show a supervisor or peer reviewer.
Common Mistakes and Limitations
- Transcribing numbers without their uncertainty. A pooled sensitivity of 0.75 means little without its 95% CI of 0.66 to 0.81, and even less without its 95% prediction interval of 0.50 to 0.90, which signals how widely a new study might perform [5]. Always carry the interval.
- Mixing timepoints and outcome definitions in one column. A postpartum blood pressure study assessed at day 3 is not the same observation as one assessed at 6 months. Separate rows or a timepoint column prevents the error.
- Silently dropping unextractable studies. If a study cannot yield a 2 × 2 table, record "unavailable" rather than omitting the row, because reviewers and readers need to know how many studies fell out of pooling and why [16].
- Building 40 columns before the pilot. Wide templates slow extraction and increase error. Pilot first, then add columns only for variables you will actually synthesize.
- Treating the table as the synthesis. The table presents data, but interpretation still requires narrative synthesis. Several reviews pair summary tables with an inductive or thematic narrative [2][12]. The table never writes your discussion for you.
- Copying a colleague's template without adapting the columns. A template built for a therapeutic intervention review will lack the reference standard and 2 × 2 columns a diagnostic accuracy review needs [3][15].
- Assuming pooled numbers transfer to any clinical setting. Substantial heterogeneity marked several pooled estimates as descriptive rather than decisive, with certainty rated low or very low by GRADE in one imaging review [4] and high risk of bias in most studies of another [18]. Read the certainty ratings before repeating a headline number.
- Forgetting that methods decisions are protocol decisions. Whether to allow one cohort per study, whether to contact authors, and which appraisal tool to use should be fixed in your written protocol before extraction begins, not improvised row by row.
One general limitation applies: the right column set and synthesis method depend on your specific review question and protocol, and methodological choices for a formal review should be confirmed with your supervisor, librarian, or statistician before you commit months of extraction work.
Frequently Asked Questions
What columns should a literature review summary table include?
Start with study ID, citation, year, setting, design, population, sample size, intervention or index test, comparator or reference standard, outcomes, key results with confidence intervals, quality appraisal, and notes. Add subject-specific columns only after a pilot extraction shows you need them.
How is a summary table different from a data extraction form?
They are often the same document. Data extraction forms collect raw study details during screening and extraction, while the summary table is the polished version that appears in your manuscript. Building one spreadsheet that serves both, with a polished reporting sheet referencing the raw sheet, avoids duplicate work.
How many studies should I pilot the template on?
Five to ten studies covering the range of designs you expect is a practical pilot. Published review teams pilot-tested their extraction tools before full-scale charting, and the pilot routinely reveals missing columns such as outcome timepoint or threshold definition [9].
What is a 2 × 2 table and when do I need one?
A 2 × 2 table cross-tabulates a diagnostic test result (positive or negative) against the reference standard result (disease present or absent), giving four counts: true positives, false positives, false negatives, and true negatives. You need it whenever your review addresses diagnostic accuracy, because sensitivity and specificity are calculated directly from those counts [3][15].
Can I use Excel or Google Sheets, or do I need special software?
A spreadsheet is sufficient for coursework reviews and small systematic reviews. Dropdown validation, COUNTIF tallies, and pivot tables cover screening documentation and descriptive synthesis. Larger teams and meta-analyses typically add reference managers and statistical software for the pooling step, but the summary table itself remains a spreadsheet.
How do I handle studies that report several outcome timepoints?
Give each timepoint its own row, tagged with a timepoint column, or give each timepoint its own result subcolumns within the study row. Choose one convention before extraction starts and apply it to every study, because mixed conventions are the fastest way to corrupt a synthesis.
How do I make a printable version of the table?
Finalize the columns, freeze the header row, set print area and landscape orientation, then export to PDF from Excel or Google Sheets. Many researchers file this PDF alongside a lab notebook template pdf so that bench records and literature records follow the same print-and-archive habit.
Do I need to cite the summary table in my manuscript?
You cite the studies listed in the table, not the table itself. Number the rows so each study links to a reference, and state in your methods that data were charted into a structured extraction table, which is how published scoping and systematic reviews describe the practice [10][1].
Sources
- The Association Between Postoperative Fluid Balance and Postoperative Complications in Adults Undergoing Gastrointestinal Surgery: Protocol for a Scoping Review.
- First Contact Physiotherapists (FCPs) Referral Practices to Rheumatology: A Scoping Review of the Evidence Base.
- Diagnostic Accuracy of Artificial Intelligence-Based Electrocardiography for the Detection of Heart Diseases: A Systematic Review and Meta-Analysis.
- Intravoxel incoherent motion (IVIM) MRI for predicting IDH mutation status in adult diffuse glioma: a systematic review and diagnostic test accuracy meta-analysis.
- Diagnostic performance of deep learning models using ultrasound for preoperative axillary nodal status in breast cancer: a systematic review and meta-analysis.
- Patient-perspective evidence on the acceptability, usability, and everyday impact of relative motion orthoses in adult hand rehabilitation: A scoping review protocol.
- Pharmacological and Nonpharmacological Interventions to Address Insomnia Symptoms and Poor Sleep Quality Among People With HIV: Protocol for a Scoping Review.
- Exercise-Based Rehabilitation Following Lower-Limb Revascularisation in Patients with Peripheral Arterial Disease: A Scoping Review.
- Assessment of Persistent Postpartum Hypertension Following Hypertensive Disorders of Pregnancy: A Scoping Review.
- The Place of Therapeutic Apheresis in Severe Immune-Related Adverse Events: A Scoping Review of Literature.
- Economic Evaluations of Physical Exercise at Work: A Scoping Review.
- The associations between job stress and physical and mental health in firefighters: a systematic review.
- Terminology for "Elder Orphans" and Aging Well: Protocol for a Scoping Review.
- Diluted and Hyperdiluted Calcium Hydroxylapatite/Carboxymethylcellulose as a Technique Platform: A Narrative Review with Practical Taxonomy, Injection Mapping, and Safety.
- Diagnostic accuracy and clinical considerations of metagenomic next-generation sequencing in prosthetic joint infection: a systematic review and meta-analysis.
- AI-Assisted Micronucleus Detection: A Critical Systematic Review With Quantitative Synthesis.
- Mapping the Evidence on Vitamin D, Vitamin B12, and Folate Deficiencies and Their Potential Impact on Treatment Outcomes in Patients With Cancer in Sub-Saharan Africa: Protocol for a Scoping Review.
- Too good to be true? AI performance in CT-based urinary stone detection and classification: EAU endourology systematic review and diagnostic accuracy meta-analysis.