How to Spot Causal Overreach in Research Papers
By Dr. Zubair Khalid, DVM, MS, PhD ·

Causal overreach happens when a paper describes an association between two things as if one causes the other, and the design of the study cannot support that claim. It is the single most common serious error in how research findings are summarized, and it usually starts in one place. The most likely cause is a mismatch between the study design and the language of the abstract. Researchers run an observational study, collect cross-sectional or survey data, find a correlation, and then write "X reduces Y" or "X increases the risk of Y" in the abstract, the press release, and the final sentence of the discussion. The results section is usually more careful than the framing around it.
The first thing to check when you read research paper abstracts is the study design, not the conclusion. Scan the methods for a few load-bearing words. "Randomized" means participants were assigned to groups by chance, which is the strongest standard evidence for causation in a single study. "Prospective cohort" means people were followed forward in time, which supports temporal ordering but not automatically causation. "Cross-sectional" means everything was measured at one point in time, which makes causal language almost impossible to justify. If the design is observational and the abstract uses verbs like "causes," "prevents," "protects," or "improves," you have found causal overreach, and the rest of your reading is about judging how severe it is.
This guide walks through the causes of causal overreach, a diagnostic sequence you can follow every time you read a paper, a troubleshooting table for the specific patterns you will encounter, and practical solutions for writers, reviewers, and students who need to correct overreach after it happens.
Why Causal Overreach Happens
Causal overreach is rarely fraud. It is usually the product of ordinary incentives and habits. Understanding the causes makes the problem easier to spot, because each cause leaves a recognizable fingerprint in the paper.
Pressure to state a takeaway. Journals, funders, journalists, and hiring committees reward clear claims. A sentence like "coffee consumption is associated with a modestly lower risk of liver fibrosis in this cohort" is accurate but forgettable. "Coffee protects the liver" travels further. Many authors drift toward the second version without noticing the gap between the two.
Abstracts are written last and read first. Abstracts are often drafted under word limits, sometimes at the end of a long submission process, and they are the only part of the paper most readers, journalists, and even some citing authors ever see. Compression strips the qualifiers.
Statistical software makes causal language feel automatic. A regression model returns a coefficient, a p-value, and a confidence interval. The output looks identical whether the exposure was randomized by a computer or merely self-reported on a questionnaire. The tool does not know the difference. The writer has to supply that judgment, and the tool creates a false sense of objectivity that tempts writers to skip it.
Confusing adjustment with causation. Many authors believe that including confounding variables in a regression model fixes the causal interpretation problem. Adjustment helps, sometimes a great deal, but it can only control for the confounders you measured and measured correctly. It does nothing for unmeasured confounding, and it can even introduce new bias when the wrong variables are adjusted.
Incentives at the journal level. Findings that sound causal get more attention, more citations, and more coverage. Reviewers who flag overreach are doing unpaid work. The system tolerates a certain amount of overreach, so a careful reader cannot outsource this judgment to peer review.
How to Read Scientific Papers for Causal Claims
Most people who read research paper text for the first time start at the beginning and try to absorb everything. That approach makes causal overreach hard to see, because the overreach hides in the contrast between two sections you read several minutes apart. A targeted sequence works better. Here is a five-step diagnostic you can run on any paper in about ten minutes.
Step 1. Read the abstract and mark every causal verb
Write down every claim the abstract makes. Circle the verbs. "Is associated with," "is linked to," and "correlates with" are association language. "Causes," "reduces," "increases the risk of," "protects against," "prevents," "improves," and "leads to" are causal language. You are not judging yet. You are building a list of claims to test against the methods.
Step 2. Find the design sentence in the methods
Every paper has one or two sentences that reveal the design. Look for the words randomized, blinded, placebo-controlled, prospective, retrospective, cross-sectional, case-control, nested, matched, in vitro, in vivo, or animal model. Write the design down in one line. "Randomized double-blind placebo-controlled trial of 240 adults over 12 weeks" and "cross-sectional survey of 240 adults at a single time point" can describe similar-sized studies with completely different causal weight.
Step 3. Compare the claim list to the design
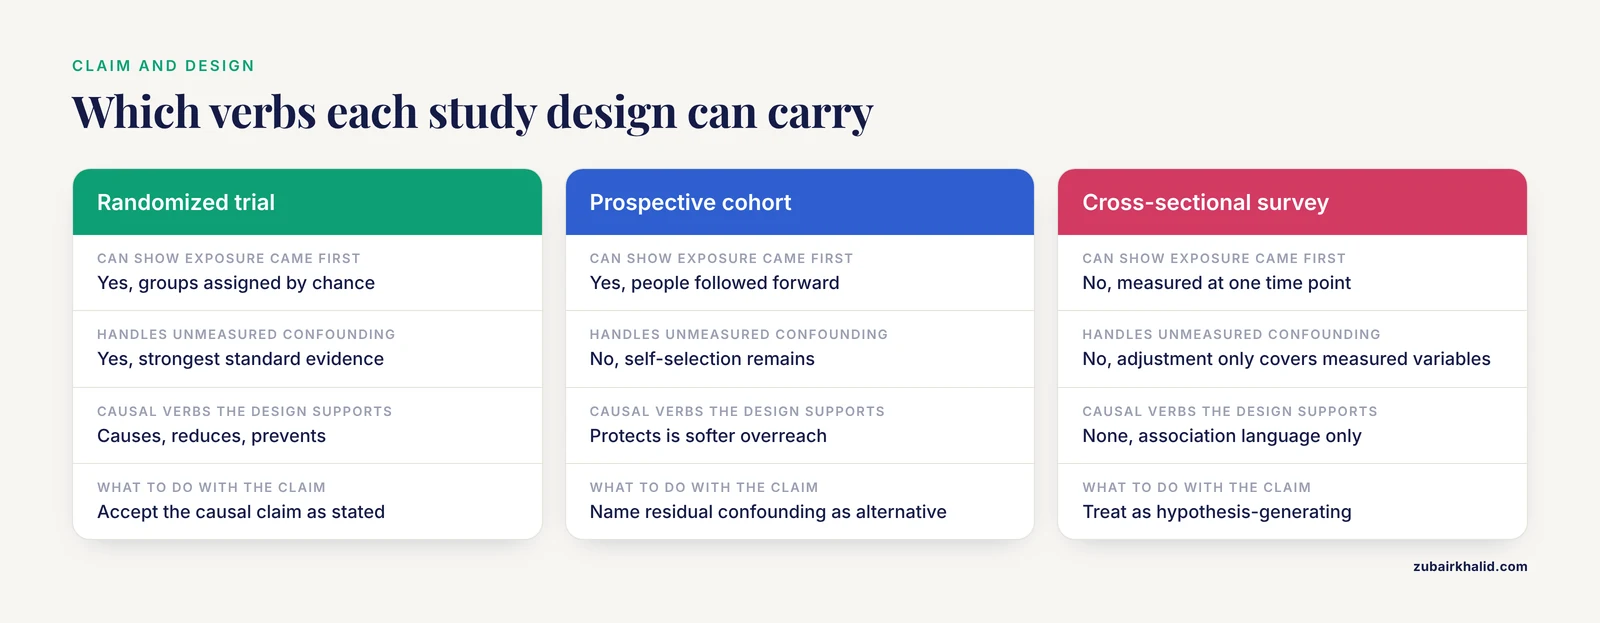
This is where overreach becomes visible. If the design is cross-sectional and the abstract says a behavior "reduces" a disease risk, that is overreach. A cross-sectional study measures the exposure and the outcome at the same moment, so it cannot even establish that the exposure came first. If the design is a prospective cohort and the abstract says "protects," that is softer overreach. Cohorts can show temporal ordering, but self-selection into exposure groups still leaves room for confounding.
Step 4. Open the results and check three numbers
For the headline association, find the effect size, its confidence interval, and the p-value. In a cohort study the effect size is often a hazard ratio or relative risk. In a case-control study it is an odds ratio. A relative risk of 1.05 means a 5 percent difference in risk between groups, which is easy to produce with small amounts of confounding even after adjustment. A relative risk of 3.0 is harder to explain away with confounding, although never impossible. Also check the sample size and how many secondary analyses the paper reports. A headline finding buried at analysis number twelve deserves suspicion.
Step 5. Compare the discussion's first and last paragraphs
The first paragraph of a discussion usually restates the findings honestly. The last paragraph usually states the implication, and this is where overreach concentrates. Sentences beginning "These findings suggest that" followed by a recommendation for practice or policy deserve the closest reading. Then check the limitations paragraph. Honest authors name their design's weaknesses there. If the limitations section says residual confounding is possible but the abstract claims protection, the paper disagrees with itself, and the abstract usually wins in the eyes of readers and journalists.
Run this sequence on every paper you evaluate seriously. With practice it takes minutes, and it catches the majority of overreach without needing any statistical software.
Troubleshooting Table: Symptoms, Causes, and Fixes
Use this table when you have found something suspicious but cannot name it yet. Each row pairs a symptom in the text with its likely cause, a way to confirm it, and the fix, either your own reading fix or the fix you would recommend to the authors.
| Symptom in the paper | Likely cause | How to confirm | Fix |
|---|---|---|---|
| Abstract says "X reduces Y" but methods say "cross-sectional survey" | Temporal ordering problem, no design basis for causation | Check whether exposure and outcome were measured at the same visit | Reword to "is associated with," treat the claim as hypothesis-generating |
| Large observational effect quoted causally in the media, modest effect in the tables | Confounding by lifestyle factors correlated with the exposure | Compare effect size before and after adjustment for smoking, income, and activity, a small change signals fragile confounding control | Report the adjusted effect size with its confidence interval, drop causal verbs |
| The exposure could plausibly be a result of the outcome, for example low activity in people with early undiagnosed disease | Reverse causation | Check whether participants with symptoms at baseline were excluded, check follow-up length | Look for a lagged analysis or an analysis excluding early events, otherwise downgrade the claim |
| The association appears only after adjustment, or only in one subgroup | Overfitting or subgroup fishing | Count how many models and subgroups were tested, check whether subgroup analysis was pre-specified | Rely only on pre-specified analyses, require replication in an independent cohort |
| Dozens of associations reported, most of them marginal | Multiple comparisons inflating false positives | Look for a statement of correction for multiple testing or a pre-registration link | Treat uncorrected exploratory findings as untested hypotheses |
| The sample is hospital patients or volunteers, but the conclusion is about the general population | Selection bias and collider bias | Compare the sample's characteristics to the target population | Reword the conclusion to name the sampled population |
| Cell culture or animal results phrased as effects in humans | Translational overreach | Check whether any human data appear in the paper | Reword to "in a mouse model of" or "in vitro," wait for human evidence |
| Two population averages correlated, for example national chocolate consumption and national prize counts | Ecological fallacy, individuals may behave differently than countries | Check whether the unit of analysis is individuals or groups | Demand individual-level data before believing the claim |
| The paper cites a chain of citations for a causal claim, but no study in the chain tested it directly | Citation drift, a speculation repeated until it sounds established | Trace the claim back at least two levels to the original study | Flag the claim as unsupported, find the primary evidence yourself |
| A p-value near 0.05 is described as proving the mechanism | Misreading what a p-value means | Check whether the p-value comes from a test of association or a direct test of the causal pathway | State the p-value as evidence against the null hypothesis only |
The Main Failure Modes, From Most Common to Rarest
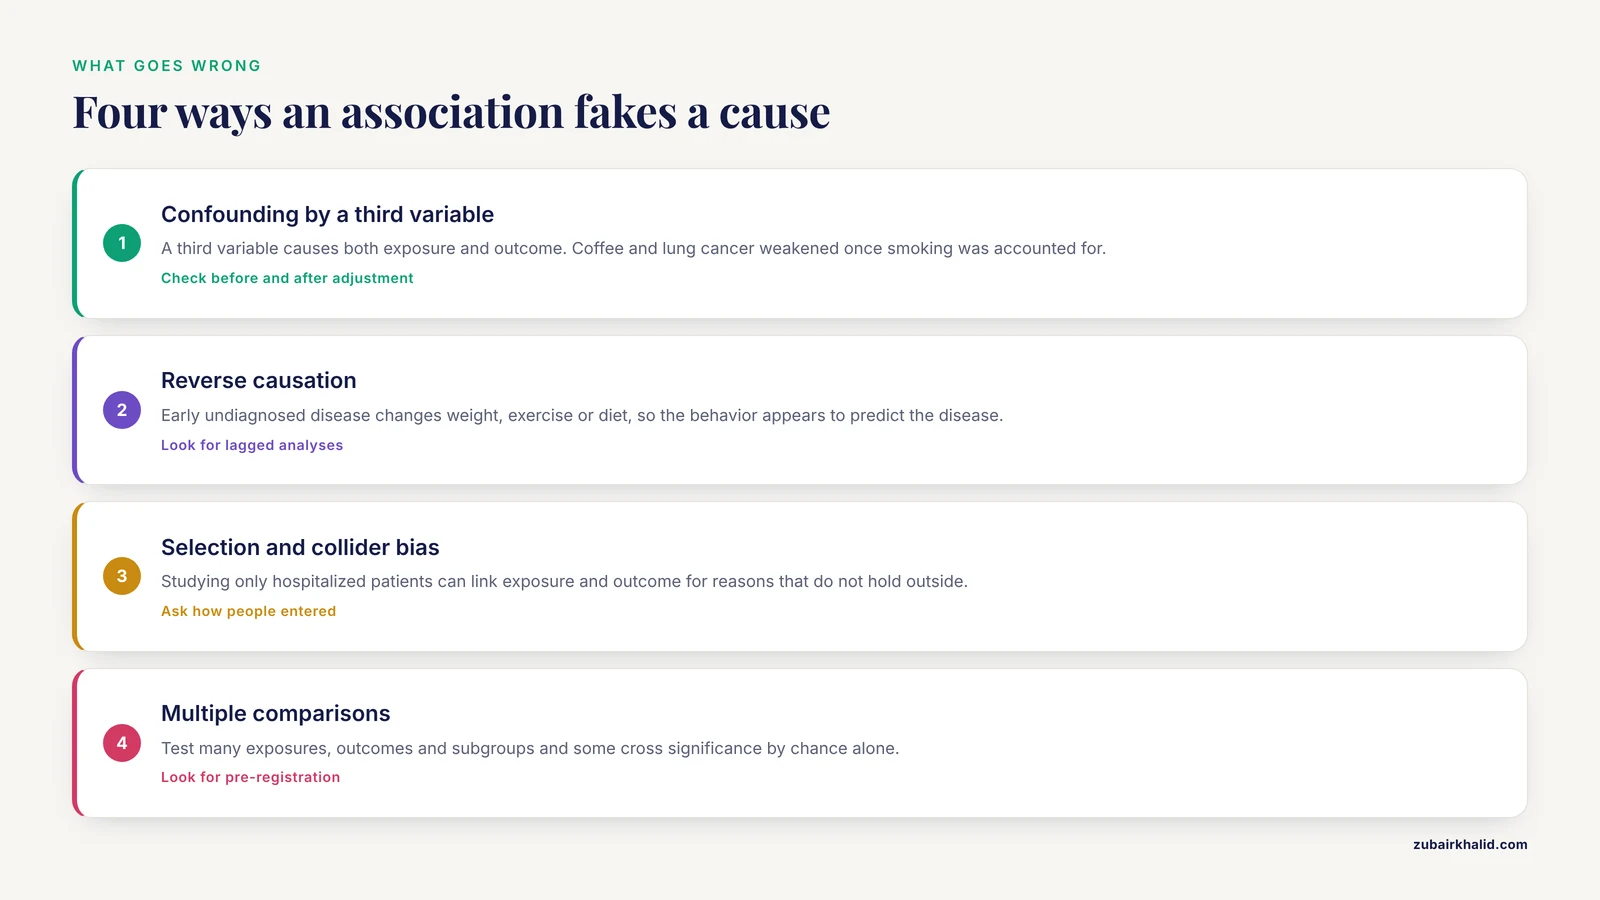
Each mechanism behind causal overreach has a characteristic logic. Learning the mechanisms turns the troubleshooting table from a checklist into an understanding you can apply to papers that have not been written yet.
Confounding
Confounding is the most common cause of spurious associations in observational research. A third variable causes both the exposure and the outcome, creating a correlation between the two with no direct causal link between them. The classic example is the early observation that coffee drinking was associated with lung cancer, which weakened once researchers accounted for smoking, because coffee drinkers in those cohorts smoked more. Modern confounders are subtler. People who take a supplement tend to be wealthier, more health-conscious, more likely to exercise, and more likely to see doctors, all of which independently affect health outcomes. This pattern is so reliable that epidemiologists call it the healthy user effect.
Adjustment in a regression model is the standard partial fix. Its weakness is worth internalizing. Adjustment can only remove confounding from variables that were measured and modeled correctly. Residual confounding, the part left over from imperfect measurement and unmeasured variables, is why careful observational research still uses cautious language.
Reverse causation
In reverse causation, the outcome influences the exposure rather than the other way around. A person with early, undiagnosed disease may lose weight, reduce exercise, or change diet, and a study measuring those behaviors afterward will find that the behavior "predicts" the disease when the disease actually drove the behavior. Reverse causation is especially dangerous in prospective cohorts with short follow-up. The standard fixes are excluding early events, meaning the first year or two of diagnoses after baseline, and running lagged analyses. When you read a paper, check whether either was done.
Selection bias and collider bias
Selection bias enters when the way people enter the study is related to both the exposure and the outcome. Studying only hospitalized patients is the classic setup. Hospitalization can be caused by the exposure, for example an injury, and by the outcome, so within the hospital sample the exposure and outcome can appear linked, or appear unlinked, for reasons that do not hold outside the hospital. A variable influenced by two other variables and then conditioned on is called a collider, and conditioning on a collider can manufacture associations from nothing. You can confirm this failure mode by asking one question. How did people end up in this sample, and could that path depend on the exposure or the outcome?
Multiple comparisons and exploratory analyses
Every statistical test carries a chance of a false positive. Test many exposures, many outcomes, many subgroups, and many model specifications, and some associations will cross the conventional significance threshold by chance alone. The symptom is a paper reporting a long table of associations with one or two flagged as significant. The fixes are pre-registration, meaning the analysis plan was posted publicly before the data were examined, correction for multiple testing, and independent replication. None of these are optional decorations. A claim that survives none of them is best treated as exploratory regardless of its p-value.
Regression to the mean and natural history
When people are selected for a study because of an extreme value, for example very high blood pressure, their next measurement will tend to be closer to average even if nothing intervened. Studies without a proper control group mistake this drift for a treatment effect. The same trap catches studies that follow an untreated condition that would have improved on its own. Confirm by looking for a concurrent control group that was measured over the same period.
Publication bias
Studies that find an effect are more likely to be published than studies that find nothing. When you read a literature, you see the successes, so a causal story can feel well supported when the total evidence is actually weak or mixed. The symptom appears when you gather five papers on a topic and all five report positive findings with similar designs. Symmetry tests on collections of studies exist, but a practical reading habit, seeking out null results and registered reports on the topic, catches most of it.
Ecological fallacy
Ecological studies use groups, usually countries or regions, as their units of analysis. An association between group averages can vanish or reverse at the individual level, because the people within each group who consume the exposure are not the people who experience the outcome. Population-level correlations are useful for generating hypotheses and dangerous as evidence about individuals.
Translational overreach
Findings in cell cultures and animal models are legitimately causal within their own systems. Overreach appears when the discussion paragraph converts "reduces marker phosphorylation in cultured cells" into "this nutrient fights the disease." A mechanism demonstrated in a dish is a hypothesis about humans, and the history of biomedicine is full of mechanisms that failed the translation. The rarest and most subtle version appears even in human studies, when a paper shows that an intervention changes a biomarker and then asserts that the biomarker change causes the clinical benefit. Surrogate endpoints sometimes track the real outcome and sometimes do not, and the paper needs direct evidence to bridge that gap.
When Correlation Implies Causation
Correlation never proves causation by itself, but the reverse mistake also exists. Some readers conclude that observational evidence tells us nothing, which is false. The practical question is when correlation implies causation strongly enough to act on, and the standard framework for that judgment is the set of considerations proposed by the epidemiologist Austin Bradford Hill, usually called the Bradford Hill viewpoints. They are not a checklist where enough boxes get ticked. They are questions that sharpen judgment.
Temporality. The cause must precede the effect. This is the only strictly necessary consideration, and only longitudinal designs can establish it.
Strength of association. Large effect sizes are harder to explain away by confounding than small ones. A relative risk near 1.0, for example 1.05, should make you look for confounding first.
Consistency. The same association should appear across different populations, designs, and research groups. One cohort finding is a proposal. The same finding in several independent cohorts is evidence.
Dose-response gradient. If risk changes in step with the level of exposure, the causal story becomes more plausible, because a confounder would need to track the exposure with fine precision to fake a gradient.
Plausibility and coherence. The association should fit known biology, and it should not contradict firm evidence from other lines of research.
Experiment. If removing the exposure changes the outcome, as happens when a harmful exposure declines and the disease declines with it, the causal case strengthens greatly.
Specificity and analogy. These considerations weigh less in modern epidemiology, because many genuine causes have broad effects and many analogies mislead, but they can still inform judgment.
Alongside these viewpoints, modern epidemiology adds triangulation, which means converging evidence from methods with different weaknesses. A randomized trial, a Mendelian randomization analysis, a large prospective cohort, and a biologically grounded mechanism pointing the same way carry far more weight than any single design, because their failure modes differ. Mendelian randomization deserves a short note here. It uses genetic variants as proxies for an exposure, exploiting the essentially random allocation of alleles at conception, which makes confounding far less likely. It is one of the stronger tools available when a randomized trial is impossible, though it has its own assumptions and failure modes, so treat it as one line of evidence rather than a verdict.
How to Fix Causal Overreach in a Manuscript
If you are a peer reviewer, a co-author, an editor, or a student who has spotted overreach in a draft, concrete solutions exist. Causal overreach is fixable with language and analysis, and most authors accept the fix once it is framed as precision rather than criticism.
Fix the verbs first. The cheapest and highest-impact correction is vocabulary. Replace "X reduces Y" with "X is associated with lower Y" throughout the abstract, discussion, and title. Reserve causal verbs for randomized experiments or for observational designs with explicit causal identification strategies. This one edit removes most of the harm, because the abstract is what spreads.
State the estimand. Ask the authors to write one sentence naming exactly what they estimated in which population. Vagueness is what allows a modest association to drift into a sweeping claim.
Match the discussion to the design. A cross-sectional study's discussion should say the design cannot establish temporality. A cohort study's discussion should name residual confounding as the leading alternative explanation. If the limitations paragraph and the final sentence contradict each other, flag the final sentence.
Recommend quantitative bias analysis. For observational findings that matter, sensitivity analysis can estimate how strong an unmeasured confounder would need to be to explain away the observed association. If a modest association collapses under a plausible confounder, that fact belongs in the paper. Some journals now ask for this routinely.
Point to pre-registration and replication as the path forward. The solution to an exploratory finding is not silence but a registered, confirmatory analysis in an independent dataset. Suggest it explicitly.
For journalists and communicators, apply the design test to headlines. The abstract's verbs decide the headline. If the abstract says "associated with," the headline should not say "causes."
Common Mistakes and Limitations
Readers new to critical appraisal make predictable errors when hunting for causal overreach. Knowing them keeps your own analysis honest.
Confusing statistical significance with causal strength. A p-value measures how surprising the data would be under a null hypothesis of no association. It says nothing about whether the association is causal, and a p-value of 0.049 versus 0.051 is not a meaningful difference in evidence.
Overcorrecting into cynicism. The opposite error is dismissing all observational research. Cohort evidence established the harms of smoking without any randomized trial, because the effect was large, dose-dependent, consistent, and mechanistically supported. Strong observational evidence can support causation. Small, heavily adjusted, single-study observational evidence usually cannot.
Treating adjustment as magic. Readers sometimes assume that a paper reporting "adjusted for age, sex, and comorbidities" has solved confounding. Adjustment handles measured confounders reasonably well, partially and imperfectly. It cannot handle what was never measured.
Judging by the journal or the impact factor. Prestigious journals publish overreach, and modest journals publish beautifully calibrated papers. The design and the claim determine the fit, not the venue.
Reading only the abstract. The abstract is the most compressed and most promotional part of the paper. Every serious evaluation requires opening the methods and the tables.
Forgetting that samples are finite and specific. A finding in a registry of middle-aged adults in one country may not transfer to other ages or settings. External validity is a separate question from internal validity, and a paper can be internally honest and still poorly generalized by its readers.
One personal caution. If you are reading research papers to make decisions about your own health, a diagnosis, or a treatment, individual decisions need a qualified clinician who knows your history. This article teaches appraisal skills, not clinical judgment.
Prevention Practices
Prevention beats correction, and the habits below serve students, researchers, and anyone whose work involves reading a research paper regularly.
Learn to name the designs on sight. Study design recognition is the highest-yield skill in this entire domain. Spend the time to learn what randomized trials, prospective and retrospective cohorts, case-control studies, cross-sectional studies, systematic reviews, and meta-analyses can and cannot establish. Once the designs are second nature, most overreach announces itself in the first ninety seconds.
Keep a claim log for papers in your field. When a paper's abstract makes a causal claim, record the design and the effect size next to it. Over months, the log teaches you the typical gap between claim and evidence in your field, and it gives you a citation-safe record when you need to write or review.
Write your own abstract in association language first. If you author studies, draft the abstract using "associated with" phrasing, then change a verb only where the design licenses it. Starting strict and loosening deliberately is far safer than starting loose.
Use pre-registration for confirmatory analyses. Posting your analysis plan before data collection converts later claims from exploratory to confirmatory, and it protects you from your own unconscious flexibility during analysis.
Draw the causal structure before running models. A directed acyclic graph, which is a simple diagram of arrows from causes to effects, forces you to decide which variables are confounders, which are mediators, and which are colliders before any coefficient is computed. The discipline pays off in the paper's language.
Adopt a two-line review habit. When you finish reading any paper, write two lines. The first states the design and sample. The second states the strongest claim the design can support. If the abstract's claims exceed the second line, you have measured the overreach precisely, and you can cite the paper for exactly what it showed.
Teach the verbs. If you supervise students or lead journal clubs, make causal vocabulary a standing agenda item. Ask one question of every paper on the schedule. What did this study actually show, and what verbs does the abstract use?
Frequently Asked Questions
What is causal overreach in a research paper?
Causal overreach is when a paper's language claims that one variable causes another when the study design only supports a weaker claim of association. It most often appears in the abstract and the final paragraph of the discussion, where correlational findings are summarized with causal verbs.
How do I quickly spot causal overreach when I read a research paper?
Compare the verbs in the abstract with the design sentence in the methods. If the abstract says a factor reduces, prevents, or improves an outcome while the methods describe a cross-sectional survey or a single-visit measurement, that mismatch is overreach. The five-step sequence in this article takes about ten minutes per paper.
When does correlation imply causation?
Correlation supports causation when temporality is established, the effect is strong and dose-dependent, the finding replicates across independent populations and designs, and the evidence fits known biology. The Bradford Hill viewpoints organize these considerations, and triangulation across methods with different weaknesses provides the strongest practical case.
Does a statistically significant result prove causation?
No. Statistical significance measures how incompatible the data are with a null hypothesis of no association. It addresses whether an association exists, never what produced it. Randomized designs address the causation question, not the p-value.
Can observational studies ever support causal claims?
Yes, when the evidence is strong, consistent, dose-dependent, and triangulated with other methods. The evidence that smoking causes lung cancer came largely from observational research and is decisive. The problem is not observational design itself, it is weak observational evidence being summarized in causal language.
What is the difference between association and causation?
An association means two variables move together in the data. Causation means changing one variable changes the other. Confounding, reverse causation, and selection bias can all create associations without causation, which is why the distinction is the first thing critical readers check.
What is the fastest way to learn how to read scientific papers?
Read each paper in layers rather than front to back. Abstract for claims, methods for design, results tables for effect sizes and confidence intervals, then the discussion to see whether the interpretation matches the evidence. Practicing this layered read on papers in your own field builds speed within a few weeks.
What should I do if I have already cited a paper that overreaches?
Check what the paper actually showed and adjust your own wording to match the evidence, typically by switching to association language and citing the paper for the association rather than the causal claim. If the overreach is severe and the paper matters to your field, consider a letter to the editor or a correction note in your own next manuscript.