How to Present Your Research to High School Students: A Template
By Dr. Zubair Khalid, DVM, MS, PhD ·

By the end of this guide you will be able to build and deliver a 20-minute scientific presentation that a room of 15 to 18 year olds can follow, question, and remember. You will have a slide-by-slide template with timings, a worked example built on a real published study, a method for turning one dense figure into one clear slide, and a plan for the question period.
You need very little on hand: your existing research presentation slides, a laptop with PowerPoint, Google Slides, or a Markdown-based slide tool, a timer for rehearsal, and one hour of preparation time. If you want to rebuild a figure from scratch, Python with the matplotlib library installed is enough.
Why a High School Audience Changes Your Scientific Presentation
Most scientists learn to present to peers. A scientific presentation for high school students inverts several of those habits. The vocabulary has to change, the payoff has to come early, and the delivery has to invite interaction rather than lecture at it.
The communication itself is a recognized scientific skill. "Obtaining, Evaluating, and Communicating Information" is one of the eight Science and Engineering Practices in the National Research Council framework that underlies the Next Generation Science Standards, and communicating findings is treated as part of scientific inquiry rather than an add-on to it [1]. When you visit a classroom or judge a science fair, you are modeling a core practice, not just sharing results.
There is also direct evidence about what students in science and engineering fairs actually do. A national survey of 1,789 high school science and engineering fair participants asked what communication and presentation skills they used. The listed practices included literature review, keeping a research notebook, using software to prepare tables and graphs, writing a report, preparing a poster board, giving a PowerPoint presentation, and interviewing with judges [1]. Two findings matter for your visit. First, students already recognize software-prepared figures and slide presentations as part of doing science, so a well-built slide deck speaks their language. Second, the judge interview is a distinct skill they practice, which means a live question period is familiar territory for many of them and you should treat it as a teaching moment rather than a defense.
A second principle comes from design research on visualization. A study on presenting the same data to different audiences used personas, which are short fictional profiles of typical users, to decide which tasks a shared visualization should support for each group. The key insight was that tasks shared between all groups should be supported directly, while tasks unique to one group can be handled separately [2]. Apply that to your talk. The task shared by every audience is understanding what you found and why it matters. Tasks unique to experts, such as evaluating your statistical model or your controls, belong in the appendix or the researcher-only version of the deck, not in the main line of a classroom talk.
Finally, remember what the classroom environment feels like for your listeners. A scoping review of 310 articles on sense of belonging in medical students found that well-being was the most cited effect of belonging, followed by increased learning and professional identity formation, and that features of the learning environment, including inclusive practice and student support, shaped whether students felt they belonged [3]. High school classrooms work the same way. An invited scientist who learns names, asks real questions, and treats wrong answers as useful information changes the learning environment, not just the content delivered in it.
Know Your Audience Before You Open PowerPoint
Adolescents are not a simplified version of a seminar audience. They bring their own pressures, and a few findings from the education literature should shape your choices.
Academic stress is real and often driven by high expectations. In a qualitative study of 15 female university students in China, participants described academic stress driven by high expectations, family responsibilities, and sociocultural gender norms, and they coped through psychological capital, meaning resilience, self-efficacy, optimism, and hope, along with social support from family, peers, and mentors [4]. High schoolers sit earlier on the same continuum. A speaker who piles on "this is really hard, most people fail" framing adds stress without adding learning. A speaker who shows that confusion is a normal part of research does the opposite.
Trust matters more than polish. A qualitative study of ten school nurses in Swedish upper secondary schools found that early identification of adolescent mental health problems relies on relational continuity and trust, and that adolescents often avoid seeking help due to stigma, fear of judgment, and limited mental health literacy [5]. Translate that to your visit. Students will ask the question they actually have only if the room feels judgment-free. That argues for stating up front that every question is a good question, and for responding to a weak answer with "that's a reasonable guess, here's how we'd test it" instead of "no."
Social, participatory formats help rather than hurt. A study of 1,027 Chinese college students found that higher participation in group music activities was significantly associated with lower academic burnout, with the association running through social connectedness and collective effervescence, the shared feeling of energy in a group [6]. You are not running a music class, but the mechanism transfers. Short pair discussions, show-of-hands predictions, and group guesses at a data point build the connectedness that keeps attention through the harder parts of your talk.
Active, structured formats also measurably improve outcomes. A narrative review of simulation-based obstetric training for medical students concluded that simulation frequently improves learners' knowledge, perceived preparedness, and confidence, though subjective outcomes are sometimes reported in place of objective measures [7]. The practical lesson for a classroom talk is to build in one activity where students do something, a prediction, a hypothesis, a design choice, rather than only listening.
The Template: A 20-Minute Format That Works
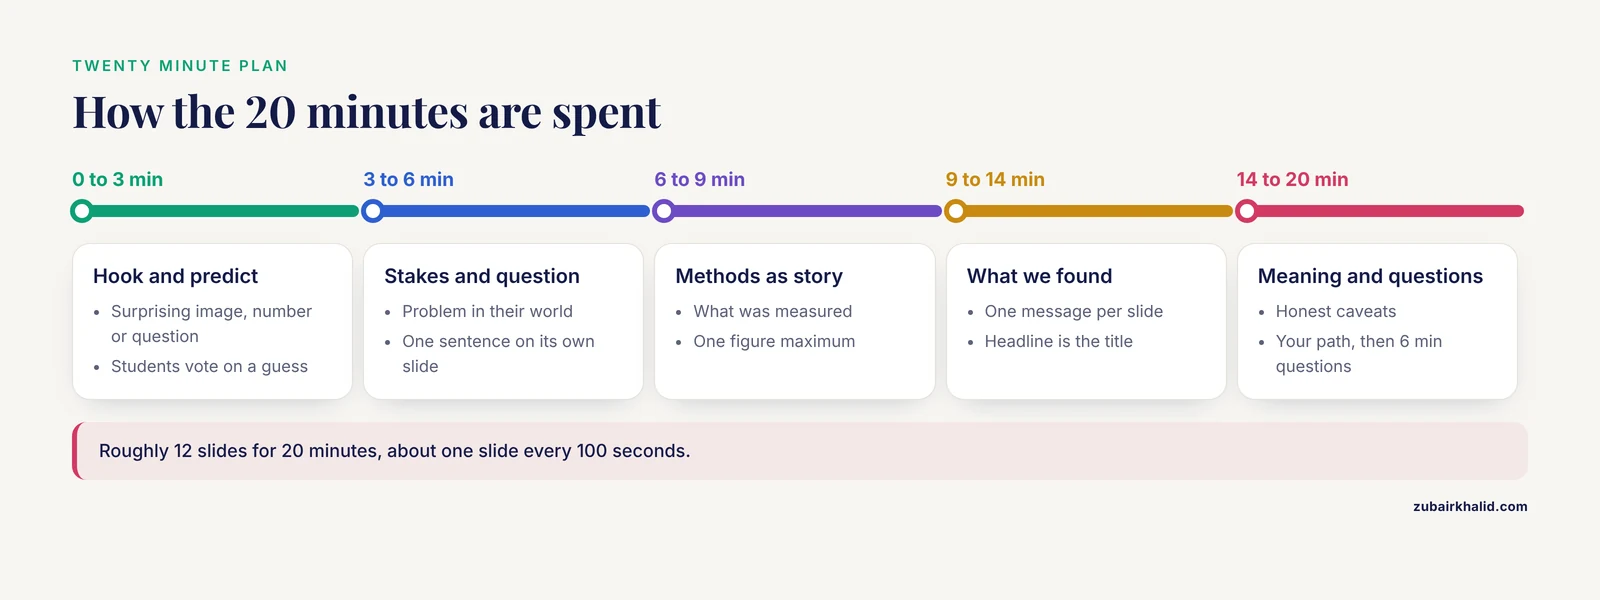
Here is the core template for how to present research to high school students. It assumes a 20-minute slot, which is the most common classroom request. If you have 45 minutes, expand the results section and the activity, not the background.
| Segment | Time | Slides | Purpose |
|---|---|---|---|
| Hook and prediction | 3 min | 1 to 2 | A surprising image, number, or question students vote on |
| Why anyone cares | 2 min | 1 | The problem in the students' world |
| The question | 1 min | 1 | One sentence, on its own slide, in large type |
| How we found out | 3 min | 2 | Methods as a story, one figure maximum |
| What we found | 5 min | 3 to 4 | One message per slide, headline as the title |
| What it means and limits | 3 min | 1 to 2 | Honest caveats, what remains unknown |
| Your path here | 2 min | 1 | How you got into this work, one concrete detour included |
| Questions | 6 min | 0 to 1 | Prepared prompts ready if the room is quiet |
That is roughly 12 slides for 20 minutes, or about one slide every 100 seconds. Three design rules govern every slide in the deck:
- One message per slide. If you cannot state the message as a full sentence, the slide is doing two jobs.
- The title is the takeaway. Write "Daily cigarette smoking fell sharply while vaping rose," not "Trends in tobacco product use, 2017 to 2024."
- Minimum 24-point body text. Anything smaller is a handout, not a slide.
Numbered Walkthrough: Building the Talk From Scratch
Step 1: Write your one-sentence takeaway
Before touching research presentation slides, write the single sentence a student should be able to repeat at dinner. Format it as: "We asked [question], we found [answer], and this matters because [consequence]."
Example: "We asked whether American teenagers swapped cigarettes for vapes between 2017 and 2024, we found that daily cigarette smoking collapsed while vaping rose and then shifted, and this matters because it tells us which tobacco policies are working."
If your research has three takeaways, pick the one closest to student experience. Park the others on backup slides.
Step 2: Storyboard the deck as plain text
Write the deck before styling it. A plain-text storyboard keeps you honest about the one-message rule. Save this in a file called storyboard.txt:
1. TITLE: Your name, affiliation, one striking image
2. HOOK: Chart or photo, "Guess before I tell you" prompt
3. STAKES: Why this problem touches their lives
4. QUESTION: One sentence, 40-point font
5. METHODS A: What we measured, cartoon-level schematic
6. METHODS B: How many samples and how we compared groups
7. RESULT 1: Headline figure, title is the finding
8. RESULT 2: Second finding or the surprise
9. RESULT 3: What changed over time
10. MEANING: What this changes, one concrete action or implication
11. LIMITS: Two honest caveats in plain words
12. PATH: How I got here, one photo of the detour
13. QUESTIONS: Slide with three starter prompts
The expected output of this step is a 13-line file you can read aloud in under a minute. If reading it takes longer than 90 seconds, the talk is overpacked for 20 minutes.
Step 3: Rebuild your key figure for this audience
Take the figure you would show at a conference and ask what a 16-year-old needs from it. Usually they need one trend, one comparison, and an axis they can read from the back row. Here is a complete, runnable example in Python that produces a clean, slide-ready trend figure:
import matplotlib.pyplot as plt

# Illustrative values showing the shape of a decline.
# Replace with your own measured data before presenting.
years = [2017, 2019, 2021, 2023, 2024]
daily_use_percent = [4.5, 3.0, 1.8, 1.2, 1.0]

fig, ax = plt.subplots(figsize=(7, 4.5))
ax.plot(years, daily_use_percent, marker="o", linewidth=3)
ax.set_title("Daily use fell steeply from 2017 to 2024", fontsize=18)
ax.set_ylabel("Percent reporting daily use", fontsize=14)
ax.set_xlabel("Year", fontsize=14)
ax.tick_params(labelsize=13)
ax.spines["top"].set_visible(False)
ax.spines["right"].set_visible(False)
fig.tight_layout()
fig.savefig("trend_slide.png", dpi=300)
print("Saved trend_slide.png")
Running the script prints Saved trend_slide.png and writes a 300-dpi PNG wide enough to fill a slide without blurring. Three parameters matter and each has a failure mode:
- figsize controls the aspect ratio. A 7 by 4.5 inch figure matches a 16:9 slide. A square figure leaves dead space above and below.
- dpi controls print resolution. At 100 dpi the image looks fine on your laptop and blurry on a projector. Use 300.
- linewidth and marker size are your back-row legibility knobs. A 1-point line that looks crisp on your monitor disappears from row six.
Common error: ModuleNotFoundError: No module named 'matplotlib'. Fix it with pip install matplotlib in the same environment your script runs in. A second common error is OSError: Cannot load image in PowerPoint when you move the deck to another machine. Fix it by embedding the image rather than linking it, or by carrying the PNG in the same folder as the deck.
Step 4: Style the slides
Set the defaults once, in the slide master, so you never fight individual slides:
- Body text 24 to 28 point, titles 32 to 40 point.
- One font family throughout. Sans-serif fonts project more cleanly than serifs in bright rooms.
- Maximum about 20 words per slide of body text. The words on the slide are anchors, and your spoken sentences carry the content.
- High contrast only. Dark text on a plain light background survives every projector. Skip decorative backgrounds entirely.
- Color-blind-safe palettes for any two-line comparison. Red against green is the classic failure. Blue against orange is a safe default.
Step 5: Rehearse against a timer with a hard cut list
Run the talk twice, timed. Then write your cut list: the two slides you will drop if you are running long at the 10-minute mark. Teachers will thank you for finishing on time, and a talk that runs over destroys the question period, which is where the learning compounds.
Step 6: Design one 90-second interaction
Plan a single moment where students commit to an answer before you reveal yours. Show-of-hands works because it is anonymous in feel even when it is not anonymous in fact. Script it: "Before I show you the data, predict. Thumbs up if you think cigarette smoking went up since 2017, thumbs down if down, sideways if you think it stayed flat." Reveal, then show the trend. Committing to a prediction first is what converts a shown figure into a remembered one.
A Worked Example: Translating a Real Study for a Classroom
Here is how to present research to high school students, example fully built, using a published study as the source material. The example matters because it shows how much you keep and how much you translate.
The source study analyzed the Monitoring the Future survey, an annual nationally representative survey of US students in grades 8, 10, and 12, covering 2017 through 2024 with 227,966 participants who self-reported past-30-day cigarette and e-cigarette use on school-administered questionnaires. The researchers used joinpoint regression, a method that fits trend lines and detects points where the trend changes direction, broken out by grade and sex [8].
The findings, in the language of the paper: daily cigarette use in the past 30 days declined with an annual percent change of -23.3 percent among 12th grade boys and -29.5 percent among girls. Exclusive cigarette use also declined significantly among 12th grade boys, and e-cigarette use increased over much of the period [8].
Now the translation, slide by slide:
Slide 2, the hook. Show two anonymous trend lines, cigarettes and vapes, crossing. Prompt: "One of these went way down since 2017 and one went way up. Which is which?" This works because students have opinions about vaping even if they have never heard of joinpoint regression.
Slide 4, the question. "Did American teenagers quit cigarettes, or just switch to vapes?" That single sentence is the entire study, correctly framed.
Slide 5, methods. Never say "cross-sectional secondary analysis of a complex survey design with clustering, stratification, and weighting." Say: "Every year, researchers survey thousands of students in 8th, 10th, and 12th grade across the country, over 227,000 students over eight years, and ask anonymously what they used in the last month. Anonymous answers are more honest, and huge numbers let us trust the pattern." That is a faithful simplification. You removed the statistical machinery, not the honesty of the design.
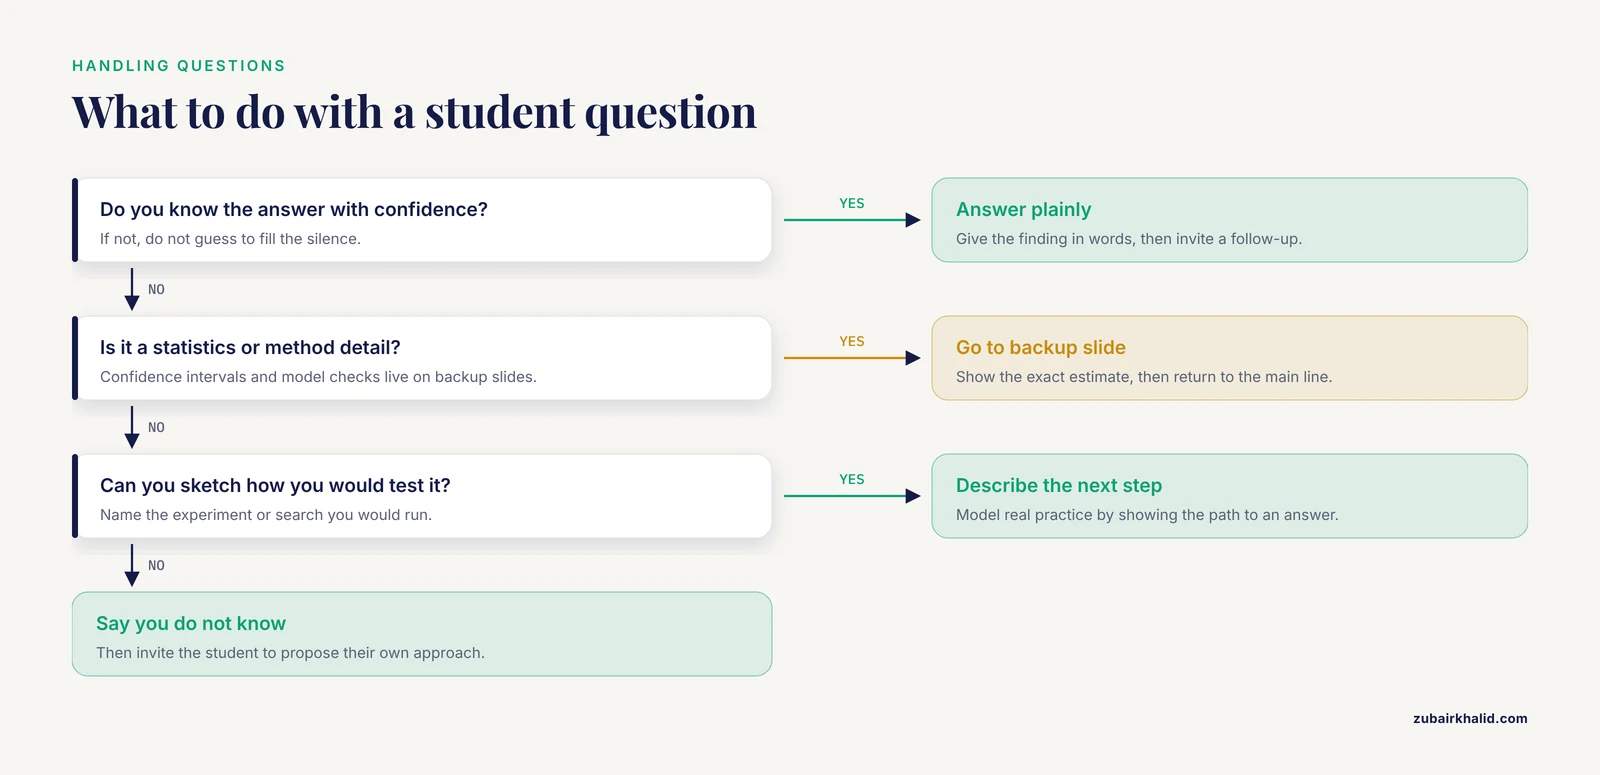
Slides 7 and 8, results. One slide per finding. Slide 7: "Cigarette smoking collapsed. Daily smoking fell about a quarter each year among 12th graders." Slide 8: "Vaping filled the space." Do not put the annual percent change confidence intervals on these slides. Put the direction and the magnitude in words, and keep the interval estimates on a backup slide in case a teacher or a sharp student asks how confident the estimate is.
Slide 10, meaning. "This tells us teen smoking is genuinely falling, not just hiding in a new device. Policies that target one product can work, but they shift behavior, so monitoring has to keep up." That is the actual policy implication of trend surveillance, stated at a level a 10th grader can argue with.
The pattern generalizes. For any study you might present, keep the question, the sample size in round relatable terms, the direction of every finding, and one honest caveat. Translate the method into a story about what was measured and how. Leave the statistics, the model diagnostics, and the confidence intervals to backup slides.
Delivery: Building a Room Where Questions Happen
Your opening two minutes set the psychological climate, and there is evidence worth borrowing from training research. A study of 114 medical students in high-fidelity simulation examined whether psychological safety, the shared sense that you can speak up without humiliation, could be established in the prebriefing phase that precedes the exercise. Pre-existing psychological safety scores significantly predicted both post-simulation stress and post-simulation psychological safety [9]. The parallel is direct. Students who feel safe before your question period ask questions during it. So front-load safety: say explicitly that you got things wrong as a student, invite partial answers, and never let a wrong guess hang in the room without a follow-up that honors the attempt.
Structure the interactivity deliberately. A brief pair-share, where two neighbors compare predictions for 30 seconds before a show of hands, gives every student a rehearsal before they answer publicly. This matters because the group-based, socially connected formats in the research literature are consistently linked with better engagement and lower burnout than isolated formats [6].
Reserve real time for questions and prompt them with specifics. "What would you have measured differently?" gets better questions than "Any questions?" A question period is also where you can model the judge-interview skill that science fair students practice, asking them to justify an answer the way they would defend a project [1].
Your Path Into Research Is Part of the Content
Students do not only learn your results. They learn that someone like them became a researcher, and that impression forms their own picture of the career. Evidence from medical education supports the point. A scoping review of 52 studies on professional identity formation in undergraduate medical education found that interventions included clinical exposure, mentorship, humanities and arts, and reflective approaches, indicating that exposure and mentorship are recognized drivers of how students come to see themselves as professionals [10].
Practical translation for your path slide: name one concrete detour, a course you nearly failed, the summer you worked somewhere unrelated, the professor who answered your email. One detour, told in 30 seconds, does more career counseling than five minutes of generic advice.
Common Mistakes and Limitations
- Recycling conference slides. A conference deck is built for experts evaluating your method. Rebuild from the storyboard in Step 2. If a slide contains an acronym a 15-year-old has not seen, either define it in three words or delete it.
- Reading the slides aloud. Students can read faster than you can speak. If the slide carries the sentence, say something the slide does not.
- Dumbing down into inaccuracy. The line between simplification and distortion is claim-level. Simplify the vocabulary and the method. Never round a finding into something the data does not support, and never present an illustrative sketch of data as real data. If you build a shape-only figure for rehearsal, label it as a sketch on the slide or replace it with your real numbers before you present.
- Faking enthusiasm. Adolescents detect performance quickly. Conveying why you personally find the question interesting is more persuasive than exclamation points.
- Overrunning. Teachers plan around your slot. A 20-minute talk that ends at 18 minutes with time for questions beats a 25-minute talk that eats the period.
- Ignoring the quiet room. Silence after "questions" usually means the students need a concrete prompt, not that they are uninterested. Have three starter questions ready on your final slide.
- One honest limitation of this template. Classroom lengths, class sizes, and expectations vary, and individual teachers will adapt the structure to their own periods. Ask your host how long you actually have and whether the class is mid-unit on anything related, then adjust the timings rather than the structure.
Frequently Asked Questions
How long should a research presentation for high school students be?
Plan for 15 to 20 minutes of talking plus 5 minutes of questions for a standard class period. If the teacher offers more, extend the interactive segments rather than the background material.
What is the best format for presenting research to high school students?
Use the seven-part template in this guide: hook, stakes, one-sentence question, story-based methods, one-message-per-slide results, meaning and limits, then your career path and questions. The order front-loads payoff, which is the main structural difference from a seminar talk.
How do I simplify my research without misleading students?
Simplify vocabulary, method descriptions, and slide density. Keep the direction and magnitude of every finding accurate, keep at least one honest caveat, and keep exact statistics on backup slides. If a student could repeat your takeaway without distorting it, you have simplified correctly.
How many slides do I need for a 20-minute talk?
About 12 to 13 slides, roughly one slide every 100 seconds. Add two or three backup slides holding statistics and details for the question period.
How do I start a research talk for high school students?
Open with a prediction the students can vote on, using an image, a crossing trend, or a surprising number, before you explain anything. Committing to a guess first makes the reveal memorable and buys you attention for the harder middle of the talk.
What do I do when a student asks a question I cannot answer?
Say "I do not know, and here is how I would find out," then sketch the experiment or search you would run. That answer models real scientific practice better than a confident guess, and it invites the student to propose their own approach.
Can I use my conference slides for a high school audience?
Rarely without a rebuild. Conference decks assume expert vocabulary and dense figures. Keep at most your title image and your headline figure, and rebuild everything else from a fresh storyboard aimed at the shared task of understanding what you found.
How do I make my research presentation slides legible for a whole classroom?
Use at least 24-point body text, 32 to 40-point titles, one sans-serif font, plain high-contrast backgrounds, and thick lines with large markers on every figure. Export figures at 300 dpi so they stay sharp on a projector, and test the deck from the back of the room before students arrive.
Sources
- High school science fair: Characterizing student communication and presentation practices and their association with SEF outcomes.
- Same Data, Different Audiences: Using Personas to Scope a Supercomputing Job Queue Visualization.
- Exploring sense of belonging in medical students: A scoping review.
- Academic stress among female university students in China: a qualitative study of coping through psychological capital and social support.
- School nurses' perspectives on key features of a mobile app to support early identification of adolescent mental health problems: a qualitative study.
- Group Music Activities and Academic Burnout Among Non-Music-Major College Students with Recent Group Music Participation: A Cross-Sectional SEM-fsQCA Study.
- Beyond Confidence: A Narrative Review Assessing Educational Outcomes in Simulation-Based Obstetric Training for Medical Students.
- Trends in exclusive and dual cigarette and electronic cigarette use among United States middle and high school students from 2017 to 2024: A cross-sectional analysis.
- High-Fidelity Simulation for Medical Students: Does Psychological Safety Increase During the Prebriefing Phase?
- Educational Interventions for Professional Identity Formation in Undergraduate Medical Education: A Scoping Review.