Free and Low-Cost Reproducibility Tools
By Dr. Zubair Khalid, DVM, MS, PhD ·

Reproducibility means that you, or another researcher, can rerun your analysis on the same data and get the same numbers, while replication means that a new study with new data reaches a consistent conclusion. Free reproducibility tools for research attack the first problem, and the simplest rule of thumb for choosing one is this: match the tool to the step where your results can silently drift, whether that is data collection, the analysis pipeline, the benchmark you compare against, or the way you report the study.
This guide covers the main free and low-cost reproducibility tools available today, explains what each one actually standardizes, compares them on the criteria that decide real choices, and ends with a practical reproducibility checklist you can adapt to your own project.
What Reproducibility Tools Actually Do
Reproducible research rests on four habits, and each habit has free tooling built around it.
- Standardized data collection. Questionnaires, case report forms, and behavioral assessments produce comparable data only if every site and every time point asks the same questions in the same order with the same response options. Schema-based survey frameworks handle this at the data-structure level rather than at the level of a pretty web form.
- Persistent analysis pipelines. An analysis is reproducible when every step, including the parameters and the order of operations, is recorded and rerunnable. Evaluation frameworks that log every analysis into a history database make this automatic instead of manual.
- Fixed benchmarks and shared baselines. In computational fields, results drift because each lab uses a different dataset version, different preprocessing, and different metric implementations. Platforms that publish a fixed, curated evaluation corpus or a single unified codebase remove that drift.
- Structured reporting and quality scoring. Checklists force authors and reviewers to disclose the methods details that a reader would need to rerun the work.
The tools reviewed below map onto these four habits. None of them covers everything, which is why the comparison table and the selection criteria matter more than any single product name.
Side-by-Side Comparison of Free Reproducibility Tools
| Tool | What it standardizes | Cost | Best fit | Main drawback |
|---|---|---|---|---|
| ReproSchema | Survey design, reusable assessments, data validation, and format conversion | Free, open source | Biomedical, clinical, and behavioral studies collecting questionnaire data | Requires schema-based design instead of drag-and-drop form building |
| Freva | Model evaluation workflows, analysis history, and shared data search | Free, open source | Research groups evaluating large models on shared computing systems | Designed around high-performance computing environments |
| GBD Analysis Suite (R Shiny dashboard) | End-to-end burden-of-disease analysis through a code-free interface | Free, open source | Epidemiology and public health analysts, including those in resource-limited settings | Limited to the analytical modules the developers included |
| stable-worldmodel | Data pipelines, baselines, and standardized benchmarks for world modeling | Free, open source | Machine learning researchers studying agents and learned world models | Narrow domain, specific to world modeling research |
| BrowseComp-Plus | Evaluation of deep-research agents against a fixed document corpus | Free | AI researchers comparing search-augmented language models fairly | An evaluation benchmark, not a general analysis pipeline |
| Unified baseline codebases (for example, SLT baselines) | Preprocessing, model training, and metric calculation across methods | Free, open source | Fields where published methods have been compared on unequal footing | Reimplementation takes effort and can lag behind the newest methods |
| CLEAR, RQS, and CLEAR-RQS checklists | Reporting completeness and rigor of radiomics studies | Free | Authors and reviewers of imaging biomarker research | Measures how completely a study is reported, not whether the result is true |
Options in Detail: Pros and Cons of Each Free Reproducibility Tool
ReproSchema for standardized data collection
ReproSchema is an open-source ecosystem for survey-based research built around a central idea: the questionnaire itself should be a structured, machine-readable document, a schema, rather than a form that exists only inside one commercial platform. The ecosystem bundles a schema-centric framework, a library of reusable assessments with more than 90 instruments, and computational tools for validating collected data and converting between survey formats such as REDCap [1].
In a comparative evaluation against 12 survey platforms, ReproSchema's structured, modular approach was positioned as a direct answer to inconsistencies in questionnaire data collection across biomedical, clinical, behavioral, and social science research [1]. Three worked use cases show its range: standardizing required mental health survey common data elements, tracking changes in longitudinal data collection over time, and generating interactive checklists for neuroimaging research [1].
Pros. Data structures are portable across platforms and sites. Longitudinal changes to a survey can be tracked explicitly, which matters when a study runs for years. The assessment library saves each new study from writing instruments from scratch.
Cons. There is a real learning curve. Conventional survey platforms let a beginner build a form in an afternoon through a graphical interface, while ReproSchema asks you to think about the underlying structure of your instrument. Teams that only need a simple one-time questionnaire may find the structure overhead hard to justify.
Freva for shared evaluation systems
Freva, short for Free Evaluation System Framework, is an open-source scientific software framework developed for the climate and earth system modeling community. It runs on high-performance computing systems and exposes every feature through both a shell environment and a web interface.
Three core components do the reproducibility work. A plugin interface lets scientific developers connect their own analysis tools regardless of programming language. A history subsystem stores every analysis performed with the system in a database, so any figure or number produced months ago can be traced back to its exact configuration. A databrowser provides metadata-based search so scientists and their plugins can retrieve the right data from a standardized model database. The combination is designed to increase scientific output while enabling transparency and reproducibility for entire research groups.
Pros. The automatic history log is the standout feature. Most labs attempt to reconstruct what they did from notebooks and memory, and Freva replaces that reconstruction with a queryable record. The language-agnostic plugin system means a lab with mixed Python, R, and Fortran users can still share one evaluation system.
Cons. Freva presumes an institutional computing context. A graduate student with a laptop and a CSV file will get more value from lighter-weight tools. Adoption works best when a group, institute, or university deploys it as shared infrastructure.
R Shiny dashboards for code-free reproducible analysis
A second route to reproducible analysis is to remove code from the user's path entirely. The GBD Analysis Suite is an open-source dashboard built with R and the Shiny framework that consolidates 11 commonly used analytical modules for burden-of-disease research, including trend estimation, changepoint detection, demographic decomposition, frontier benchmarking, and health inequality measurement, into a single code-free web interface that accepts user-uploaded data [3]. It integrates established statistical and plotting packages such as forecast, segmented, ggplot2, and plotly under the hood [3].
The developers explicitly targeted a substantial technical barrier for investigators in resource-limited settings, where the expertise to stitch these methods together in code is scarce even though the underlying data, from the Global Burden of Disease study, are freely available [3].
Pros. No programming required, which widens access to rigorous methods. A single interface covering the full analytical workflow reduces the transcription errors that occur when results are moved between separate tools. Because the dashboard is open source, the statistical methodology behind each module is inspectable.
Cons. You can only run the analyses the developers built. If your question needs a method outside the 11 modules, you need an R programmer. Dashboards also create a subtle risk: clicking through an interface feels easier than writing code, but it is just as easy to misconfigure an analysis, so the same documentation discipline still applies.
Open-source benchmark platforms for machine learning research
Machine learning reproducibility has its own tooling pattern: shared platforms that fix the data, the baselines, and the evaluation protocol.
stable-worldmodel is an open-source platform for world modeling research, a field where agents learn predictive models of their environment. Its developers identified three bottlenecks that fragment the field: fragile one-off codebases, slow video data loading, and the absence of standardized generalization benchmarks. The platform answers with a high-performance data layer built on the Lance format with conversion tools for MP4, HDF5, and LeRobot datasets, clean implementations of modern baselines and planning solvers, and a suite of environments extended with controllable visual, geometric, and physical factors of variation for systematic evaluation.
BrowseComp-Plus addresses a different corner of AI evaluation. Deep-research agents, which pair large language models with search tools, had been evaluated against benchmarks that rely on black-box live web search APIs, which undermines fairness and reproducibility because the underlying web content changes and the corpus cannot be controlled. BrowseComp-Plus fixes this with a static, carefully curated corpus in which every query includes human-verified supporting documents and mined challenging negatives. The benchmark separates systems sharply: the open-source Search-R1 model paired with a BM25 retriever achieved 3.86% accuracy while GPT-5 achieved 55.9%, and combining GPT-5 with a Qwen3-Embedding-8B retriever improved results further.
Pros. Fixed corpora and shared baselines make comparisons meaningful across papers and labs. Publicly released benchmarks and tools invite community-driven improvement, a pattern also seen in speech recognition, where an open-sourced evaluation toolkit for Polish automatic speech recognition supported 600 system-model-test set evaluations across 8 analysis scenarios and was designed to be adaptable to other languages [4].
Cons. These platforms are domain-specific. A bench biologist gains little from a world modeling framework. Benchmarks also freeze a snapshot of the field, so methods tuned to a fixed corpus can overfit to it.
Unified baseline codebases for fair method comparison
Some reproducibility problems come from comparing apples to oranges. A study of gloss-free sign language translation, the task of translating sign language video to text without intermediate gloss annotations, re-implemented key published contributions in one unified codebase with standardized preprocessing, video encoders, and training setups [5]. Under those consistent conditions, many performance gains reported in the literature diminished, showing that implementation details and evaluation setups, not methodological novelty, often drove the reported improvements. The codebase was released publicly to support transparency and reproducibility.
Pros. A unified codebase is the strongest available answer to the question of whether a new method genuinely beats an old one. Once it exists, every future paper can be evaluated on identical footing.
Cons. Someone has to do the reimplementation, and faithful reimplementation is skilled, unglamorous work. Unified codebases also age, and the newest methods may not yet be ported in.
Reproducibility checklists and quality scoring frameworks
Checklists are the lowest-tech and most broadly applicable reproducibility tools. In radiomics, the field that extracts quantitative features from medical images, clinical translation has been slowed by reproducibility problems, and two quality scoring frameworks emerged in response: CLEAR (CheckList for EvaluAtion of Radiomics research) and RQS (Radiomics Quality Score) [6].
A systematic review of post-radiotherapy stage III/IV non-small cell lung cancer radiomics studies merged the two into a 61-item CLEAR-RQS checklist and applied all three instruments to the eligible literature [6]. The review's findings illustrate why checklists matter. Among 11 included studies, the median cohort size was 91 patients, 9 of 11 were single-center, and no common radiomic features were identified across studies [6]. The most frequently unreported items clustered in CLEAR's "methods" and "open-source" categories and in RQS's "phantom-calibration" category [6], which tells an author exactly where reporting tends to fail.
Pros. Checklists are free, require no software, and work at the design stage, where they prevent missing data, as well as at the review stage. A merged checklist like CLEAR-RQS gives reviewers a concrete, itemized rubric.
Cons. A checklist scores the completeness of reporting, not the correctness of the science. A study can score well and still be wrong. Scores also invite gaming if they become publication targets rather than documentation aids.
Cross-tool benchmarking as a reproducibility practice
A final option is not a single tool but a practice: run the same question through multiple independent tools and report where they agree. In cancer genomics, an evaluation of somatic copy number variation detection, meaning the identification of gained or deleted DNA segments in tumor genomes, benchmarked six of the most recent and commonly used software tools for accuracy, sensitivity, and reproducibility [7]. Copy gain, loss, and loss of heterozygosity calls were consistent across sequencing centers, callers, and technologies, but variation in results was driven mostly by how each tool determined genome ploidy, the number of chromosome copies in the tumor, and some tools called excessive gains or losses on a hyper-diploid genome [7]. The study built a high-confidence consensus call set for the reference cancer cell line HCC1395 from six callers confirmed by three orthogonal methods [7].
The same comparative logic applies to measurement platforms. In quantitative proteomics, a systematic comparison of data-dependent and data-independent acquisition found that data-independent acquisition reached intragroup correlation coefficients above 0.98 compared with 0.93 to 0.98 for data-dependent acquisition, and kept intragroup coefficients of variation under 10% versus above 15% [8]. In security testing, an evaluation of nine popular free and open-source tools across 75 real-world web applications found that static and dynamic approaches each performed better on different risk categories, supporting a combined strategy [9].
Pros. Agreement across independent implementations is one of the strongest reproducibility signals available. Tool comparisons also give you published performance matrices to justify your own choice.
Cons. Running multiple tools multiplies work, and disagreements require interpretation rather than producing a single clean answer.
Choosing Among Free Reproducibility Tools for Research
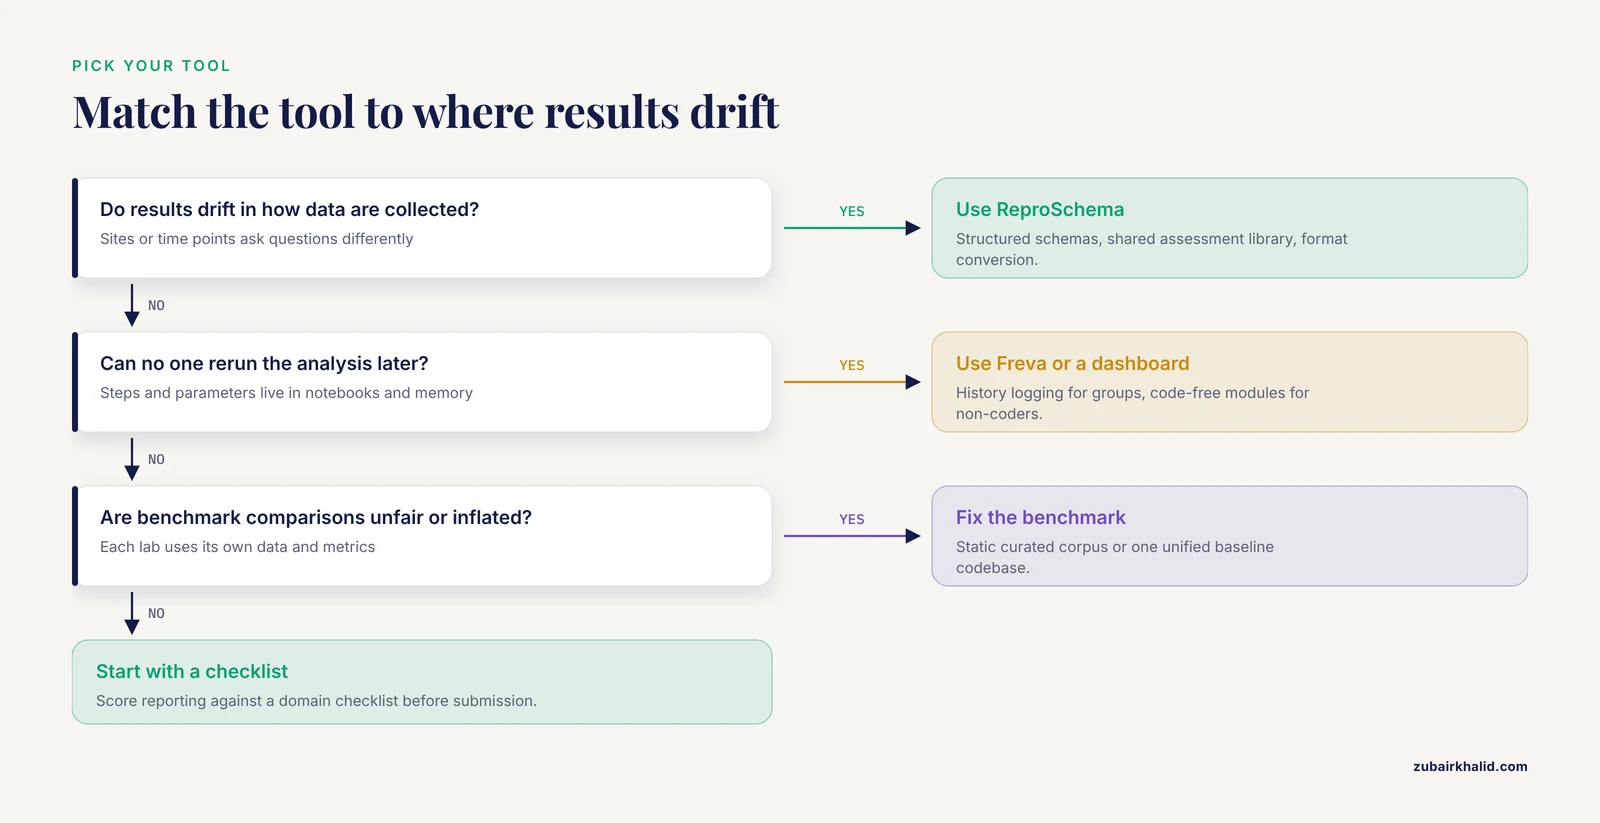
With the options laid out, the choice comes down to six criteria.
1. Where do your results drift? If the weakness is inconsistent questionnaire data between sites, collection standardization tools such as ReproSchema fit. If the weakness is an analysis no one can rerun, history-logging frameworks such as Freva or a code-free dashboard fit. If the weakness is inflated or noncomparable benchmark results, fixed-corpus benchmarks and unified codebases fit.
2. Who will use it? A code-free dashboard lowers the barrier for collaborators who cannot program [3]. A schema framework rewards teams comfortable with structured files [1]. A high-performance computing framework presumes institutional infrastructure.
3. Is the domain match close? Freva was built for earth system modeling [2], stable-worldmodel for world modeling, and CLEAR-RQS for radiomics [6]. Tools travel poorly outside their design domain, although some, like the open-sourced Polish speech evaluation toolkit, were explicitly built to be adapted to new languages [4].
4. What does free actually cost? The tools above carry no license fees, but free and low-cost reproducibility tools shift expense toward staff time, server hosting, and learning effort. Budget for those before adopting.
5. How mature is the evidence behind the tool? Free does not mean effective. A careful evaluation selected seven free or open-source static application security testing tools from a pool of 161 and found that, while they performed well on synthetic benchmarks, only 12.7% of real-world vulnerabilities were detected and even the combined detection capability left 70.9% of vulnerabilities missed [10]. The lesson for any discipline is that free tools deserve benchmarking against your own data before you depend on them.
6. Will the output outlive the tool? Prefer tools that export standard formats and record their own history. Freva's configuration database, ReproSchema's format conversion utilities [1], and stable-worldmodel's dataset conversion layer all serve this goal.
Worked Scenarios
Scenario 1: A multi-site behavioral health study. Three universities collect the same mental health questionnaires at six time points. Historically each site uses its own survey platform and the data arrive in incompatible shapes. Migrating the instruments into ReproSchema gives every site the same structured assessment definitions from a shared library, validates incoming data, and supports conversion to formats other systems consume, while the longitudinal tracking use case matches the repeated-measures design directly [1].
Scenario 2: A public health analyst without a programming background. An analyst in a resource-limited setting downloads Global Burden of Disease data and needs trend estimation, changepoint detection, and inequality measurement. Writing this workflow in code would require skills the team does not have. The GBD Analysis Suite provides all of these as modules behind one web interface with user-uploaded data, so the analyst produces a documented, methodologically standard analysis without writing code [3].
Scenario 3: A computational lab claiming a new state-of-the-art result. A team reports that their model beats the previous best on a language or vision task. Reviewers are skeptical because each lab used different preprocessing and metric code. The team adopts the practice demonstrated in the sign language translation study, reimplementing prior methods in one unified codebase under standardized training and evaluation conditions [5]. If the gain survives, the claim is credible. If it shrinks, the team has learned something before publication.
Scenario 4: A radiology resident writing a first radiomics paper. Before drafting, the resident works through the CLEAR-RQS checklist item by item, ensuring methods details, phantom calibration, and open-source availability are addressed, targeting exactly the categories most often left unreported in the published literature [6].
Building a Reproducibility Checklist for Your Own Project
You can assemble a working reproducibility checklist from the practices these tools encode. Adapt the following items to your project.
- State the exact version of every dataset, with a persistent identifier or checksum where possible.
- Fix the evaluation corpus before comparing methods, as fixed-corpus benchmarks do for fair comparison.
- Record every analysis run automatically in a history log rather than reconstructing it later.
- Define survey instruments as structured schemas with version tracking if the study is longitudinal [1].
- Pin software versions and environments so the pipeline reruns on a different machine.
- Run at least one independent tool or method on a subset of the data and report agreement.
- Score your manuscript against a domain checklist such as CLEAR-RQS before submission and report the score honestly [6].
- Release code, benchmarks, and evaluation tools publicly so others can verify and extend them [4].
The checklist takes an hour to apply at the start of a project and saves weeks at the revision stage.
Common Mistakes and Limitations
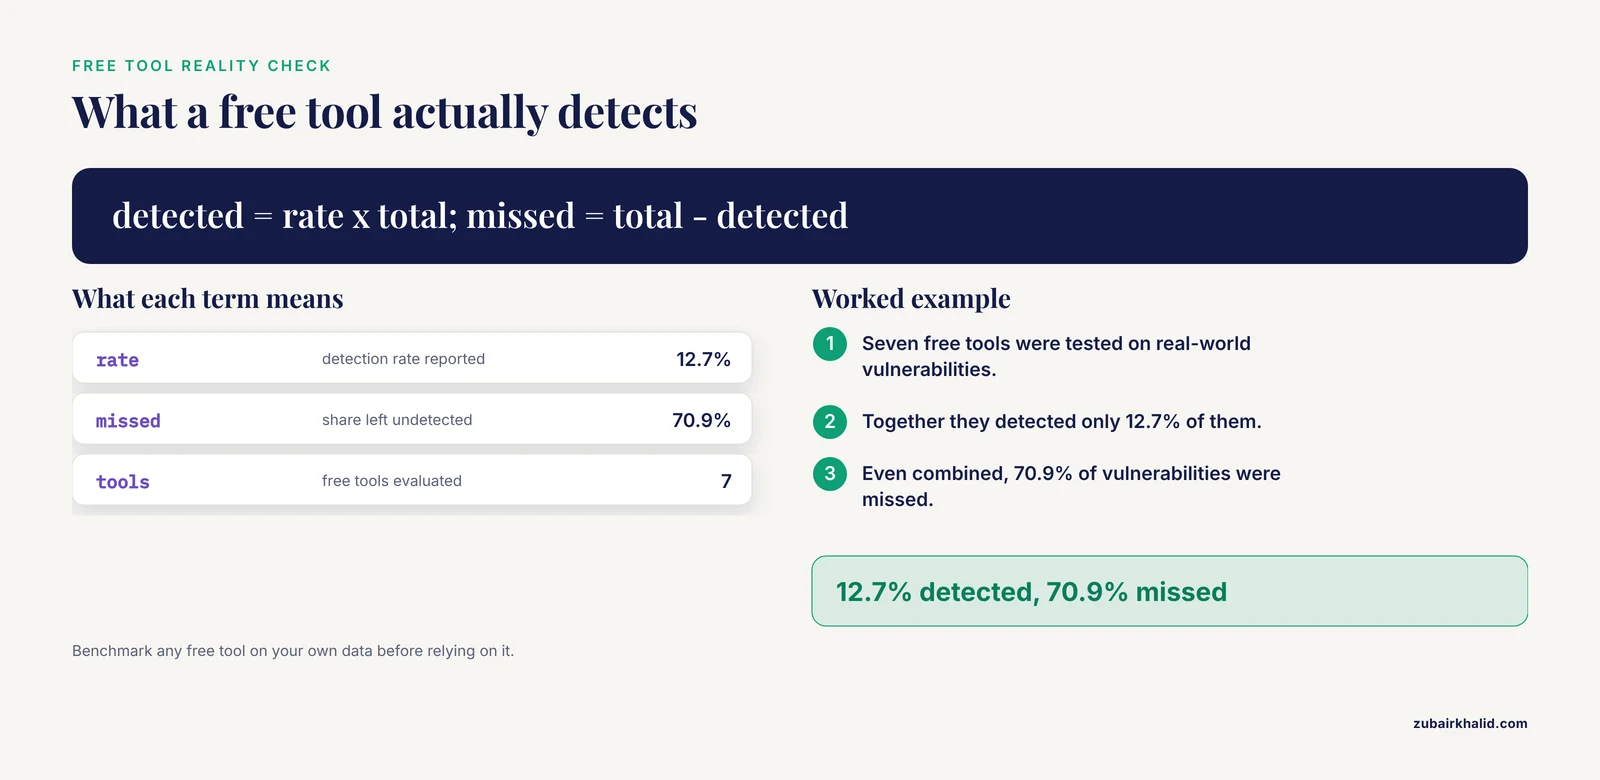
- Assuming free means validated. The security testing evaluation is the sharpest warning available: seven free and open-source tools with existing detection rules detected only 12.7% of real-world vulnerabilities, and 70.9% remained undetected even when the tools were combined [10]. Benchmark your free tool on data you trust before you rely on it.
- Trusting one tool's output as ground truth. In copy number variation calling, consistency across six callers and three orthogonal methods was needed to define a high-confidence result set, because individual tools misjudged genome ploidy and called spurious changes [7]. Single-tool results deserve skepticism in any field with multiple competing implementations.
- Reading too much into synthetic benchmark performance. Tools that perform well on synthetic benchmarks can fail on real-world data, the exact gap documented for security testing tools [10]. Ask whether a reported evaluation used synthetic or real data.
- Comparing methods without a common codebase. Performance gains that disappear under standardized preprocessing, encoders, and training conditions reflect implementation differences rather than real advances. If no unified codebase exists in your field, treat cross-paper comparisons cautiously.
- Evaluating against a moving target. Benchmarks that depend on live, opaque web services cannot support fair or reproducible comparison because the underlying corpus changes without notice. Prefer static, curated corpora for anything you intend to publish.
- Confusing a good checklist score with good science. CLEAR and RQS measure how completely a study reports its methods, and a high score cannot rescue a flawed design [6].
- Treating GUI-based surveys as automatically consistent. Conventional survey platforms produce forms that look consistent but differ in structure, validation, and export behavior, which is the specific inconsistency ReproSchema was built to remove [1].
- Ignoring the hidden costs of free. Open-source tools carry no license fee but do require maintenance, hosting, and training. Plan for staff time the way you would plan for a license fee.
One further limitation applies to any tool choice. Reproducibility tooling makes your methods transparent and rerunnable. It cannot fix a weak study design, and individual research decisions still require domain expertise and, in clinical contexts, appropriate professional judgment.
Frequently Asked Questions
What are the best free reproducibility tools for research?
There is no single best tool because each one standardizes a different step. ReproSchema leads for standardized survey data collection, Freva for logged and rerunnable model evaluation, open-source R Shiny dashboards for code-free analysis, fixed-corpus benchmarks and unified baseline codebases for fair computational comparison, and quality checklists such as CLEAR-RQS for structured reporting. Match the tool to the step where your results are most likely to drift.
Are free reproducibility tools as reliable as commercial ones?
Reliability varies by tool, not by price. Free open-source tools can be excellent, but they must be evaluated on real-world data rather than assumed to work, since published evaluations of free tools have documented large gaps between synthetic benchmark performance and real-world performance [10]. Check for published benchmark results, an active user community, and recent maintenance before adopting.
What is a reproducibility checklist?
A reproducibility checklist is a structured list of items a study must report or perform so that others can repeat it. In radiomics, the CLEAR and RQS frameworks were merged into a 61-item CLEAR-RQS checklist covering methods reporting, open-source availability, and phantom calibration, and reviewers used it to score published studies item by item [6]. You can apply the same pattern to any field by listing the details a stranger would need to rerun your work.
Can I use free reproducibility tools without knowing how to code?
Yes, for some of them. The GBD Analysis Suite provides 11 analytical modules through a code-free web interface that accepts uploaded data, and Freva offers a web environment alongside its shell interface [3]. Schema-based tools such as ReproSchema demand more technical comfort, so teams without programmers should favor dashboard-style options or pair with a computational collaborator.
How do free and low-cost reproducibility tools differ from paid platforms?
The main differences are transparency, portability, and where the cost lands. Free open-source tools expose their methodology for inspection, release their benchmarks and code publicly to invite community-driven improvement, and charge no license fee, while the real costs shift to staff time, hosting, and training [4]. Paid platforms typically bundle support and polished interfaces but can lock your data and instruments into proprietary formats.
How do I make an existing project reproducible without adopting a new platform?
Start with the habits rather than the software. Fix and document your dataset versions, pin your software environment, write down the exact sequence and parameters of every analysis step, store your evaluation data as a static corpus rather than a live source, and score your reporting against a domain checklist before submission [6]. These steps require no new software and deliver most of the reproducibility benefit on their own.
Sources
- Standardizing Survey Data Collection to Enhance Reproducibility: Development and Comparative Evaluation of the ReproSchema Ecosystem
- Introduction to Freva - A Free Evaluation System Framework for Earth System Modeling
- Open-Source R Shiny Dashboard (Global Burden of Disease Analysis Suite) for Multimethod Burden of Disease Research: Development and Evaluation Study.
- BIGOS V2 Benchmark for Polish ASR: Curated Datasets and Tools for Reproducible Evaluation
- Gloss-free Sign Language Translation: An unbiased evaluation of progress in the field
- Post-radiotherapy stage III/IV non-small cell lung cancer radiomics research: a systematic review and comparison of CLEAR and RQS frameworks
- Evaluation of somatic copy number variation detection by NGS technologies and bioinformatics tools on a hyper-diploid cancer genome
- In-depth analysis of data characteristics and comparative evaluation of dda and dia accuracy in label-free quantitative proteomics of biological samples
- Comparative evaluation of approaches & tools for effective security testing of Web applications
- Comparison and Evaluation on Static Application Security Testing (SAST) Tools for Java