What Is a Good Data Citation Count? A Benchmarking Guide
By Dr. Zubair Khalid, DVM, MS, PhD ·

A good data citation count is a count that sits above the median for datasets comparable to yours in field, deposit year, and repository, and no fixed universal threshold exists. Because most datasets are never formally cited at all, a small count that keeps growing year over year already signals genuine reuse.
That answer frustrates people who want a number they can write on a grant application. The frustration is misplaced, because a raw count without context is close to meaningless. This guide explains what data citation counts measure, why they run low, how data citation count benchmarks are built and interpreted, and what published research on research data sharing reveals about realistic reuse. It closes with the mistakes that most often distort these judgments.
What a Data Citation Count Actually Measures
A data citation is a formal reference to a dataset in the reference list of a scholarly publication, usually pointing at a DOI. A DOI (digital object identifier) is a persistent alphanumeric string that resolves to the dataset's landing page regardless of where the data is hosted. The count displayed on a repository page is the number of publications that the repository, or the systems it exchanges records with, has linked to that DOI.
That pipeline has many joints, and each joint can leak. An author saves the dataset DOI in a reference manager, the publisher typesets the reference, an aggregator harvests it, the DOI registration agency records it, and the repository displays the total. When a repository curator traced one citation through that entire chain, the trail broke repeatedly, with mismatches surfacing in reference managers, publisher systems, aggregators, and the DOI minter [1]. Any single displayed count is therefore a floor rather than a ceiling.
Data citations also differ from usage metrics. Downloads, views, and API calls measure interest. A formal citation measures reuse that a researcher was willing to attach their name to in print. For repositories that let anyone download without logging in or supplying an email address, no usage record exists at all, which leaves formal citations as the main surviving evidence that a dataset was reused [1].
Why Most Datasets Receive Few or Zero Citations
The most common myth is that a good dataset should collect citations the way a good paper does. The mechanics say otherwise. Statisticians who model patent citations run into a pattern called zero inflation. A zero-inflated count distribution contains far more zeros than a standard Poisson or negative binomial model predicts, and patent citation studies fit zero-inflated models for exactly this reason [2]. Dataset citations behave the same way, usually more so, for three reasons.
First, the norm of citing data formally is young. Many papers still describe, reanalyze, or build on a dataset without ever adding its DOI to the reference list. Second, the harvesting systems that convert references into citation events are incomplete, as the traced citation study demonstrated [1]. Third, counts need time. Research on paper citations identifies an aging effect, in which citations accumulate for years before tapering, alongside a recency effect that favors newly visible work. A dataset deposited two years ago with two citations may be on a normal trajectory rather than a failing one.
A compounding dynamic sits on top of these factors. The Matthew effect, named for the observation that the rich get richer, describes how already visible papers and datasets attract new citations at higher rates, widening gaps over time. Early visibility compounds, so two datasets of identical quality deposited in the same year can finish an order of magnitude apart.
What Data Citation Count Benchmarks Mean
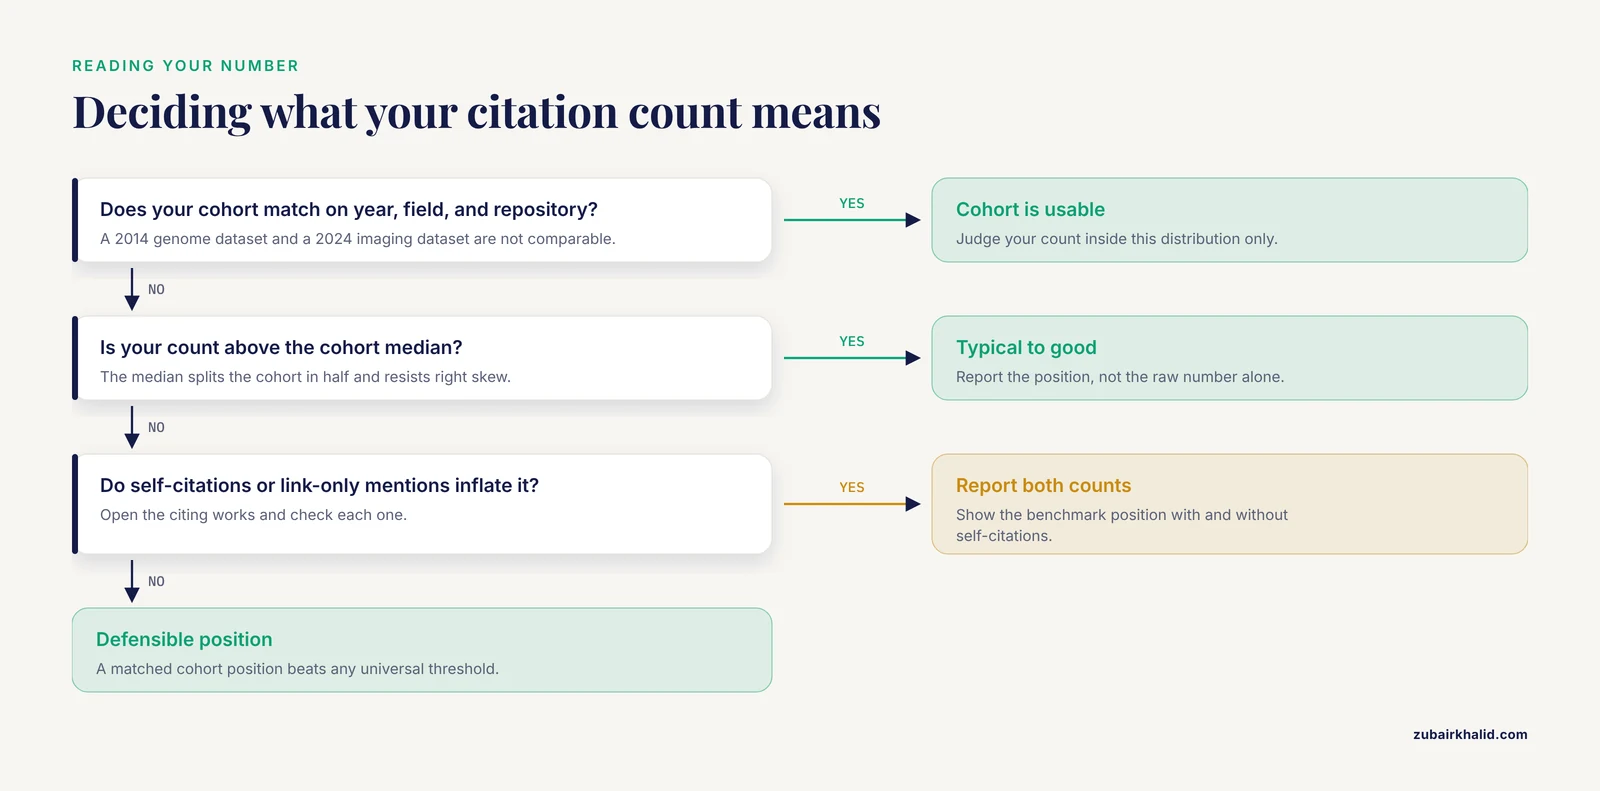
A benchmark is a reference distribution built from comparable items, used to judge whether one item's number is low, typical, or high. For paper citations, fields and career stages differ so much that benchmarks are built within narrow strata. A 2025 study of Australian law researchers, for instance, reported h-index and raw citation count benchmarks separately by academic position, using Google Scholar records captured in September 2024, while flagging the limits of Google Scholar as a measurement source [3]. The h-index, for readers new to it, is the largest number h such that a researcher has h publications with at least h citations each.
Data citation count benchmarks mean the same construction applied to datasets. You assemble every dataset that resembles yours in subject, repository, and deposit window, pull their citation counts from one consistent source, and locate your dataset inside that distribution. Four terms carry the interpretation:
- The median is the middle value, so half the cohort sits above it and half below.
- Quartiles split the cohort into four equal bands, and the 75th percentile marks the entry point of the top quarter.
- The top decile is the highest 10 percent.
- Right skew means a long tail of high values pulled upward by a few heavily reused items, which is why the median describes a citation distribution better than the mean does.
Because of right skew, a dataset can sit far above the median yet still below the mean, and both facts are informative. Benchmarks for data lag behind benchmarks for papers because data citation norms and infrastructure are younger, which means every dataset benchmark you build today is something you construct yourself.
How to Build a Fair Benchmark for Your Dataset
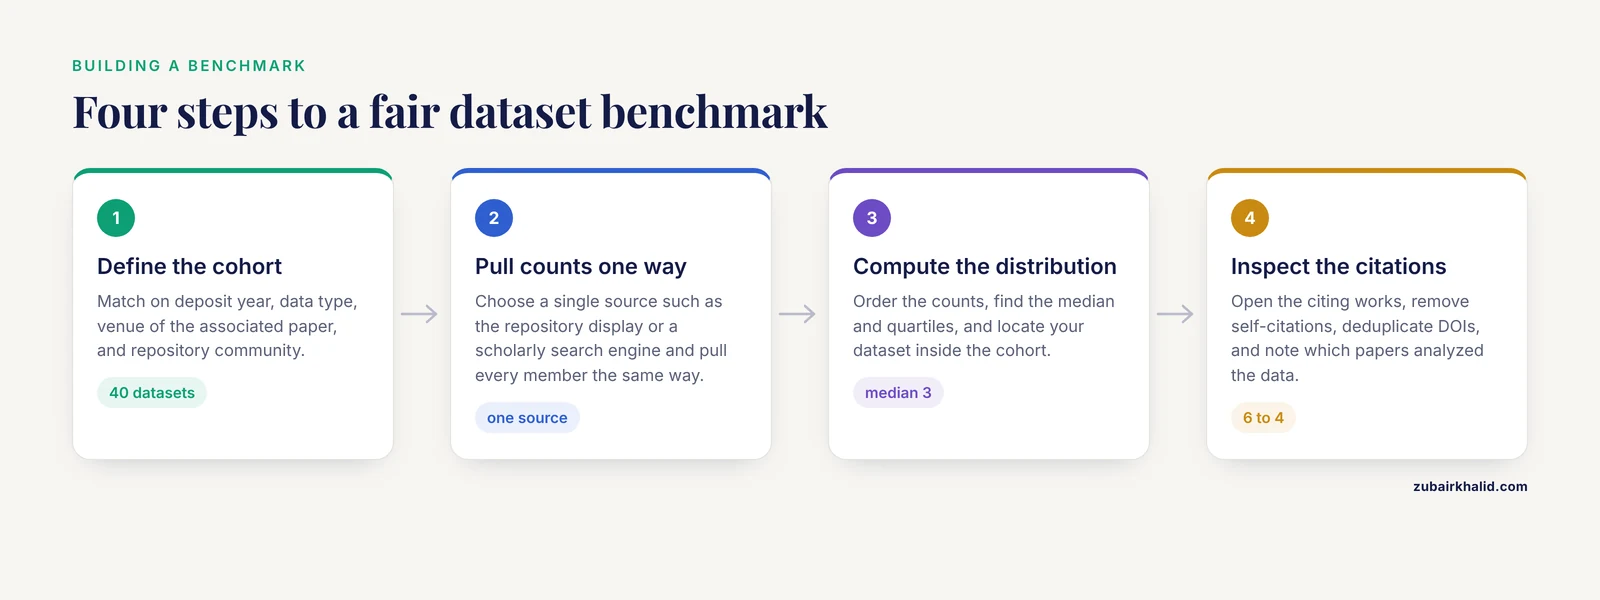
This is the interpretation layer, where data citation count benchmarks turn from a concept into a procedure.
Step 1: Define the cohort
Match on the variables that demonstrably move citation counts, which include publication year, authorship patterns, publishing venue, and subfield [4],. For datasets, the practical equivalents are deposit year, data type, the venue of the associated paper, and the repository community. A genomics dataset deposited in 2016 and an imaging dataset deposited in 2024 live in different citation economies and must not share a benchmark.
Step 2: Pull counts from one consistent source
Choose a single source, such as the repository's own citation display or a scholarly search engine, and pull every cohort member the same way. Mixing sources inflates some members and deflates others, because the systems disagree with one another.
Step 3: Compute the distribution and place your dataset
Order the counts, find the median and quartiles, and locate your dataset. Adjust for age by comparing within deposit year bands, or by dividing each count by years since deposit.
Step 4: Inspect the citations themselves
Open the citing works. Remove self-citations, deduplicate DOIs that appear in variant forms, and note which citations come from papers that analyzed the data rather than merely linking it. Aggregated numbers compress away exactly this detail, which is why visualization researchers built interactive tools to decompose citation impact by research area, time, and collaborator in the first place [5].
A worked example
Suppose you deposited a transcriptomics dataset in 2021 and the repository shows 6 citations. You identify 40 datasets of the same data type in the same repository community deposited between 2020 and 2022, pull counts from one aggregator, and find values from 0 to 14 with a median of 3. Your dataset sits near the 75th percentile of its cohort, which reads as above typical for its field, age, and venue. If two of the six are self-citations, your independent count of 4 still clears the median. That is what a good data citation count looks like in practice, a defensible position within a matched cohort rather than a magic number.
The table condenses the interpretation into bands you can defend.
| Position in the matched cohort | Reasonable reading | Main caveat |
|---|---|---|
| Zero | Common, especially for recent deposits or datasets without a DOI | Displayed counts undercount real use [1] |
| 1 to 5 with year over year growth | Evidence of genuine reuse, above the floor | One or two may be self-citations or link-only mentions |
| Above the cohort median | Typical to good for the field and deposit year | The cohort must match on year, venue, and repository |
| Top quartile | Strong performance | Right skew puts the top quartile far above the median |
| Top decile | High impact dataset | Compounding visibility effects widen gaps over time |
Published Reference Points from Data Sharing Research
Few studies publish dataset level citation distributions, but research on structured data sharing programs offers usable anchors.
A cross sectional study in The BMJ examined clinical trials that shared individual participant data (IPD, the deidentified row level records behind a trial's results) through the Yale University Open Data Access (YODA) Project platform. Among 336 eligible trials, 265, or 79 percent, had at least one associated secondary publication, generating 1,167 secondary publications in total through June 2025 [6]. External investigators produced 209 of those publications, 17.9 percent, and among external publications with a reported data access mechanism, 161 of 190, or 85 percent, obtained the data through data sharing platforms, primarily YODA [6]. The study measured scholarly impact with journal impact factor, annual citation counts, and annual Altmetric Attention Scores [6].
The benchmarking lessons are concrete. Reuse was common across the portfolio when sharing was structured and supported. External reuse was a minority of total secondary output, which means a dataset's citation count understates total reuse whenever internal reanalyses dominate. These are portfolio level rates rather than per dataset citation counts, so use them to calibrate expectations about whether reuse happens, not to grade any single deposit. The metrics that captured impact in that study, citations plus attention scores, are the same ones you can assemble for any dataset cohort.
What Raises and What Distorts Data Citation Counts
Factors that raise counts
Timing, authorship, venue, and methodology all move citation counts. In a bibliometric study of library and information science articles published by Pakistani authors between 2001 and 2016, publication year shaped citation shares, faculty authored and collaboratively written articles earned significantly more citations, articles in impact factor, international, and subscription journals outperformed the rest, and empirical, quantitative work using inferential statistics gained an edge [4].
Visibility activity correlates with citations as well. Across 396 shoulder and elbow surgery articles published in 2018 and assessed 34 to 45 months after print publication, 51 percent had at least one Twitter mention, and mention counts correlated with citation counts [7]. Reader based metrics behave similarly. In an analysis of 61 highly cited articles from three top tier library and information science journals, both the Altmetric Attention Score, a composite measure of online attention, and Mendeley readership correlated positively with citation counts, with the readership correlation the stronger of the two [8]. These are correlations rather than levers, but they show that a dataset wrapped in an actively read and discussed paper starts with an advantage.
Factors that distort counts
Affiliation bias concentrates citations toward prestigious institutions and countries. An analysis of bioRxiv preprints and their published versions measured citation inequality with the Lorenz curve and the Gini coefficient, a standard inequality score running from 0 for perfect equality to 1 for maximal concentration, and found consistently higher Gini coefficients for preprints than for publisher versions. Citation bias by affiliation is therefore real, and it bites harder earlier in the publication cycle, exactly where many datasets first appear.
The Matthew and recency effects compound early advantage, as described above. Aggregation gaps suppress counts unevenly, so two identical datasets can display different numbers on different systems [1]. Raw counts also compress the information that matters, obscuring which community cites a work, when, and through which collaborations [5].
What does not necessarily move counts
Post-publication commentary has weaker effects than many assume. In a matched analysis of papers discussed on Publons, papers that received neutral, negative, or mixed post-publication peer reviews showed no significant citation differences from matched controls [9]. A critical comment thread is not, by itself, a citation killer.
Research Data Sharing and Repository Comparison
Because data citation counts depend on plumbing as much as merit, repository choice is part of the benchmark. Score any candidate repository on five features.
- Persistent identifier. Does the repository mint a DOI for each dataset, so citations resolve to a stable target?
- Citation event registration. Does the repository push citation metadata to the DOI so aggregators can harvest it, or does it rely on manual curation?
- Access model. Open downloads without login or email maximize reuse but leave no usage record, which makes formal citations the only trace of uptake [1].
- Discovery integration. Does the repository surface datasets through the aggregators and reference managers that authors actually use, since a break anywhere in that chain loses citations [1]?
- Curation and request management. Curated platforms review access requests and document who took what, trading some discoverability for controlled, documented reuse.
The YODA model shows the curated end of that spectrum. A platform that reviews requests and releases IPD to approved external investigators concentrated reuse effectively, with most external secondary publications that reported an access mechanism obtaining data through data sharing platforms [6]. A generalist repository maximizes discoverability, while a curated platform maximizes documented reuse. Many data sharing strategies use both, depositing the canonical dataset in a generalist repository and managing sensitive data through a controlled platform.
Data Citations in Hiring, Tenure, and Funding
Citation counts already carry weight in career evaluation, which makes benchmarking an ethical issue as well as a technical one. In an analysis of political science PhD granting departments covering 2002 to 2017, citation counts entered the analysis of job mobility, tenure, and promotion, and women were consistently less cited than men, with some gender differences shrinking once citation counts were controlled [10]. The 2025 Australian law benchmarking study framed its position level tables as guidance for a sector shifting toward more nuanced assessment, while warning about the limits of Google Scholar and reflecting on how bibliometrics sit inside the pressures of the modern university [3].
For data citations, the honest position is that widely adopted dataset level benchmarks do not yet exist for most fields. If you present data citations in a promotion case or a grant application, bring the cohort distribution with you. A claim that a dataset has 12 citations means little in the abstract. A claim that it sits in the top quartile of 40 comparable datasets from the same repository and era is interpretable by any committee.
Common Mistakes and Limitations
- Comparing across mismatched cohorts. A 2014 genome dataset and a 2024 imaging dataset live in different citation economies, so match on year, field, and repository before judging.
- Trusting a single system's count. The same dataset can show different numbers on the repository, in search engines, and in aggregators, because the citation pipeline leaks at multiple joints [1].
- Reading zero as failure. Zero inflated distributions make zero the modal outcome for young and lightly indexed datasets.
- Confusing downloads with citations. Downloads measure interest, citations measure named reuse, and repositories without access controls cannot track usage at all [1].
- Ignoring composition. Self-citations, duplicate DOIs, and link-only mentions inflate raw counts, and aggregated numbers hide the detail needed to spot them [5].
- Treating altmetrics as substitutes. Twitter mentions and Mendeley readership correlate with citations but measure different behaviors, so use them as supplements rather than replacements [7], [8].
- Assuming citations measure quality. Counts respond to affiliation, visibility, and timing as much as to merit,.
- Expecting one number to settle an individual case. Promotion committees, funders, and editors weigh datasets differently, so individual decisions deserve tailored judgment from mentors or the relevant evaluation office rather than a threshold applied from outside.
What Remains Uncertain
Three gaps stand out. First, dataset level benchmarks comparable to the position stratified tables now available for paper citations in at least one field [3] do not yet exist for most sciences, so every benchmark you build is bespoke. Second, citation prediction remains an active but imperfect science, with neural network models forecasting journal level citation counts and CiteScores one year ahead and time series models projecting paper level accrual [11], yet all carry error that grows with the time horizon. Third, the undercounting problem has no systemic fix yet, since the breaks traced between repositories, publishers, aggregators, and DOI minters persist [1]. As funder and journal policies push more researchers toward research data sharing, counts should rise, but how quickly and how evenly remains unknown.
Frequently Asked Questions
What is a good data citation count for a dataset?
There is no universal threshold. A good count is one above the median for datasets matched to yours in field, deposit year, and repository, and any sustained nonzero count already beats the many datasets that are never formally cited.
What does a data citation count benchmark mean?
It means a reference distribution, such as a median and quartiles, built from comparable datasets and used to judge whether one dataset's count is low, typical, or high. The comparison cohort matters more than the raw number.
Why does my dataset show different citation counts on different platforms?
Because each platform harvests citations through its own pipeline, and those pipelines break in different places, including reference managers, publisher systems, aggregators, and DOI registration. Treat every displayed count as an undercount.
How long does it take for a dataset to accumulate citations?
Citations accrue over years, following the aging pattern seen in paper citations, and early visibility compounds through Matthew effects. A young dataset with few citations may be on a normal trajectory.
Do downloads and views count as data citations?
No. Downloads and views are usage metrics that measure interest, while a data citation is a formal named reference in a publication. They complement each other and should not be added together.
Do data citations count toward my h-index?
Standard h-index calculations are built on paper citations, and published career benchmarks are likewise built on publication records rather than datasets. Present data citations separately, with cohort context.
Can I cite my own dataset, and does it help?
Yes, formal self-citation of your dataset is legitimate and improves discoverability. Count it, but report your benchmark position with and without self-citations so the independent reuse is visible.
Which repository should I choose to maximize citability?
Choose one that mints a DOI, registers citation events, integrates with the aggregators and reference managers your field uses, and matches your access needs. For sensitive data such as clinical trial records, a curated sharing platform adds documented, controlled reuse.
Sources
- If Data is Used in the Forest and No-one is Around to Hear it, Did it Happen? a Citation Count Investigation
- An in-depth empirical analysis of patent citation counts using zero-inflated count data model: The case of KIST
- Benchmarks for Australian Law Researchers’ H-Index and Citation Count Bibliometrics
- Impact of research characteristics and methodologies used in LIS articles on citation count
- Visualizing Research Impact through Citation Data
- Secondary use and scholarly impact of a portfolio of clinical trials with shared individual participant level data: cross sectional study.
- Twitter Mentions Influence Academic Citation Count of Shoulder and Elbow Surgery Publications
- Unwrap citation count, Altmetric Attention Score and Mendeley readership status of highly cited articles in the top-tier LIS journals
- The relationship of polarity of post-publication peer review to citation count: Evidence from Publons
- Job Mobility, Tenure, and Promotions in Political Science PhD-Granting Departments, 2002-2017: Cohort, Gender, and Citation-Count Effects
- Citation Count Prediction Using Different Time Series Analysis Models