Customizing Project Trackers for Research: Step-by-Step Guide
By Dr. Zubair Khalid, DVM, MS, PhD ·

By the end of this guide you will be able to design, build, and maintain a project tracker that fits an actual research workflow, not a generic business template. You will map your study stages, define a data dictionary, build status logic you can query, set access rules, and roll the tracker out to a team that keeps using it after week two.
Have on hand:
- A list of your active projects or studies with their current stage
- A spreadsheet program (Excel, Google Sheets, or LibreOffice Calc) or, if your institution provides it, a research data platform such as REDCap
- Python 3 with pandas installed if you want the queryable version
- Names and roles for everyone who will touch the tracker
No paid software is required. Everything below works in a spreadsheet, and the same design principles scale up to institutional platforms.
Why Research Trackers Break, and How to Avoid It
Generic task boards assume projects move linearly through a handful of stages. Research does not. A typical study stalls at ethics approval, loops back from analysis to collection, and waits months on a co-author's revision. When a tracker built for marketing campaigns is forced onto that reality, fields go stale and the team stops trusting it.
Evidence from research operations backs this up. A process mapping study of a quality improvement collaborative in Argentine intensive care units documented eleven stages of the research process, from question formulation to dissemination, and estimated roughly 1,020 person-hours of total effort. The stages rated most difficult were ethical and institutional approvals, data collection, analysis, and dissemination, which together accounted for about half of that effort [1]. A tracker that cannot represent those specific chokepoints, with their waits and rework loops, will mislead you.
Successful research groups tend to build tracking into their structure rather than bolt it on. A student research initiative at a new medical college, GENESIS, made a research tracker one of its four core strategies, alongside journal clubs, a project matchmaker, and alumni mentoring, specifically to improve the sustainability of student projects [2]. A hospital nursing research center built a project engagement tracker in REDCap six years ago and still runs it as a living database, using customized reports to manage daily operations and demonstrate value to stakeholders [3]. The common thread is deliberate customization around the group's actual work.
Customizing Project Trackers for Research Step by Step
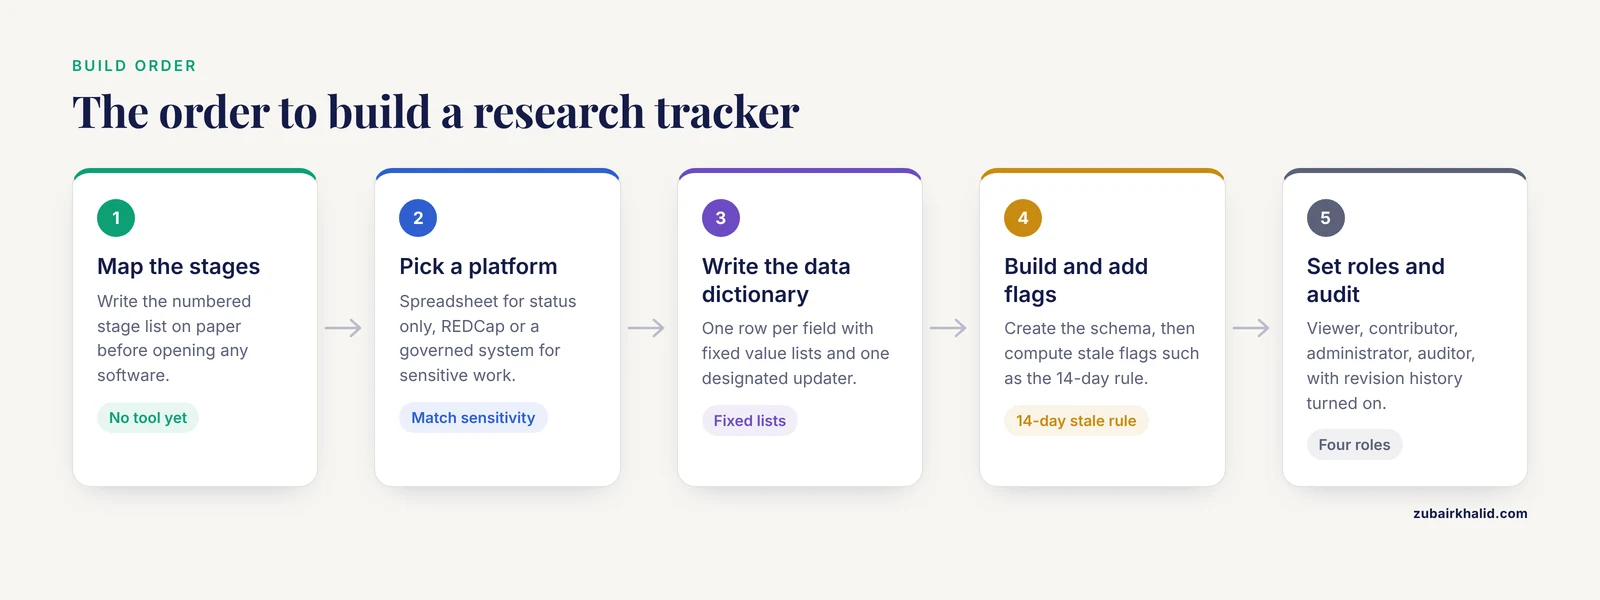
Step 1: Map Your Research Stages Before You Touch Any Tool
Write down every stage your projects actually pass through. For most biomedical and social science studies this looks something like:
- Concept and literature scoping
- Protocol drafting
- Ethical and institutional approvals
- Data collection
- Data cleaning and analysis
- Reporting and dissemination
- Closed and archived
Use the Argentine process mapping study as a sanity check. Its eleven mapped stages, and its finding that approvals, collection, analysis, and dissemination dominate effort, are a reasonable template for where your tracker needs the most granular fields [1]. If you run multi-site work, add site-level fields now. A regional vector-control workshop covering 13 South American countries found that coordinating surveillance and research priorities across institutions was itself a central challenge, which is exactly the problem shared status fields solve [4].
Deliverable: a numbered stage list, written on paper, before any software is opened.
Step 2: Choose a Platform Matched to Your Data Sensitivity
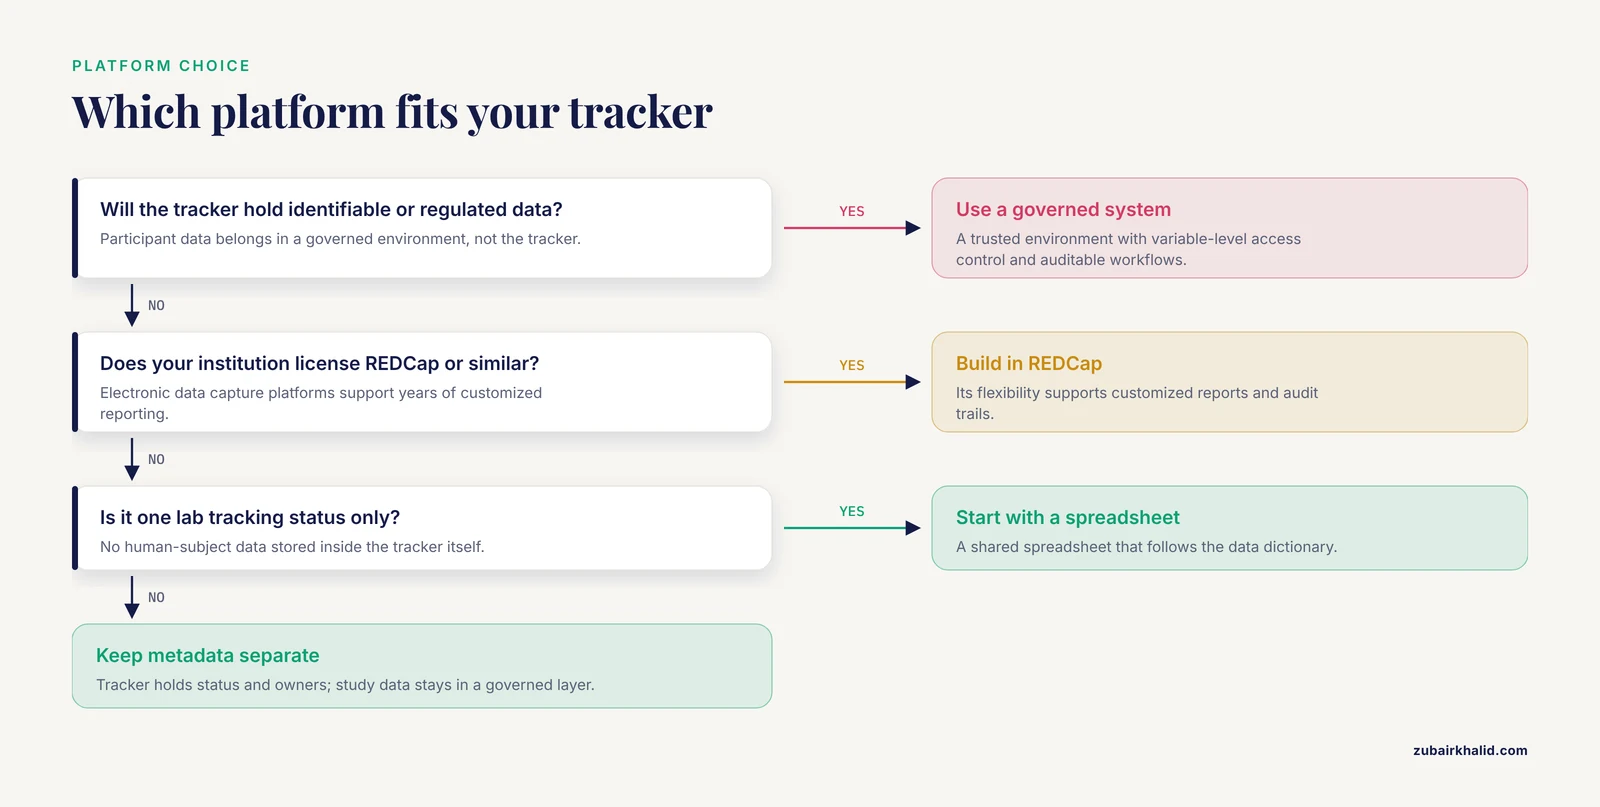
Your choice depends on what the tracker must hold and who must see it.
- Plain spreadsheet. Fine for a single lab tracking project status with no human-subject data in the tracker itself.
- REDCap. A secure electronic data capture platform widely used in academic health systems. One pediatric nursing research center used REDCap's flexibility to build a project engagement tracker capturing consultation requests and consultant activity across a large health system, then generate customized reports from it [3].
- National or enterprise systems. Implementation research on WHO SMART Guidelines digital adaptation kits studied country-customized deployments in Ethiopia (Bahmni) and Ghana (DHIS2 tracker), where the formative phase focused on customizing the digital adaptation kit content to align with national protocols before integration [5]. The lesson generalizes: customize a proven core system rather than building from zero when stakes are high.
- Trusted collaboration environments for sensitive data. For regulated or identifiable health data, systems such as TRACE (Trusted Research Access and Collaboration Environment) are designed around FAIR data sharing with variable-level access control, auditable and reproducible workflows, and provisioning into a sealed analysis environment [6].
A practical rule: keep your tracker metadata (project status, milestones, owners) in one layer, and keep sensitive study data in a governed layer. Never paste identifiable participant data into a lightweight tracker built to answer "where is this project?"
Step 3: Define a Data Dictionary Before Building Fields
A data dictionary is a documented list of every field, its allowed values, and who updates it. The WHO SMART Guidelines initiative treats the data dictionary as a foundational component of its digital adaptation kits, precisely because encoding guidelines into digital systems fails without precise, shared definitions [5].
Write one row per field. Example for a lab tracker:
field_name          type      allowed_values                     updated_by
project_id          text      PRJ-### pattern                    system
title               text      free text, max 80 chars            lead
lead                text      team roster names                  PI
stage               list      concept|protocol|approval|         lead
                              collection|analysis|
                              dissemination|closed
approval_date       date      YYYY-MM-DD                         admin
open_milestones     integer   0 to 99                            lead
days_since_update   integer   computed                           system
sensitive_data      yes/no    yes|no                             admin
next_action         text      one sentence                       lead
next_action_due     date      YYYY-MM-DD                         lead
Two rules that prevent most tracker rot:
- Every categorical field gets a fixed value list. Free-text stage fields become "data collection," "Data Collection," "collecting," and "fieldwork" within a month.
- Every field has exactly one designated updater.
Step 4: Build the Tracker and Add Status Logic
Create the file with your schema as the header row:
project_id,title,lead,stage,approval_date,open_milestones,days_since_update,sensitive_data,next_action,next_action_due
PRJ-014,Gut microbiome pilot,rivera,analysis,2026-03-02,3,9,yes,Finalize sequencing vendor quote,2026-11-15
PRJ-015,Survey wave 2,okafor,collection,2026-04-18,6,1,yes,Submit IRB addendum for site 2,2026-11-13
PRJ-016,Protein assay validation,chen,protocol,,2,0,no,Draft protocol section 4,2026-11-12
PRJ-011,Archived pilot 2025,garcia,closed,2025-06-10,0,31,no,,,
Then add computed fields. In a spreadsheet, flag stale projects with:
=IF(AND($G2>=14,$D2<>"closed"),"REVIEW","")This prints REVIEW in the flag column for any project not marked closed with 14 or more days since the last update. Adjust the 14 to your team's update cadence.
In Python, build a weekly status summary with pandas:
import pandas as pd

projects = pd.read_csv("research_tracker.csv")

stage_order = ["protocol", "approval", "collection",
               "analysis", "dissemination", "closed"]
projects["stage"] = pd.Categorical(
    projects["stage"], categories=stage_order, ordered=True
)

summary = projects.groupby("stage", observed=True).agg(
    n_projects=("project_id", "count"),
    open_milestones=("open_milestones", "sum"),
    oldest_update_days=("days_since_update", "max"),
)
print(summary)
Expected output:
                n_projects  open_milestones  oldest_update_days
stage
protocol                 1                2                   0
approval                 0                0                   0
collection               1                6                   1
analysis                 1                3                   9
dissemination            0                0                   0
closed                   1                0                  31
This one table tells you where work is piling up and which projects have gone quiet, which is the entire job of a tracker.
Step 5: Configure Roles, Access, and Audit Trails
Assign four role types, even in a spreadsheet:
- Viewer. Can read, cannot edit.
- Contributor. Can update their own projects' rows.
- Administrator. Can edit the schema and all rows.
- Auditor. Can read and export, typically for oversight or funder reporting.
For sensitive data, role design becomes a compliance requirement rather than a convenience. TRACE was built specifically to give institutions granular, variable-level access control with auditable workflows, supporting reproducibility at the level of both data and analysis code [6]. Even if you use simpler tools, copy the principle: record who changed what and when. Google Sheets and most research platforms log revision history natively, so turn that on and never delete rows, only mark them closed.
Step 6: Prototype, Get Feedback, and Simplify
Do not roll out version one to the whole team. Build a low-fidelity prototype, show it to two or three future users, and revise. This mirrors how mobile health tool designers work: a tuberculosis treatment support app team used iterative prototyping cycles, soliciting expert feedback on low-fidelity prototypes before building high-fidelity versions [7].
The specific recommendations from that expert review translate directly to trackers [7]:
- Simplify reporting by offering broad categories instead of dozens of narrow ones
- Split complex screens so each view answers one question
- Add clear navigation and a main menu or home view
- Make the most-used view the default (for them, the medication tracker was the homepage, for you it is probably the active-projects view)
- Include short instructions for each task that collapse once read
- Limit redundancy between fields
Trackers also benefit from institutional memory about what went wrong. In a large gaze-tracking study with 450 deaf and 450 hearing participants, the research team deliberately reviewed staff notes and observations from team meetings to extract lessons learned and best practices for the protocol [8]. Schedule a short tracker retrospective after your first month: what fields did people ignore, which ones did they invent on their own, and which view did they open first? Fold the answers into version two.
Step 7: Onboard the Team So the Tracker Actually Gets Used
Customization is only half the battle. Adoption is social. Design-based research on collaborative learning found that collaboration does not emerge automatically, it depends on psychological safety, guided mediation that redistributes participation, and scaffolded interaction [9]. Translate those findings into tracker onboarding:
- Emotional safety. State explicitly that a stale or honest row is better than a falsely green row. Nobody gets criticized for logging a delay.
- Guided mediation. The PI or lab manager runs the first three weekly reviews, modeling how to read and update the tracker, then hands the ritual to rotating team members.
- Scaffolded interaction. New members get a one-page field guide (your data dictionary from Step 3) and update only their own projects for the first two weeks.
For multi-institution scientific collaboration, agree in writing on the shared stage names and update cadence before launch. The South American insecticide-resistance workshop showed that regional collaboration advances fastest when partners align on shared priorities and terminology up front, rather than reconciling mismatched systems later [4].
Step 8: Add Stakeholder Views and Reporting
A research tracker should produce at least two reports beyond the working view:
- Weekly operations report. The pandas summary or pivot table from Step 4, sorted by stalest first.
- Stakeholder impact report. Counts of active projects, projects closed this quarter, and outputs, used to communicate value to department heads and funders.
The pediatric nursing research center's REDCap tracker exists largely for this second purpose, letting administrators summarize consultant engagement across projects and communicate reach and value both internally and externally [3]. If your work involves patients or community partners, consider giving them a genuine input channel into what gets tracked. The patient advocacy literature in hepatology emphasizes integrating patient perspectives into research design and decision making, and participatory approaches in mental health systems research similarly build stakeholder engagement directly into planning processes [10] [11]. A simple "community advisor review" milestone field costs nothing and keeps that commitment visible.
Step 9: Maintain the Tracker as a Living Document
Set a fixed review rhythm:
- Daily by contributors. Update
next_actionanddays_since_updateon their own projects. - Weekly by the team. Fifteen-minute review of the status summary, stale flags first.
- Quarterly by the administrator. Merge duplicate fields, retire unused ones, and re-baseline stage definitions.
The GENESIS initiative's tracker survives because the student committee treats it as part of the initiative's core structure, reviewed and sustained across cohorts [2]. Your tracker should outlive any single project.
Key Configuration Options at a Glance
| Design choice | Recommended option | Why it matters |
|---|---|---|
| Stage taxonomy | 6 to 8 fixed values, stored as a list | Prevents free-text drift [5] |
| Field naming | snake_case, one owner per field | Enables filtering and automation |
| Default view | Active projects, stalest first | Mirrors "most-used screen first" design advice [7] |
| Status logic | Computed flags, for example 14-day stale rule | Surfaces problems without meetings |
| Access control | Four roles, variable-level for sensitive data | Matches trusted environment practice [6] |
| Sensitive data | Kept out of the tracker, linked by project ID | Separates operations from regulated data |
| Feedback loop | Prototype, expert review, revision cycle | Validated design workflow [7] |
| Reporting | Weekly ops summary plus quarterly impact report | Serves both management and funders [3] |
| Retrospectives | Monthly meeting notes review for lessons learned | Proven in large multisite protocols [8] |
Common Mistakes and Limitations
Building the tracker before mapping the stages. Teams that open the software first end up with generic fields that ignore their real bottlenecks, which the process mapping work shows are approvals, collection, analysis, and dissemination [1].
Free-text status fields. Any stage field without a fixed value list fragments within weeks. Enforce dropdowns or a strict vocabulary.
Storing participant data in the tracker. A tracker is an operational tool. Identifiable or regulated study data belongs in a governed environment with access control and audit capability, the standard that systems like TRACE were designed to meet [6].
Too many fields. Expert reviewers of a health intervention app repeatedly asked for simpler screens, broader categories, and fewer redundancies [7]. If a field has not been read in three months, delete it.
No single owner per field. When anyone can update anything, updates stop. Assign one updater per field and one administrator for the schema.
Treating adoption as automatic. Collaborative tools only work under conditions of psychological safety and scaffolded participation, which must be designed in, not hoped for [9].
Ignoring lessons from your own operation. Teams that debrief systematically, as the multisite gaze-tracking protocol did through staff notes and meeting observations, catch problems early [8]. Teams that do not repeat them.
Expecting the tracker to prove scientific value directly. Trackers demonstrate engagement, activity, and reach [3]. They do not substitute for scientific evaluation of the research itself.
Finally, one honest limitation: a tracker is a management instrument, not a regulatory submission, and individual projects with unusual requirements, such as special data use agreements or equipment dependencies, may need fields this guide does not anticipate. Adapt the schema to your situation rather than forcing your situation into the schema.
Frequently Asked Questions
What is a project tracker in a research context?
A project tracker is a structured database of your active studies that records each project's stage, owner, milestones, next action, and update history, so anyone on the team can see the state of the portfolio at a glance. Research groups use platforms from spreadsheets to REDCap for this purpose.
Which platform should I start with for a small lab?
Start with a shared spreadsheet that follows the data dictionary in this guide. If your institution licenses REDCap or a similar electronic data capture system, and you expect to grow or need audit trails, build there instead, since that platform's flexibility supports years of customized reporting [3].
How do I customize a tracker for my specific study?
Map your research stages first, then define a data dictionary with fixed value lists, build the tracker from that schema, add computed status flags, assign roles, prototype with a few users, and revise based on their feedback. This sequence follows the customization and prototyping practices documented in digital health implementation work [5] [7].
How much detail should each tracker record hold?
Enough to answer three questions: where is this project, what is the next action, and when was it last touched. Expert design reviews consistently favor broader categories, split views, and minimal redundancy over exhaustive detail [7].
How do I keep sensitive data safe in a project tracker?
Keep the tracker to operational metadata and link to study data by project ID only. For regulated or identifiable data, use an environment with variable-level access control and auditable workflows, such as a trusted research access and collaboration environment [6].
How often should the team update the tracker?
Contributors update their own rows daily or whenever a milestone changes, and the whole team reviews a status summary weekly. A computed stale flag, for example anything untouched for 14 days, keeps the cadence honest without extra meetings.
What features matter most for multi-site scientific collaboration?
Shared stage definitions, per-site status fields, clear role assignments, and revision history matter most, because aligning institutions on common terminology and priorities is the central coordination challenge in multi-partner research programs [4].
How do I get students or new team members to actually use the tracker?
Give them a one-page field guide, restrict their editing to their own projects at first, have a senior member model updates in the first few weekly reviews, and make it safe to report delays honestly. Collaborative participation grows under psychological safety and scaffolded onboarding, not under mandates [9].
Sources
- Process mapping of a collaborative quality improvement study to optimise the use of antibiotics in intensive care units in Argentina: a Pathfinder study.
- GENESIS-Guidance, Education, Networking, and Empowerment-based Smart Initiative for Students research in health care: A research modeling experience from a newly established medical college.
- Creation and implementation of a REDCap database demonstrates engagement and impact for a hospital-based center for nursing research and evidence-based practice.
- Challenges and opportunities for strengthening South American responses to insecticide resistance in disease vectors: Lessons from the WINSA workshop in Bogotá, Colombia.
- The Guideline Uptake in Digital Ecosystems (GUIDE) study: protocol for implementation research on the impact of WHO SMART guidelines digital adaptation kits to improve quality of care.
- FAIR by design (TRACE): A Trusted Research Access & Collaboration Environment.
- Converting and expanding mobile support tools for tuberculosis treatment support: Design recommendations from domain and design experts.
- Using Gaze Tracking as a Research Tool in the Deaf Health Literacy and Access to Health Information Project: Protocol for a Multisite Mixed Methods Study and Preliminary Results.
- A design-based approach to collaborative learning in flipped classrooms: Fostering socio-cognitive and psychological competencies among female Saudi postgraduates.
- Integrating patient advocacy into hepatology practice - Current perspective and future directions.
- Methods for mapping population-level interventions in system dynamics modelling for context-sensitive policy planning in youth mental health.