Energy Pyramid: Trophic Levels and the 10% Rule
By Dr. Zubair Khalid, DVM, MS, PhD ·

An energy pyramid is a model that shows how much energy is available at each trophic level, or feeding position, in an ecosystem, from photosynthetic producers at the base to top predators at the tip. The pyramid narrows as it goes up because most energy is lost as heat at every transfer between levels, so each higher level can support less biomass and fewer individuals.
This single concept explains some of the most visible patterns in nature: why food chains rarely extend beyond four or five links, why lions are far less numerous than wildebeest, and why an acre of farmland can feed more people with plant crops than with beef. Ecologists use energy pyramids to quantify how ecosystems store and pass along energy, to predict how disturbances move through food webs, and to design conservation plans for habitats ranging from seagrass meadows to forest soils. The model is simple enough to appear in elementary school science lessons, yet powerful enough to anchor professional ecosystem models.
What Is an Energy Pyramid?
The energy pyramid definition used in ecology textbooks is straightforward: it is a graphic representation of energy flow through an ecosystem, arranged by trophic level. The bottom bar represents producers, the level above it represents primary consumers, and each successive bar represents the next consumer level. The width of each bar is proportional to the amount of energy stored as biomass at that level, usually measured in kilocalories per square meter per year (kcal/m²/yr) or in joules.
The concept grew out of work by Raymond Lindeman in the 1940s, who formalized the idea that energy flows through ecosystems in a one-way stream rather than cycling like nutrients. Lindeman's trophic-dynamic view of ecology became the foundation for modern food web research. The pyramid shape is a direct consequence of the second law of thermodynamics: every time one organism is eaten by another, a large fraction of the chemical energy in the food is dissipated as heat during respiration, movement, digestion, and maintenance, and only a fraction becomes new consumer biomass.
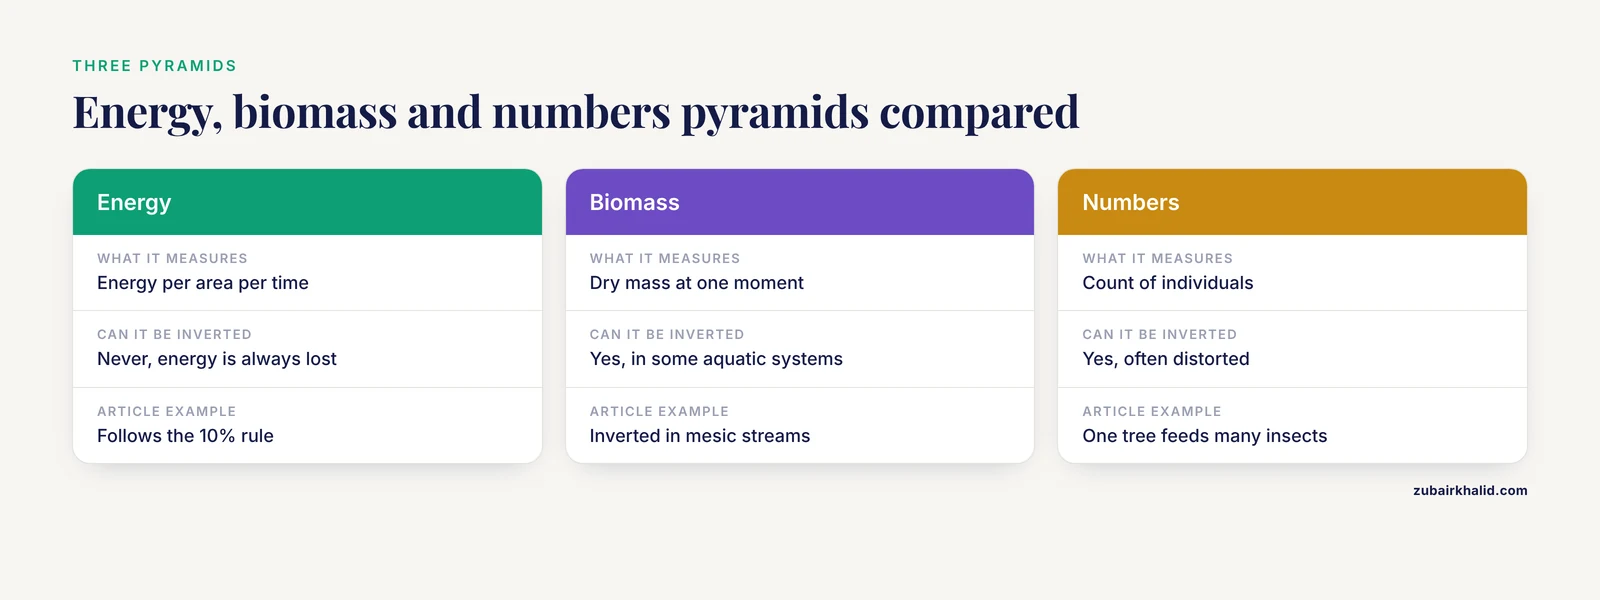
Ecologists distinguish three types of ecological pyramids, and the energy pyramid is the most fundamental:
- Pyramid of energy: measured as energy per area per time. This is the one that follows the 10% rule.
- Pyramid of biomass: the total dry mass of organisms at each level at a given moment. It can be inverted in some aquatic systems.
- Pyramid of numbers: the count of individuals at each level. It is often distorted because one tree can feed many thousands of insects.
The energy pyramid is the only one that is always shown upright in standard textbooks, because energy cannot be created within a trophic level and the losses at each transfer are unavoidable. As discussed later, even this generalization needs qualification.
Because the energy pyramid is a standard classroom topic, worksheets often ask students to label trophic levels, apply the 10% rule, and identify producers and consumers in a food chain.
Trophic Levels: The Layers of the Pyramid
Trophic level is the term ecologists use for an organism's position in the food chain. The word comes from the Greek trophē, meaning nourishment. Assigning an organism to a trophic level is a simplification, since many species feed at more than one level, but it remains a useful way to track energy flow.
Level 1: Producers
Producers, also called autotrophs, build their own biomass from inorganic molecules. On land these are green plants. In water they include phytoplankton, algae, seagrasses, and some bacteria. Photosynthesis captures solar energy and stores it as chemical energy in carbohydrates. This is the only point at which new energy enters the ecosystem.
Level 2: Primary Consumers
Primary consumers, or herbivores, eat producers. Examples include zooplankton grazing on phytoplankton, caterpillars eating leaves, and wildebeest grazing on savanna grasses. In the seagrass meadows of the West Sand of Qilianyu Islands in the South China Sea, researchers identified herbivorous fish, sea urchins, and amphipods as the main primary consumers [1].
Level 3: Secondary Consumers
Secondary consumers eat primary consumers. They form the first carnivorous level. Zooplanktivorous fish, small predatory invertebrates, and insect-eating birds all sit here. In the Qilianyu Islands seagrass system, small piscivorous fish and cephalopods occupy this middle portion of the food web [1].
Level 4 and Above: Tertiary and Quaternary Consumers
Tertiary consumers eat secondary consumers, and quaternary consumers eat tertiary consumers. These are the apex predators: sharks, raptors, large cats, and large piscivorous fish. In the seagrass food web model, trophic levels were constrained below 4.0 because apex predators were absent from the sampled area [1]. That pattern is common. The length of a food chain is limited by the energy losses at each step, and very few ecosystems can support enough energy transfer to sustain a fifth or sixth trophic level.
Where Do Decomposers Fit?
Decomposers, including bacteria, fungi, and detritivores such as earthworms and woodlice, do not fit neatly into the classic pyramid. They feed on dead organic matter from all levels rather than on living organisms. In soil ecosystems, decomposer activity can dominate the total energy flux of the food web. A study of forest soil food webs found that canopy gaps reduced total energy fluxes by 13.4%, and that adding deadwood increased total energy flux by 37.4%, mainly through enhanced fungivory and wood-feeding pathways [2]. The detrital channel can carry as much energy as the grazing channel, even though it is often omitted from simplified energy pyramid diagrams.
The 10% Rule: How Energy Moves Between Levels
The 10% rule states that, on average, only about 10% of the energy available at one trophic level is converted into biomass at the next trophic level. The other 90% is lost. This is sometimes called Lindeman's rule, after the ecologist who first formalized the concept, and it is taught in essentially every introductory ecology course.
Where does the 90% go?
- Respiration. Cells break down glucose to power metabolism, and most of the chemical energy is released as heat. This is the largest loss.
- Digestion and assimilation inefficiency. Not all ingested food is absorbed. Some passes through the gut as feces.
- Excretion. Nitrogenous waste such as urea and ammonia contains chemical energy that is lost.
- Incomplete consumption. Predators often leave parts of prey uneaten, including bones, fur, shells, and roots.
The 10% figure is a rule of thumb, not a law of nature. A global synthesis compiled 2,052 trophic transfer efficiency estimates from 122 studies and found that the average energy transfer efficiency across all ecosystems was 5.92%, well below 10%, while nutrient transfer efficiency averaged 11.13% [3]. The same study found strong ecosystem differences: marine systems averaged 8.13%, freshwater systems 5.53%, and terrestrial systems just 1.52% [3]. Terrestrial plants are rich in structural carbohydrates such as cellulose and lignin that herbivores digest poorly, which helps explain the low terrestrial figure.
Temperature also matters. In a seven-year field experiment using artificial ponds, researchers found that warming the water by 4°C decreased trophic transfer efficiency by up to 56% compared with ambient conditions [4]. The mechanism is metabolic: warmer temperatures increase the cost of growth, so a larger share of consumed energy is respired rather than converted into new tissue. The authors concluded that as the planet warms, a growing proportion of the carbon fixed by photosynthesis will be lost to the atmosphere, impairing energy flux through food chains [4].
In lakes, measured transfer efficiencies are often far below 10%. A study of four multi-trophic lake food webs, spanning organisms from bacteria to fish, found average transfer efficiencies between 1.0% and 3.6%, with an overall mean of 1.85% [5]. The same study showed that these low efficiencies were consistent with the slopes of the lakes' biomass size spectra, confirming that the energy pyramid and the size structure of the community are two views of the same phenomenon [5].
Nutrient availability shapes transfer efficiency as well. In shallow Chinese lakes, the combined status of nitrogen and phosphorus influenced both the structure and the energy flow of multi-trophic planktonic communities. Lakes limited by a single nutrient showed higher network stability and higher total trophic transfer efficiency than lakes where both nutrients were high or both were low [6].
Energy Pyramid Examples Across Ecosystems
Marine and Coastal Ecosystems
Marine ecosystems have the highest average energy transfer efficiency of any major habitat type, at 8.13% [3]. Seagrass meadows are a good example of a coastal energy pyramid. In the West Sand of Qilianyu Islands, researchers used Ecopath with Ecosim modeling to reconstruct food webs across four habitat types: coral-seagrass transition zones, dense seagrass, sparse seagrass, and bare sediment. The models included 20 to 32 functional groups, and transfer efficiencies followed a clear habitat gradient, with dense seagrass supporting the most efficient energy transfer and bare sediment the least [1]. Seagrass structural complexity facilitates energy transfer by providing refuge for prey and foraging habitat for predators. The study also found that in healthy meadows, piscivorous fish exerted top-down control on the food web, while in degraded areas the keystone roles shifted to zooplankton and cephalopods [1].
Freshwater Lakes and Ponds
Freshwater planktonic food webs are classic subjects for energy pyramid studies because they are contained, replicable, and fast-growing. The warming experiment described above used artificial ponds and tracked nitrogen transfer as a proxy for energy transfer, providing direct experimental evidence that warming impairs trophic efficiency [4]. In shallow lakes, the structure of the planktonic food web, from prokaryotes and eukaryotic algae up through protozoans and metazoans, responds strongly to nitrogen and phosphorus co-status [6].
Microbial Food Webs
Even at the microscopic scale, energy pyramids hold. In China's marginal seas, researchers measured the abundance and biomass of picoplankton (0.2 to 2.0 µm), nanoplankton (2.0 to 20 µm), and microzooplankton (20 to 200 µm) during winter. The abundance ratios followed a pyramid structure, with picoplankton outnumbering microzooplankton by roughly five orders of magnitude and nanoplankton outnumbering microzooplankton by roughly two orders of magnitude [7]. The biomass of 20 to 200 µm plankton was only about 9.9% of the biomass of 0.2 to 2.0 µm plankton, a ratio consistent with strong energy losses between microbial trophic levels [7].
Soil Food Webs
Soil food webs are energy pyramids in which most energy flows through detritus rather than living plants. In a forest experiment, researchers reconstructed 116 soil animal food webs to measure energy fluxes. Forest gaps reduced total food web energy fluxes by 13.4% and shifted energy flow toward a bacteria-dominated fast channel, indicating simplified food webs and reduced energy retention belowground. Adding deadwood to gaps increased total energy flux by 37.4%, restoring much of the lost function [2].
Streams and Rivers
Rainfall is a master variable for stream food webs. In a study of nine rivers across a sharp rainfall gradient, researchers found that mesic (wetter) streams supported inverted biomass pyramids sustained by detritivorous invertebrates, while arid streams had simplified food webs dominated by vertebrate herbivores and showed twice the secondary production and biomass turnover rates [8]. The shape of the energy pyramid is not fixed. It shifts with climate and the dominant energy source.
Summary Table: Measured Trophic Transfer Efficiencies
| System | Mean energy transfer efficiency | Notes | Source |
|---|---|---|---|
| Global average | 5.92% | 2,052 estimates from 122 studies | [3] |
| Marine | 8.13% | Highest of the three major realms | [3] |
| Freshwater | 5.53% | Intermediate | [3] |
| Terrestrial | 1.52% | Lowest, partly due to indigestible plant fiber | [3] |
| Boreal lake food webs | 1.0 to 3.6% | Bacteria to fish, mean 1.85% | [5] |
| Warmed experimental ponds | Up to 56% lower than ambient | 4°C warming over 7 years | [4] |
How Ecologists Measure Energy Pyramids
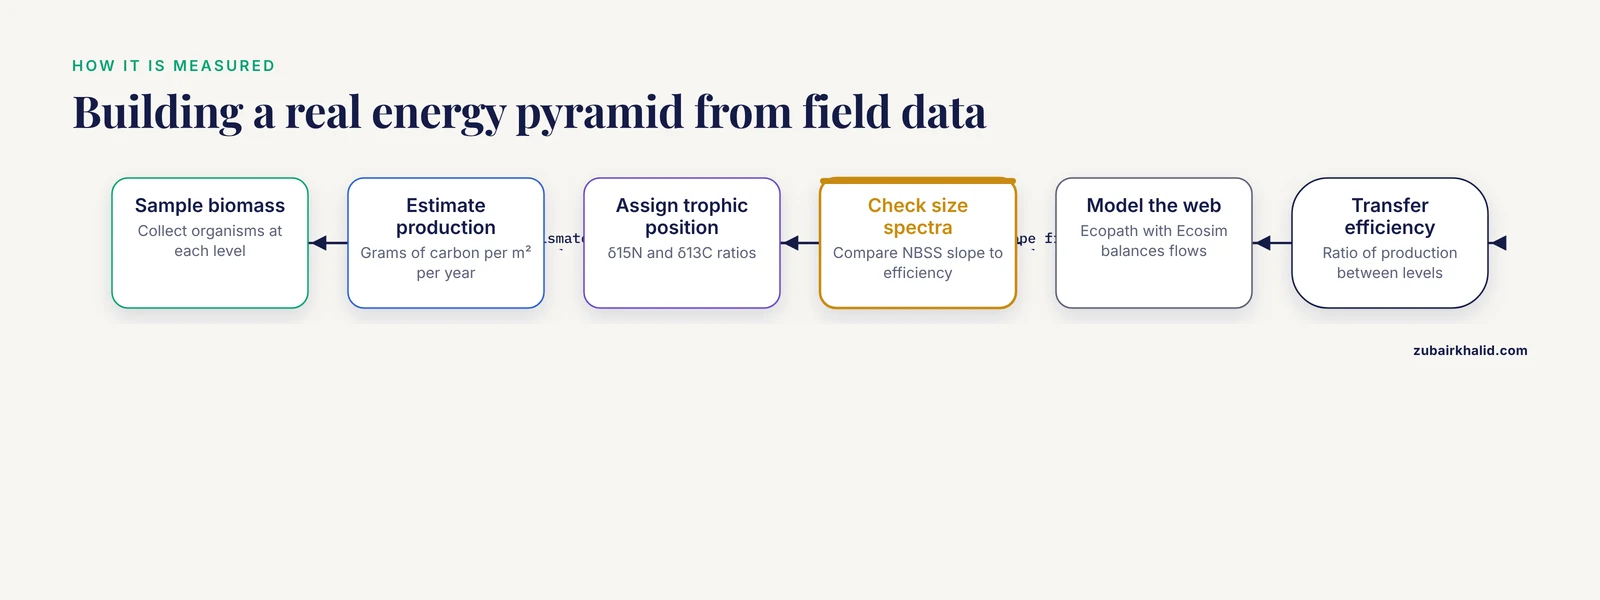
Building a real energy pyramid requires measuring or estimating the energy stored in each trophic level and the rate at which it moves upward. Several methods are used, often in combination.
Biomass Sampling and Production Estimates
The most direct approach is to sample organisms from each trophic level, measure their biomass, and estimate their production rate, the rate at which new biomass is generated. Production is usually expressed as grams of carbon per square meter per year. The ratio of production at one level to production at the level below it is the trophic transfer efficiency.
Stable Isotope Analysis
Stable isotope ratios provide a chemical record of what an animal has eaten. The ratio of nitrogen-15 to nitrogen-14 (δ15N) increases predictably with each trophic level, so measuring δ15N in a consumer reveals its trophic position. Carbon isotopes (δ13C) indicate the energy source, such as seagrass versus macroalgae. In an estuarine food web study, researchers used δ13C and δ15N to reconstruct the food web of Edgartown Great Pond and to determine the trophic positions of herbivores, detritivores, and predators [9]. This approach allows ecologists to place organisms on the pyramid without observing feeding directly.
Size Spectra
Because predators are almost always larger than their prey, the size distribution of organisms in an ecosystem is tightly linked to its trophic structure. Normalized biomass size spectra (NBSS) plot the logarithm of biomass within size bins against the logarithm of organismal size. The slope of this relationship can be predicted from the trophic transfer efficiency and the predator-prey mass ratio. In four lake food webs, the measured NBSS slopes were close to the values predicted from the measured transfer efficiencies, providing independent confirmation of the energy pyramid concept [5].
Food Web Modeling
Ecopath with Ecosim (EwE) is a widely used modeling platform that balances energy flows among functional groups in an ecosystem. The seagrass meadow study used EwE to construct models of 20 to 32 functional groups and to calculate transfer efficiencies, keystone species, and ecosystem health indices [1]. Thirty-year simulations predicted that seagrass degradation would decrease higher trophic level biomass while increasing primary producers, and that restoration would reverse this cascade [1].
Environmental DNA and AI-Assisted Networks
A newer approach uses environmental DNA (eDNA) to inventory species and then infers predator-prey interactions algorithmically. A study of New Zealand lakes built a regional metaweb, a regional inventory of trophic interactions, from eDNA data covering 312 freshwater taxa, and validated the inferred interactions against expert assessment [10]. Observed communities had significantly higher connectance and mean trophic level than random assemblages, indicating that trophic interactions constrain community assembly [10]. This approach promises to scale up energy pyramid research from a handful of well-studied sites to entire regions.
Common Mistakes and Limitations
Mistake 1: Assuming Species Richness Follows the Pyramid Shape
It is tempting to think that because energy declines with each trophic level, the number of species should also decline. It does not. A global analysis of all known terrestrial tetrapod and arthropod species, representing over 90% of Earth's terrestrial animal diversity, found that 46% are primary consumers, 43% are higher-level consumers, and 11% are mixed consumers [11]. This is a roughly uniform distribution, not a pyramid. The authors propose that higher ecological differentiation among species at higher trophic levels offsets their greater extinction risk, generating a uniform trophic structure [11]. The energy pyramid describes energy flow, not biodiversity.
Mistake 2: Treating 10% as a Universal Constant
The 10% rule is a pedagogical approximation. Real transfer efficiencies range widely, and the global average is closer to 6% for energy [3]. In some lake food webs the average is below 2% [5]. Students and researchers should treat the 10% figure as an order-of-magnitude guideline, not a physical constant.
Mistake 3: Believing Pyramids Are Always Upright
Standard textbook diagrams show a neat triangle, but real ecosystems can have inverted biomass pyramids. In mesic streams, the biomass of detritivorous invertebrates can exceed the biomass of the primary producers that support them, because the producers are single-celled algae with rapid turnover while the consumers are longer-lived [8]. The energy pyramid is always upright in the sense that energy flows in one direction and is lost at each step, but the standing stock of biomass at any moment does not have to decline with trophic level.
Mistake 4: Ignoring the Detrital Channel
Classroom energy pyramids usually show a grazing food chain: plant to herbivore to carnivore. In many ecosystems, especially forests and streams, most energy flows through dead organic matter and decomposers. Soil food webs in forests carry enormous energy fluxes, and disturbances that remove deadwood can reduce those fluxes by more than a third [2]. An energy pyramid that omits decomposers gives an incomplete picture of the ecosystem.
Limitation: Transfer Efficiency Depends on Context
Trophic transfer efficiency varies with temperature [4], nutrient status [6], habitat complexity [1], and the type of consumer. Endotherms have lower transfer efficiencies than ectotherms because they spend more energy on maintaining body temperature [3]. A single global number, even a well-measured one, cannot capture this variation. Individual ecosystems require site-specific study to understand their particular energy flows.
Limitation: Trophic Levels Are Simplifications
Many species feed at multiple trophic levels. Omnivores, generalists, and animals that shift diets seasonally do not sit neatly on one bar of the pyramid. The global analysis of terrestrial animal diversity found that 11% of species are mixed consumers that feed on both plants and animals [11]. Food web models handle this by assigning fractional trophic levels, but the classic five-bar pyramid remains a simplification.
Quick Review
- An energy pyramid shows the amount of energy available at each trophic level, from producers at the base to top predators at the tip.
- Trophic level 1 is producers, level 2 is primary consumers, level 3 is secondary consumers, and level 4 and above are tertiary and quaternary consumers.
- The 10% rule states that roughly 10% of energy at one level becomes biomass at the next. The rest is lost as heat, waste, and indigestible material.
- Measured transfer efficiencies vary widely by ecosystem, and the global average is below the 10% rule of thumb [3].
- Warming reduces trophic transfer efficiency, so climate change is expected to weaken energy flow through food chains [4].
- Species richness does not follow the energy pyramid. Terrestrial animal diversity is roughly uniform across trophic levels [11].
- Ecologists measure energy pyramids with biomass sampling, stable isotopes, size spectra, food web modeling, and eDNA-based network inference [1][5][10][9].
Worked Examples: Applying the 10% Rule to Real Data
To calculate energy at each trophic level, start with a measured producer value, then multiply by 0.10 for each transfer. The result is energy per unit area per year, so keep units consistent throughout.
Example: A coastal food web
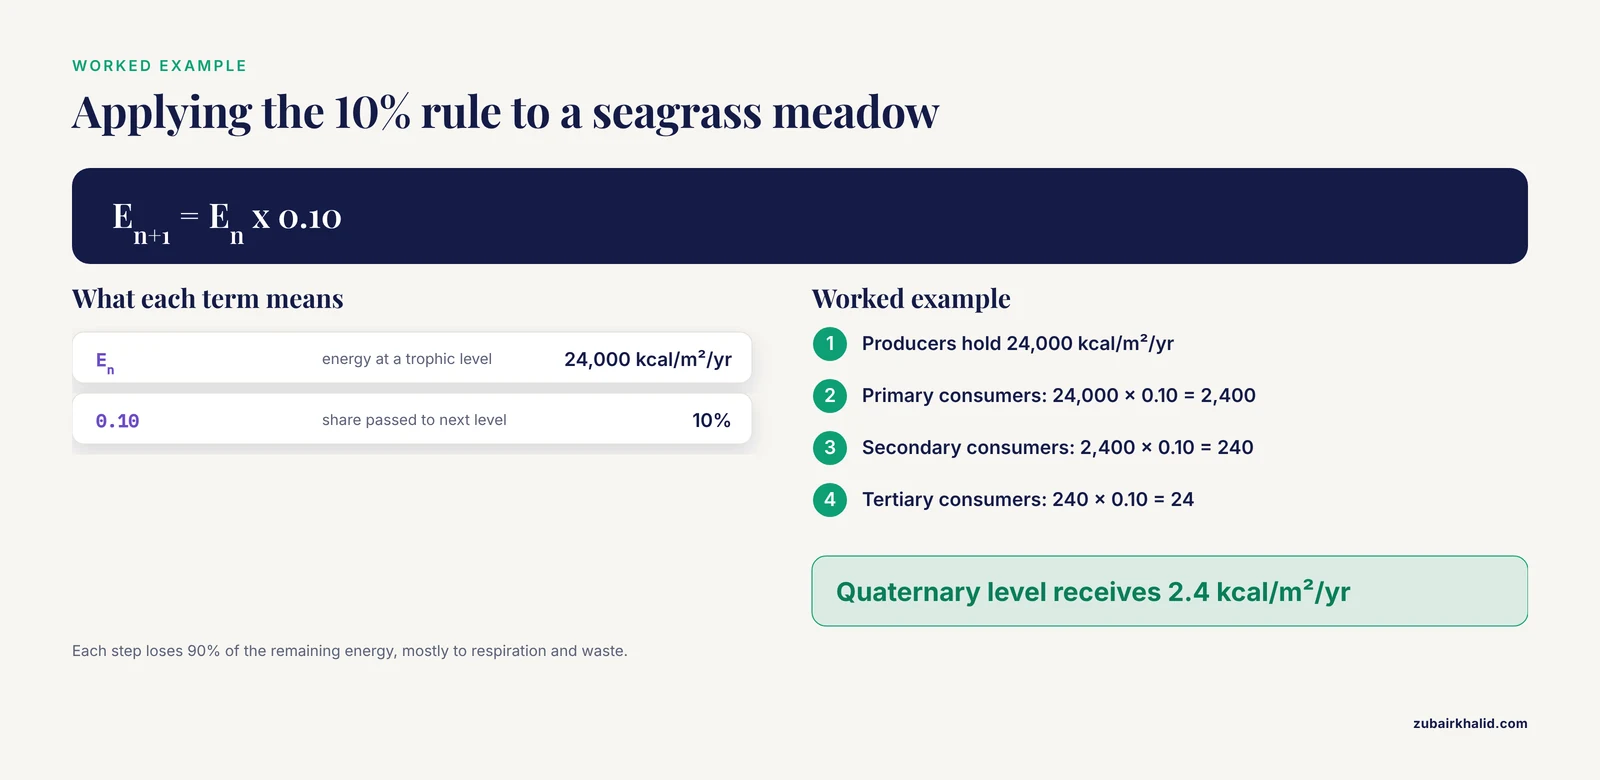
Suppose a seagrass meadow produces 24,000 kcal/m²/yr of net primary production. Applying the 10% rule:
| Trophic level | Calculation | Energy available |
|---|---|---|
| - | - | - |
| Producers | measured | 24,000 kcal/m²/yr |
| Primary consumers | 24,000 × 0.10 | 2,400 kcal/m²/yr |
| Secondary consumers | 2,400 × 0.10 | 240 kcal/m²/yr |
| Tertiary consumers | 240 × 0.10 | 24 kcal/m²/yr |
| Quaternary consumers | 24 × 0.10 | 2.4 kcal/m²/yr |
Each step loses 90% of the remaining energy, mostly to respiration and waste. The quaternary consumer level receives only 0.01% of the producer energy.
Avoiding common errors
- Do not multiply by 0.90. The 10% rule means the next level receives 10% of the previous level, not that you subtract 90 kcal from a fixed total.
- Keep units attached. If producer energy is per square meter per year, every derived value carries the same units.
- Round only at the final step. If you round 2,400 to 2,000 before the next multiplication, the tertiary value becomes 200 instead of 240, a 17% error.
- Remember that 10% is a pedagogical average. Measured efficiencies range from about 1.5% in terrestrial systems to 8% in marine systems [3], so real pyramids may be much narrower than the worked example.
Energy Pyramids in Agriculture and Human Diets
Humans can feed at different trophic levels, and the choice strongly affects how much land and feed are needed to supply a population. A plant-based diet places people at trophic level 2, eating producers directly. An animal-based diet places people at level 3 or higher, because the energy in meat, milk, or eggs has already passed through one or more consumer levels.
The 10% rule quantifies the cost. Suppose a field produces 10,000 kcal of crop energy. Eaten directly, that energy enters the human food supply at level 2. If the same crop is fed to livestock, only about 1,000 kcal becomes livestock tissue, and humans eating the livestock receive roughly 100 kcal. The same original plant energy therefore delivers about ten times more food energy to people when consumed directly than when converted to animal products.
| Diet type | Human trophic level | Crop energy needed per 100 kcal delivered |
|---|---|---|
| - | - | - |
| Plant-based | 2 | ~100 kcal |
| Animal-based | 3 | ~1,000 kcal |
This is why trophic level choices affect global food supply. Animal products require more cropland, water, and feed per calorie delivered. Terrestrial transfer efficiencies are especially low, averaging 1.52% in a global synthesis [3], so the losses between feed crops and livestock can exceed the textbook 10% figure. Ruminants can graze land unsuitable for crops, which complicates simple comparisons, but the general pattern holds: each additional trophic level multiplies the land and feed required to feed a human population.
Using Energy Pyramids in Conservation and Ecosystem Management
Managers use energy pyramids to estimate how much production reaches a harvested or protected level.
Fishery quotas
Quotas are safest when tied to surplus production at the target level, not standing biomass alone. Transfer efficiency sets the ceiling: if a small share of prey production becomes predator biomass, heavy removal at the top can collapse that level. Because measured efficiencies range from 1.52% in terrestrial systems to 8.13% in marine systems [3], quotas need local production data rather than borrowed values.
Restoration design
Energy flow models can compare restoration scenarios. In seagrass meadows, Ecopath with Ecosim simulations predicted that degradation would reduce higher trophic level biomass and restoration would reverse the cascade [1]. In forest soils, adding deadwood to canopy gaps raised total food web energy flux by 37.4% [2]. Restoration can target energy-carrying pathways such as habitat structure and deadwood.
Climate prediction
Warming lowers transfer efficiency. A seven-year pond experiment found that 4°C warming cut trophic transfer efficiency by up to 56% [4]. Models should adjust efficiency downward and expect weaker predator biomass and greater carbon loss. Rainfall regime also reshapes stream energy flow [8], so climate projections should include hydrological change.
Health monitoring
Transfer efficiency and biomass indicators reveal more together than alone. Size spectra slopes can track measured transfer efficiency in lake food webs [5], and eDNA metawebs can map interactions across taxa [10]. Biomass pyramids alone can mislead because some streams support inverted biomass pyramids [8]. Nutrient status also shifts efficiency and stability [6], so pair biomass sampling with flux estimates.
Related Guides
- Sheep Energy Requirements: Understanding TDN and Net Energy: Explains ruminant net energy and TDN for feed planning
- Understanding Feed Ingredients: Energy, Protein, and Additives for Poultry: Covers feed ingredient energy and protein for poultry diets
- Broiler Feed Formulation Basics: Balancing Energy and Protein: Broiler ration basics for energy and protein balancing
- Energy Needs of Broilers: Feeding for Rapid Growth and Efficiency: Broiler energy needs for growth and feed efficiency
- Feedlot Ration Formulation: Balancing Energy and Protein: Feedlot ration energy and protein balance for cattle
- Beef Cow Ration Formulation: Balancing Energy, Protein, and Fiber: Beef cow ration energy, protein, and fiber balancing
- Dairy Barn Energy Efficiency: Lighting, Ventilation, and Insulation: Dairy barn energy efficiency through lighting and ventilation
Frequently Asked Questions
What is an energy pyramid?
An energy pyramid is a diagram that shows how much energy is available at each trophic level of an ecosystem. Producers form the wide base, and each higher consumer level forms a narrower bar because energy is lost at every transfer.
Why is only 10% of energy transferred between trophic levels?
Most of the energy in food is used by the consumer for respiration, movement, digestion, and maintenance, and is released as heat. Additional energy is lost in feces, urine, and uneaten parts of prey. Only the fraction converted into new consumer biomass, roughly 10% on average, is available to the next trophic level.
What is the difference between an energy pyramid and a food chain?
A food chain is a linear list of who eats whom, such as grass to grasshopper to mouse to hawk. An energy pyramid adds quantitative information: it shows how much energy is stored at each of those feeding levels and how much is lost between them. A food web is the full network of interconnected food chains in an ecosystem.
Why are there usually only four or five trophic levels?
Because roughly 90% of energy is lost at each transfer, the energy available at high trophic levels becomes too small to support a viable population. Starting with 10,000 kcal of producer energy, the 10% rule leaves only about 10 kcal at the fourth trophic level and 1 kcal at the fifth, which is rarely enough to sustain a breeding population of large predators.
Can an energy pyramid be inverted?
The energy pyramid itself is never inverted, because energy cannot be created at higher trophic levels and is always lost in transfers. However, pyramids of biomass and numbers can be inverted. In some streams, the biomass of invertebrate consumers exceeds the biomass of the algae that support them because the algae reproduce rapidly and are consumed quickly [8].
How do ecologists measure trophic transfer efficiency?
Ecologists measure the production rate of each trophic level, often using biomass sampling combined with stable isotope analysis to assign trophic positions [9]. They may also use size spectra [5], food web modeling with platforms such as Ecopath with Ecosim [1], or eDNA-based network inference [10]. The transfer efficiency is the ratio of production at one level to production at the level below it.
Sources
- The Conservation of Seagrass Meadows in the West Sand of Qilianyu Islands Based on the Perspective of Food-Web Trophic Network and Energy Flow.
- Deadwood Mitigates Declines in Soil Food-Web Energy Fluxes in Canopy Gaps.
- Global synthesis reveals systematic variation in trophic transfer efficiency across and within ecosystems.
- Warming impairs trophic transfer efficiency in a long-term field experiment.
- Empirical correspondence between trophic transfer efficiency in freshwater food webs and the slope of their size spectra.
- Influence of N and P co-statuses on multi-trophic planktonic communities of shallow lakes: Structure, assembly, and energy flow.
- Physicochemical Parameters Govern Winter Pelagic Microbial Food Web Dynamics in China's Marginal Seas.
- Climatic rainfall regime shapes energy flow, trophic structure, and secondary production in streams.
- Seagrasses and macroalgae incorporate land-derived metal pollution while limiting its transfer through estuarine food webs.
- From eDNA to food webs: AI-enabled metaweb construction for lakes which captures non-random species assemblies.
- Global evidence of non-pyramidal and uniform ratios of animal diversity across terrestrial trophic levels.