Choosing the Right Sample Size Calculator for Diagnostic Research
By Dr. Zubair Khalid, DVM, MS, PhD ·

A diagnostic accuracy study lives or dies by the precision of its sensitivity and specificity estimates, while a generic trial calculator sizes groups around the difference between two means. That mismatch is the single biggest reason diagnostic studies end up underpowered or wastefully large. The rule of thumb is simple: pick a calculator that asks for your expected sensitivity or specificity, the confidence interval width you can tolerate, and the disease prevalence you expect to enroll, then check its answer against the basic proportion formula by hand.
Type "sample size calculator diagnostic research" into a search engine and you will get dozens of tools, from free web calculators to Bayesian planning frameworks. This guide explains what each type does, compares them side by side, walks through worked scenarios, and lists the mistakes that most often derail diagnostic studies.
Why Diagnostic Accuracy Studies Break the Standard Sample Size Playbook
First, the vocabulary. The index test is the new test under evaluation. The reference standard is the accepted method treated as truth. Sensitivity is the share of diseased patients the index test correctly flags, calculated as true positives divided by all diseased patients. Specificity is the share of non-diseased patients it correctly clears, calculated as true negatives divided by all non-diseased patients. Prevalence is the proportion of your sampled population that actually has the disease.
A two-arm trial calculator asks for an effect size, an alpha level, and a power target. A diagnostic accuracy study asks different questions entirely:
- How precisely will I estimate sensitivity, expressed as the width of its confidence interval?
- How precisely will I estimate specificity?
- Can I compare my index test against an existing test in the same patients, which means planning around discordant pairs rather than independent groups?
- How many total patients must I screen to accumulate enough diseased and non-diseased cases, given prevalence?
Akoglu's practical review found that sample size estimation is overlooked and rarely reported in diagnostic accuracy studies, largely because clinical researchers lack clear information on when and how to estimate it [1]. Wang and Ji reached a similar conclusion across clinical research more broadly, noting that different study designs need different estimation methods and that incorrect or improper formulas continue to be applied despite a vast literature [2].
The statistical objects also differ. Sensitivity and specificity are proportions bounded between 0 and 1, so planning centers on confidence interval precision rather than mean differences. A test with expected sensitivity near 0.95 needs a different sample size than one near 0.50, even at the same target precision, because the variance of a proportion depends on the proportion itself. None of this is captured by a calculator that assumes two normally distributed group means.
The Main Sample Size Calculator Options for Diagnostic Research
General Clinical Research Calculators
Wang and Ji developed a free online calculator for common clinical study designs, available at riskcalc.org:3838/samplesize/, spanning randomized controlled trials through observational studies [2]. These tools shine when your diagnostic project also includes group comparisons, such as comparing biomarker levels between patients with and without the disease.
The limitation is scope. Most general calculators do not model sensitivity or specificity precision, and few handle prevalence-driven accrual, where low prevalence forces you to screen far more patients than the diseased count alone suggests. If your design is a pure accuracy study, a general tool usually needs manual adaptation or a dedicated module.
Diagnostic Accuracy-Specific Calculators
Akoglu published a user's guide to sample size estimation in diagnostic accuracy studies paired with a free online calculator at turkjemergmed.com/calculator, built around tests with dichotomized (positive or negative) outcomes and supported by practical worked tables [1]. This is the closest match to the typical single-test accuracy study. You enter the expected sensitivity or specificity, the desired precision, and prevalence, and the tool returns the required numbers of diseased and non-diseased patients.
The tradeoff is focus. These calculators are frequentist, they assume a single index test evaluated against a reference standard, and they will not plan a paired comparison or a Bayesian analysis for you.
Bayesian Planning Frameworks
When prior evidence exists, Bayesian methods change the planning question from "how many patients for long-run error rates" to "how many patients so that the posterior probability of success is high enough." Shiota and colleagues proposed a Bayesian power-based method for diagnostic accuracy studies that uses two kinds of priors, an analysis prior and a design prior, for sensitivity and specificity, plus a design prior for prevalence [3]. For each possible future dataset at a candidate sample size, the analysis prior is updated to compute the posterior probability of meeting a prespecified success criterion. The design priors generate the prior predictive distribution of future data, and Bayesian power is the prior predictive probability of success. The required sample size is found by evaluating Bayesian power across candidate sizes.
In their numerical results, the required sample size generally decreased as uncertainty in the design priors decreased [3]. The practical implication is attractive: a new assay with solid pilot data may need fewer patients than a frequentist calculation suggests. The cost is expertise. You must elicit defensible priors, and turnkey calculators for this approach are far less common than for frequentist designs.
Statistical Software Suites
Established packages such as PASS, G*Power, and the R statistical environment include modules for proportion precision, paired proportions, and simulation-based power analysis. Their strengths are batch computation (you can sweep across dozens of prevalence and precision scenarios at once) and reproducibility (a script documents every assumption). Their weaknesses are cost or coding skill, and the perennial risk of selecting the wrong module. A software suite gives you every formula, including the wrong one for your design.
Offline and Mobile Biology Calculator Tools
BactiFIND is an offline-first mobile application for clinical microbiology that consolidates a database of over 300 organisms and 25 diagnostic, calculative, and educational features without requiring an internet connection [4]. Tools like this are a genuine advance for the bench and for resource-limited settings, because a pocket biology calculator keeps working where connectivity fails.
Keep the category in its lane, though. A laboratory utility app performs day-of calculations on data you already have. It does not perform design-stage power analysis, and it will not tell you how many patients to recruit. Use offline tools for workflow, not for planning.
Specialty Validated Calculators Worth Copying
Two published tools model what credibility looks like. PediTools provides electronic growth chart calculators based on lambda-mu-sigma (LMS) parameterization, launched in January 2012, and by June 2019 the site received over 500,000 page views per month across clinical care, research, and quality improvement uses [5]. The NAPLS-2 and SIPS-RC psychosis risk calculators were externally validated in an independent clinical high-risk sample of 68 participants, showing moderate discrimination for conversion to psychosis with area under the curve values of 0.71 and 0.65 respectively [6].
These are prediction and bioinformatics calculator tools rather than sample size planners, but they set the standard you should demand from any calculator: published methods, external validation, and transparent inputs. When you evaluate a sample size tool, ask whether its formulas and assumptions are documented anywhere a reviewer can check.
Pros and Cons at a Glance
The table below summarizes the sample size calculator diagnostic research options and their pros and cons.
| Calculator type | Best for | Typical inputs | Typical outputs | Pros | Cons |
|---|---|---|---|---|---|
| General clinical calculators (for example, the Wang and Ji online tool) | Projects mixing diagnostic work with group comparisons | Effect size, alpha, power, design | Sample size per group for means or proportions | Free, broad design coverage, peer-reviewed documentation | Often lack sensitivity and specificity precision modes and prevalence handling |
| Diagnostic accuracy calculators (for example, Akoglu's free tool) | Single index tests with dichotomized results | Expected sensitivity or specificity, precision, prevalence | Required diseased and non-diseased counts, total N | Matches the actual design, asks for prevalence, practical tables | Frequentist only, narrow scope |
| Bayesian power-based planning | Studies with usable prior evidence | Analysis prior, design prior, success criterion | N via Bayesian power across candidates | Uses existing data, can lower required N, aligns with Bayesian analysis | Needs prior elicitation expertise, few turnkey tools |
| Statistical software suites (PASS, G*Power, R) | Sensitivity analyses across many scenarios | Full parameter grids | N tables and plots | Batch scenarios, reproducible scripts | Cost or coding skill, easy to pick the wrong module |
| Offline mobile tools (for example, BactiFIND) | Point-of-need laboratory calculations | Built-in lab modules | Workflow calculations at the bench | Works without connectivity | Not a design-stage power analysis tool |
The Criteria That Decide Real Choices
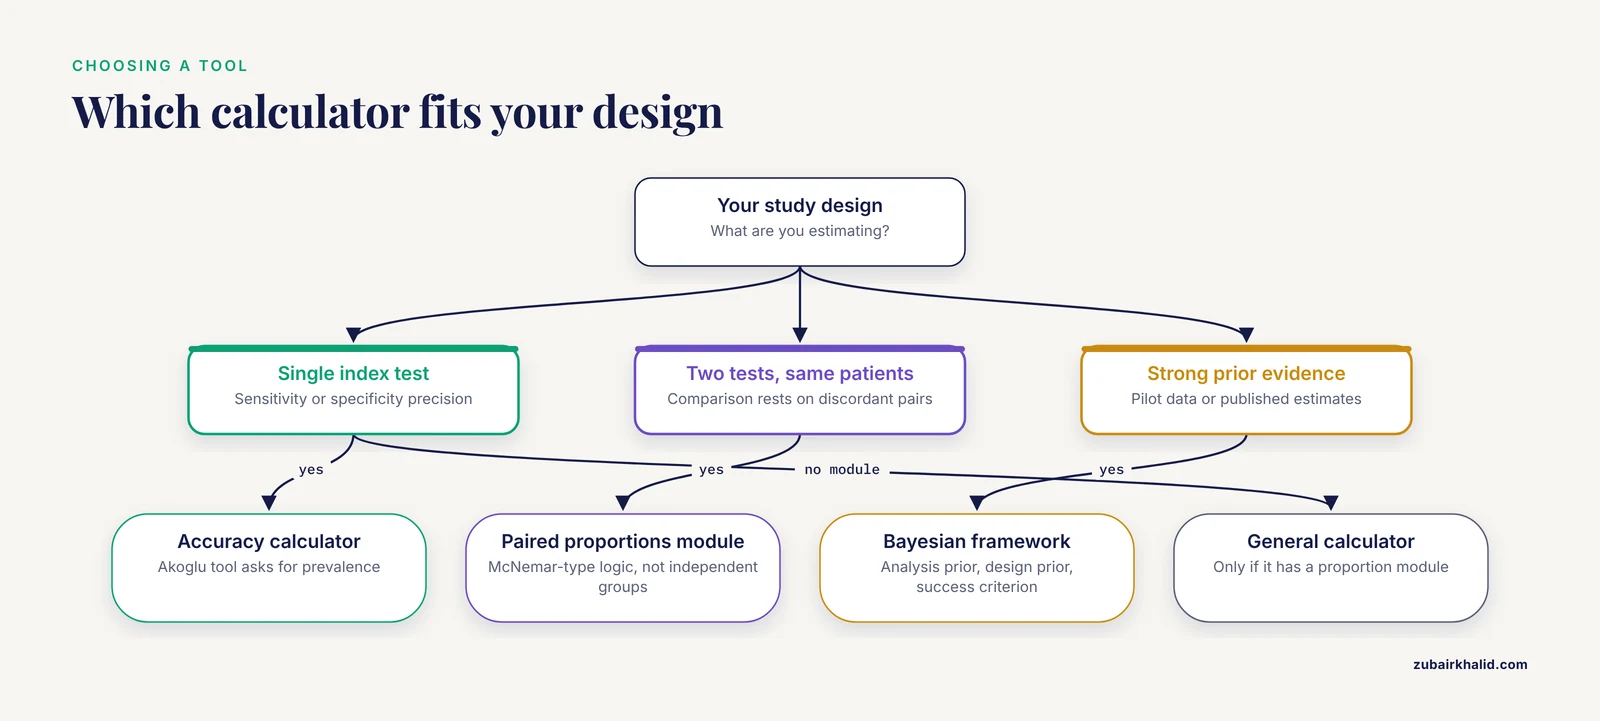
Design match. The first filter is whether the calculator models your actual design. A single-test accuracy study needs proportion precision. A paired comparison needs discordant-pair logic. A study with strong pilot data may justify Bayesian planning. Nothing else on this list matters if the design does not match.
Inputs you actually know. A calculator demanding an expected sensitivity you cannot defend is worse than useless. Before choosing a tool, write down what you can honestly estimate from a pilot study or published literature: anticipated sensitivity, anticipated specificity, target confidence interval width, and expected prevalence. The best calculator is one whose input fields map onto numbers you already have.
Frequentist versus Bayesian. Frequentist tools are the default, they are widely understood by reviewers and ethics committees, and free validated options exist. Bayesian planning is worth the extra effort when prior evidence is strong enough to formalize and when the analysis itself will be Bayesian, so that planning and inference share one framework [3].
Transparency and validation. Prefer calculators whose formulas are published and whose behavior you can verify. The PediTools project earned heavy usage because its methods were documented and its outputs reproducible [5], and the psychosis risk calculators earned adoption through external validation with reported discrimination [6]. Apply the same test to a sample size tool before you trust it in a grant application.
Recruitment feasibility. The most statistically elegant plan fails if patients do not exist in your catchment. Participation data make the point sharply. Among adults with cancer across 1,200 Commission on Cancer programs covering more than 70 percent of US cancer cases, the estimated participation rate was 7.1 percent for treatment trials and only 2.5 percent for diagnostic studies between 2013 and 2017 [7]. If your calculator returns a number your site cannot enroll in three years, change the design, add sites, or widen the confidence interval target, rather than pretending recruitment will magically appear.
Worked Scenarios
Scenario 1: Precision for a Single New Test
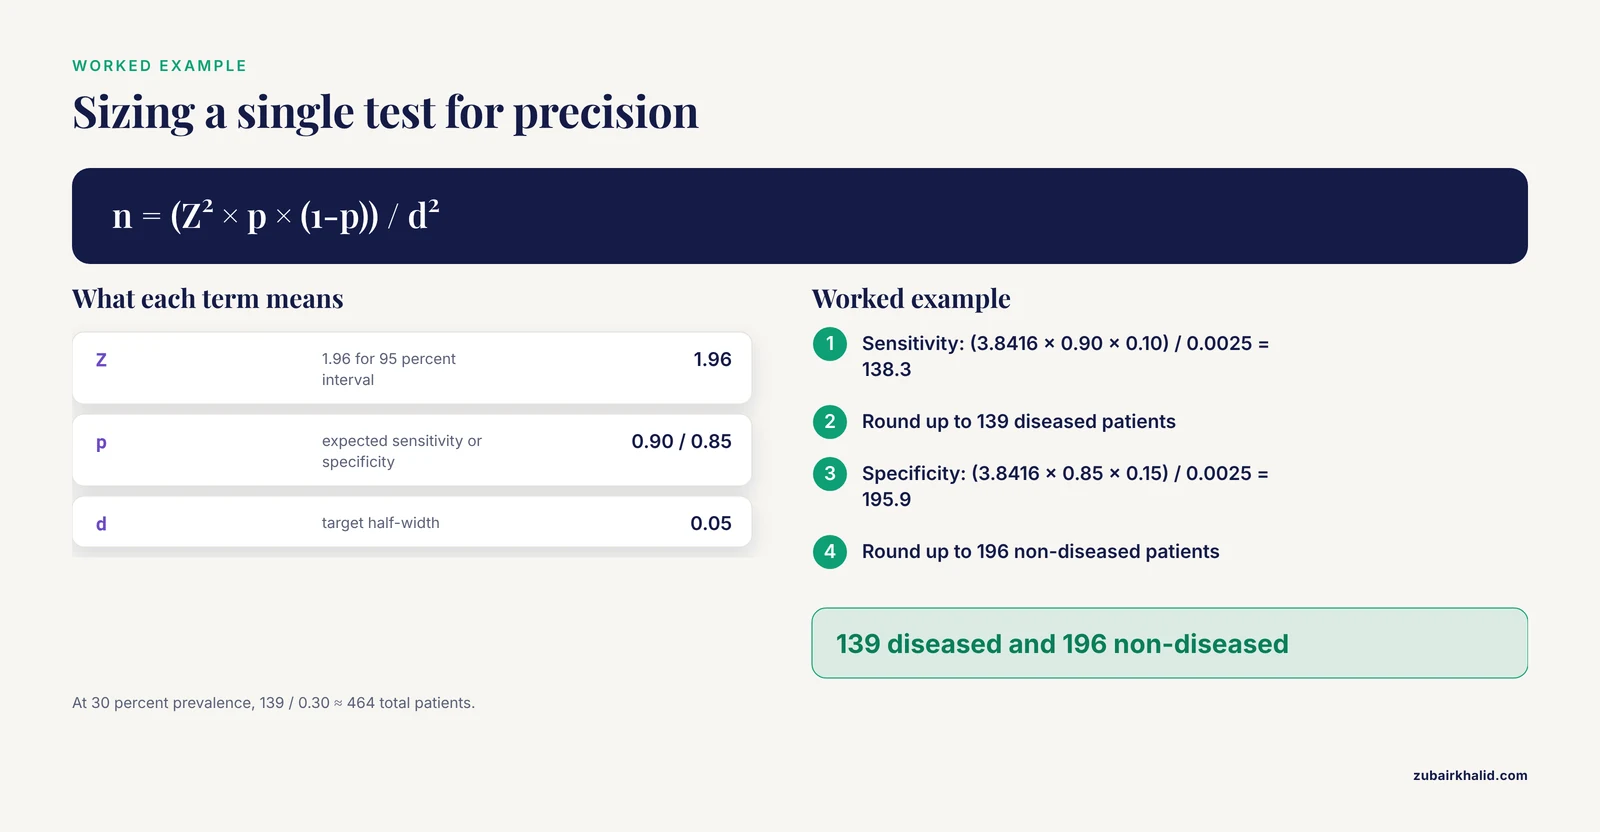
You are validating a new lateral flow assay. From pilot data you expect sensitivity of 0.90 and specificity of 0.85, and you want 95 percent confidence intervals with a half-width of 0.05 for both.
The standard proportion precision formula is n = (Z² × p × (1-p)) / d², where Z is 1.96 for a 95 percent confidence interval, p is the expected proportion, and d is the half-width.
- Sensitivity: n = (3.8416 × 0.90 × 0.10) / 0.0025 = 138.3, so you need 139 diseased patients.
- Specificity: n = (3.8416 × 0.85 × 0.15) / 0.0025 = 195.9, so you need 196 non-diseased patients.
Now prevalence enters. If the disease prevalence in your setting is 30 percent, you need 139 / 0.30 ≈ 464 total patients, which yields about 325 non-diseased patients, comfortably above the 196 required for specificity. If prevalence drops to 10 percent, the same 139 diseased patients require roughly 1,390 total patients. The sensitivity requirement did not change, the accrual burden tripled.
Finally, inflate for imperfection. If you expect 5 percent of results to be indeterminate or lost to the reference standard, divide by 0.95, giving about 489 patients in the 30 percent prevalence case. Akoglu's guide and calculator automate exactly this chain of steps for dichotomized outcomes [1].
Scenario 2: Comparing Two Tests in the Same Patients
Suppose you want to know whether a new point-of-care test outperforms an established imaging method in the same patients. A published cross-sectional comparison of diagnostic nasal endoscopy against plain computed tomography of the paranasal sinuses in chronic rhinosinusitis enrolled 70 patients, found CT positivity of 88.6 percent, endoscopy positivity of 82.9 percent, and dual positivity of 77.1 percent [8].
That dual positivity figure is the whole story for planning. In a paired design, both tests run on every patient, so the comparison hinges on discordant pairs, the patients one test flags and the other misses. A generic calculator that treats the two tests as independent groups ignores their correlation and will overstate the required sample size, sometimes dramatically. To plan a paired comparison properly, you need pilot estimates of how often the tests disagree, which means estimating the cells of the paired 2 by 2 table, not just each test's overall positivity. If your candidate calculator has no paired-proportions or McNemar-type module, it is the wrong tool for this design.
Scenario 3: Planning With Prior Evidence, the Bayesian Route
Imagine you are developing a rapid molecular panel for complicated urinary tract infections to run alongside culture. A published comparison of polymerase chain reaction against culture and sensitivity found good agreement in positive cases, 95.32 percent at baseline, but weaker agreement in negative cases, 62.91 percent at baseline [9]. Those numbers are exactly the raw material for priors.
Under the Bayesian power framework, you would encode an analysis prior and a design prior for sensitivity and specificity, and a design prior for prevalence, then specify a success criterion such as a posterior probability of at least 0.95 that sensitivity exceeds a minimum threshold [3]. The method sweeps across candidate sample sizes, updating the analysis prior for each possible future dataset, and selects the smallest N whose Bayesian power meets your criterion. Because the required sample size generally decreased as uncertainty in the design priors decreased [3], investing in a good pilot to sharpen your priors can directly shrink the confirmatory study.
The honest caveat is operational. This route demands someone comfortable with prior elicitation and predictive simulation, and you should expect extra scrutiny from reviewers less familiar with the approach.
Common Mistakes and Limitations
Using a two-means calculator for a proportion problem. The most common error in practice is reaching for the calculator you already know. If the tool asks for an effect size in standard deviation units, it is planning a group comparison, not a sensitivity estimate, and its output will be wrong for your design [2].
Ignoring prevalence. A calculation that returns 139 patients is only the diseased count. Teams that skip the prevalence step discover mid-study that they cannot enroll enough cases. Conversely, some teams deliberately over-sample diseased patients (an enriched or case-control style design), which is efficient for estimation but changes the population the estimates describe, and that choice must be declared in the analysis plan.
Planning only for sensitivity. Specificity needs non-diseased patients, and in low-prevalence settings the non-diseased requirement can quietly become the binding constraint. Compute both, and let the larger requirement drive total N.
No allowance for indeterminate results. Real studies lose patients to inadequate reference standard testing, uninterpretable index test results, and dropout. Build an explicit inflation factor into the final number.
Single-point inputs. Entering one optimistic sensitivity estimate produces one deceptively precise answer. Run the calculation across a plausible range, for example sensitivity 0.85 to 0.95, and report the range of required N. Software suites earn their keep here.
A vague target condition. If the case definition wobbles, the planned sample size describes a different study than the one you run. The sarcopenia literature illustrates the risk, a review of 283 original studies found 93.3 percent used measures of skeletal muscle mass for diagnosis, with dual energy X-ray absorptiometry the most common modality at 43.6 percent, yet criteria still varied across studies [10]. Fix the reference standard and case definition before fixing N.
Planning for a claim you will not make. Overinterpretation is a documented problem in this field, with evidence of spin in systematic reviews of diagnostic accuracy studies [11]. If your N supports a precise sensitivity estimate but not a comparison against the incumbent test, write the conclusion the sample size actually supports.
AI-based index tests. If the index test is a machine learning model, standard appraisal frameworks fall short, because QUADAS-2 does not address the unique considerations raised by AI-centered diagnostic systems, which is why the QUADAS-AI tool is being developed specifically for AI diagnostic accuracy studies [12]. Expect planning for such studies to involve additional considerations around dataset composition and validation design.
Calculators plan studies, clinicians treat patients. A sample size calculation is a research design tool, and individual diagnostic decisions for a patient belong with the treating clinician, not with a formula.
Frequently Asked Questions
What is a sample size calculator for diagnostic research?
It is a tool that converts your expected sensitivity or specificity, a target confidence interval width, and disease prevalence into the number of patients you need to enroll. Unlike general trial calculators, it plans around proportion precision rather than differences between group means.
Can I use a general clinical trial calculator for a diagnostic accuracy study?
Only if it includes a module for proportion precision or paired proportions. A calculator built exclusively for two-group mean comparisons will produce the wrong number for a sensitivity or specificity estimate.
How does prevalence change the required sample size?
Lower prevalence means you must screen more total patients to accumulate the required number of diseased cases. In the worked example above, moving from 30 percent to 10 percent prevalence nearly tripled the total enrollment while the diseased-patient requirement stayed fixed.
Do sensitivity and specificity need separate sample size calculations?
Yes. Each proportion has its own precision requirement, and the requirement for specificity, which depends on non-diseased patients, is often larger in low-prevalence settings. Plan for both and let the larger drive the total.
What is Bayesian sample size determination?
It is a planning approach that uses prior distributions for sensitivity, specificity, and prevalence, then finds the smallest sample size whose prior predictive probability of meeting a success criterion (Bayesian power) reaches your threshold. It can reduce required sample sizes when prior evidence is strong [3].
Are free online calculators reliable enough for a grant application?
Calculators published in peer-reviewed journals with documented formulas, such as the diagnostic accuracy tool from Akoglu's guide [1] or the general clinical tool from Wang and Ji [2], are reasonable starting points. Verify the output with a hand calculation and record the tool, version, and inputs in your protocol.
Sources
- User's guide to sample size estimation in diagnostic accuracy studies
- Sample Size Estimation in Clinical Research: From Randomized Controlled Trials to Observational Studies.
- Bayesian Power-Based Sample Size Determination for Diagnostic Accuracy Studies.
- BactiFIND : An Offline-First Mobile Application Integrating Multiple Diagnostic and Laboratory Tools for Clinical Microbiology and Antimicrobial Stewardship
- PediTools Electronic Growth Chart Calculators: Applications in Clinical Care, Research, and Quality Improvement
- External Validation and Extension of the NAPLS-2 and SIPS-RC Personalized Risk Calculators in an Independent Clinical High-Risk Sample
- National Estimates of the Participation of Patients With Cancer in Clinical Research Studies Based on Commission on Cancer Accreditation Data
- Comparison Between Diagnostic Nasal Endoscopy and Plain Computed Tomography of the Paranasal Sinuses in Chronic Rhinosinusitis.
- Clinical utility of PCR compared to conventional culture and sensitivity testing for management of complicated urinary tract infections in adults: Part II.Evaluation of diagnostic concordance, discordant results, and antimicrobial selection efficacy.
- Diagnostic Criteria and Clinical Outcomes in Sarcopenia Research: A Literature Review
- Overinterpretation of Research Findings: Evidence of "Spin" in Systematic Reviews of Diagnostic Accuracy Studies.
- Revised Tool for the Quality Assessment of Diagnostic Accuracy Studies Using AI (QUADAS-AI): Protocol for a Qualitative Study