How to Choose a Reliable Web Tool for Sequence Analysis
By Dr. Zubair Khalid, DVM, MS, PhD ·

A reliable sequence analysis web tool is one whose method is published, whose algorithm and database versions are documented, and whose performance has been checked on data its developers never used for training, while an unreliable one is a web form that returns numbers you cannot trace to any documented algorithm. The rule of thumb is simple: never build an experiment, a clinical call, or a manuscript on a tool you cannot cite, and never cite a tool whose method you cannot find in the peer-reviewed literature or official documentation.
This guide explains the signals of reliability, compares the main reliable bioinformatics web tools options in a side-by-side table, works through the criteria that decide real choices, and walks through three practical scenarios. By the end you should be able to match any sequence task, from a primer melting temperature calculation to a whole-genome resistance analysis, to a tool you can defend in a methods section.
What Makes a Bioinformatics Web Tool Reliable
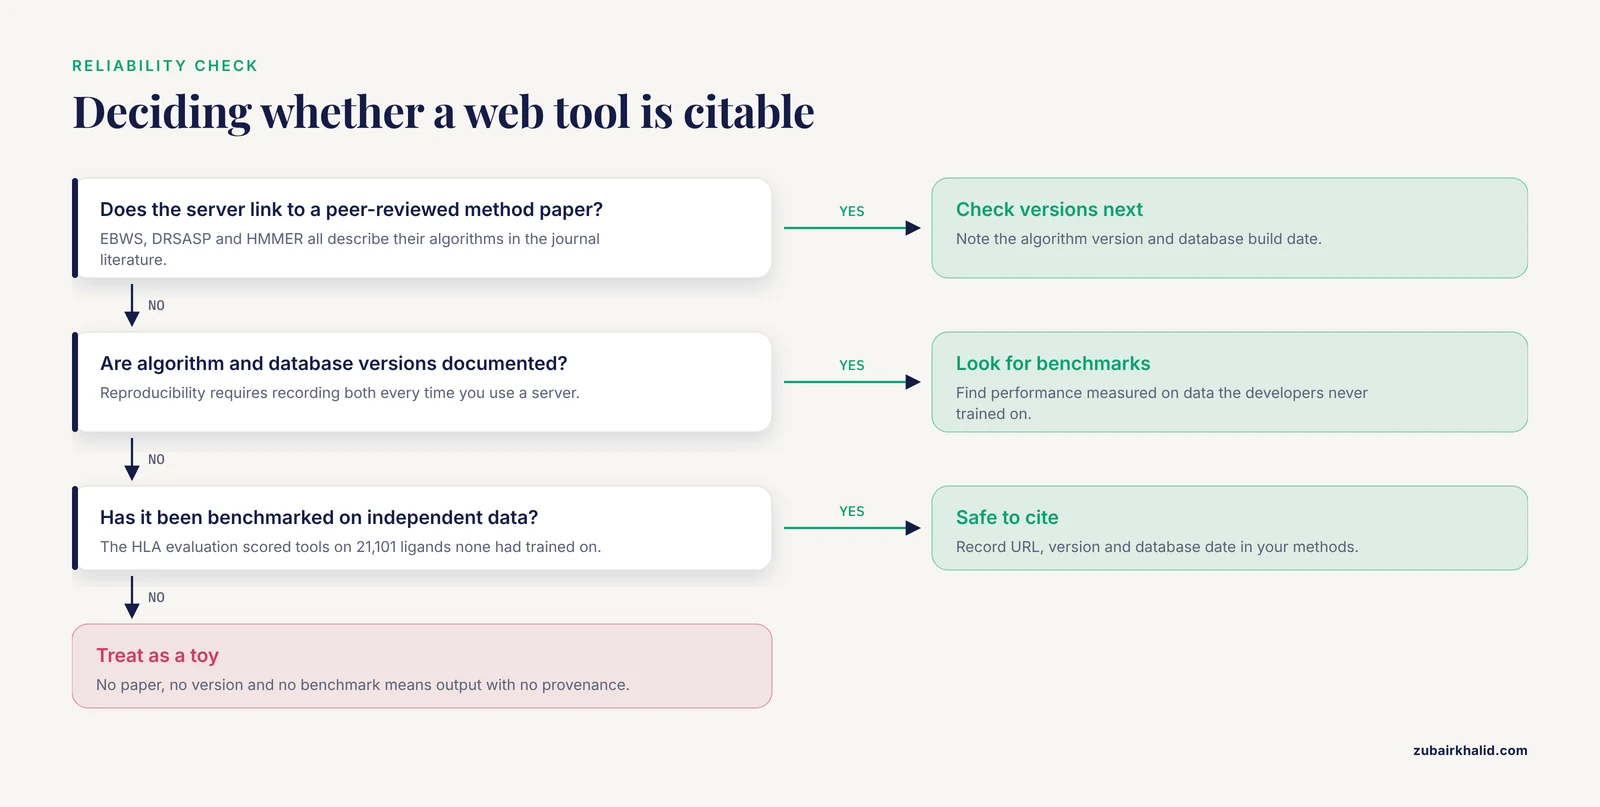
Six signals separate a tool you can defend in a methods section from one you should treat as a toy.
- A published, peer-reviewed method. Serious servers ship with a citation. The EBWS suite, the Dundee Resource for Sequence Analysis and Structure Prediction, and the HMMER web server all describe their algorithms in the journal literature, which means editors and reviewers examined the claims before publication [1][2][3]. A site that offers predictions with no paper, no documentation, and no version number gives you output with no provenance.
- Benchmarking on independent data. The strongest evidence for a predictor is measured performance on samples its developers never trained on. The comparison criteria section below shows what that looks like in practice.
- Active maintenance. Sequence databases grow continuously, and the HMMER team rebuilt their infrastructure with horizontal scaling and asynchronous job processing specifically to keep search performance acceptable as target databases expanded [3]. A server that has not been updated in years may be querying stale data.
- Transparent versions and parameters. Reproducibility requires knowing which algorithm version and which database build produced your result. Record both every time you use a server.
- Sensible data handling. Understand what happens to your sequence after upload, how long it is stored, and whether the operators claim any rights over it.
- More than one way in. The best tools offer a web form for interactive work and an application programming interface (API) for automation. HMMER provides a JSON-based API [3], PERCEPTRON-PTMKB exposes its search and propensity pipelines through a secure RESTful API [4], and the DRSASP services are reachable through web interfaces and APIs and integrate into the Jalview workbench [2].
Reliable Bioinformatics Web Tools Options at a Glance
The table compares the main reliable bioinformatics web tools options by task, standout strength, and ideal user. Citations point to the primary description of each tool.
| Tool or suite | What it does | Standout strength | Best for |
|---|---|---|---|
| EBWS [1] | DNA, RNA and protein utilities, melting temperature and PCR annealing calculators, restriction cutting, ORF finding, CRISPR guide design | Nine applets on one free server with no usage restrictions | Quick sequence calculations, primer design support, teaching |
| DRSASP (JPred4 and JABAWS) [2] | Secondary structure, solvent accessibility, multiple sequence alignment, disorder, conservation | Integrated into the Jalview workbench for multitool workflows | Protein family and structure-oriented analysis |
| HMMER web server [3] | Sequence similarity search and domain annotation with profile hidden Markov models | Regularly updated databases, JSON API, no login required | Identifying families and domains in new proteins |
| PROFASA [5] | Protein structure evaluation, parameter calculation, visualization, modeling | One-click AlphaFold2 or I-TASSER models plus collaboration tools | Structure analysis without coding |
| iLearn [6] | Feature extraction, selection, and machine learning modeling for DNA, RNA and proteins | Automated pipelines that choose optimal settings | Building sequence-based predictors |
| GENAVi [7] | RNA-Seq normalization and differential expression analysis | Bioconductor analysis inside a graphical interface | Biologists analyzing count data without programming |
| EpiMOLAS [8] | Whole-genome bisulfite sequencing methylation analysis | Docker container plus web server for reproducible runs | Methylation analysis from raw reads to downstream results |
| PredictONCO [9] | Automated interpretation of cancer missense variants | Fully automated structure- and sequence-based prediction | Variant annotation in precision oncology |
| PERCEPTRON-PTMKB [4] | Residue-level post-translational modification scoring | RESTful API for pipeline integration | PTM-aware protein sequence searches |
| RNA2DMut [10] | Design and analysis of RNA secondary structure mutations | Per-base effects of every possible point mutation | Designing RNA mutants for assays and structural work |
| DynamiSpectra [11] | Statistics and visualization for molecular dynamics trajectories | GROMACS input without programming or topology handling | Comparing simulation replicas |
| GeneRiskCalc [12] | Hardy-Weinberg testing, odds ratios, forest plots | Automated, cross-validated statistics on one page | Case-control genetic association basics |
| X-cross/over [13] | Crossover estimation from SNP datasets | Graph-based results comparable to expert analysis | Plant recombination studies |
| ColabCuraTE [14] | Manual curation of transposable elements | Browser-based pipeline with built-in visualization | Refining transposable element consensus sequences |
| PaREx and PDC analyzer [15] | Pseudomonas aeruginosa resistome from whole-genome sequences | Automated detection of mutation-driven and acquired resistance | Antimicrobial resistance profiling |
| HLA-I binding predictors [16] | Prediction of peptide binding to HLA class I allotypes | Benchmarked head to head on independent ligand data | Immunotherapy target selection |
A pattern emerges from the table. Broad platforms such as DRSASP, HMMER, PROFASA, and iLearn cover many questions at once, while focused tools such as RNA2DMut, X-cross/over, and PaREx go deep on one. Reliable projects exist at both scales, so the deciding factor is fit to your task, not breadth.
The Main Tool Categories Explained
Basic sequence utilities and the bioinformatics calculator
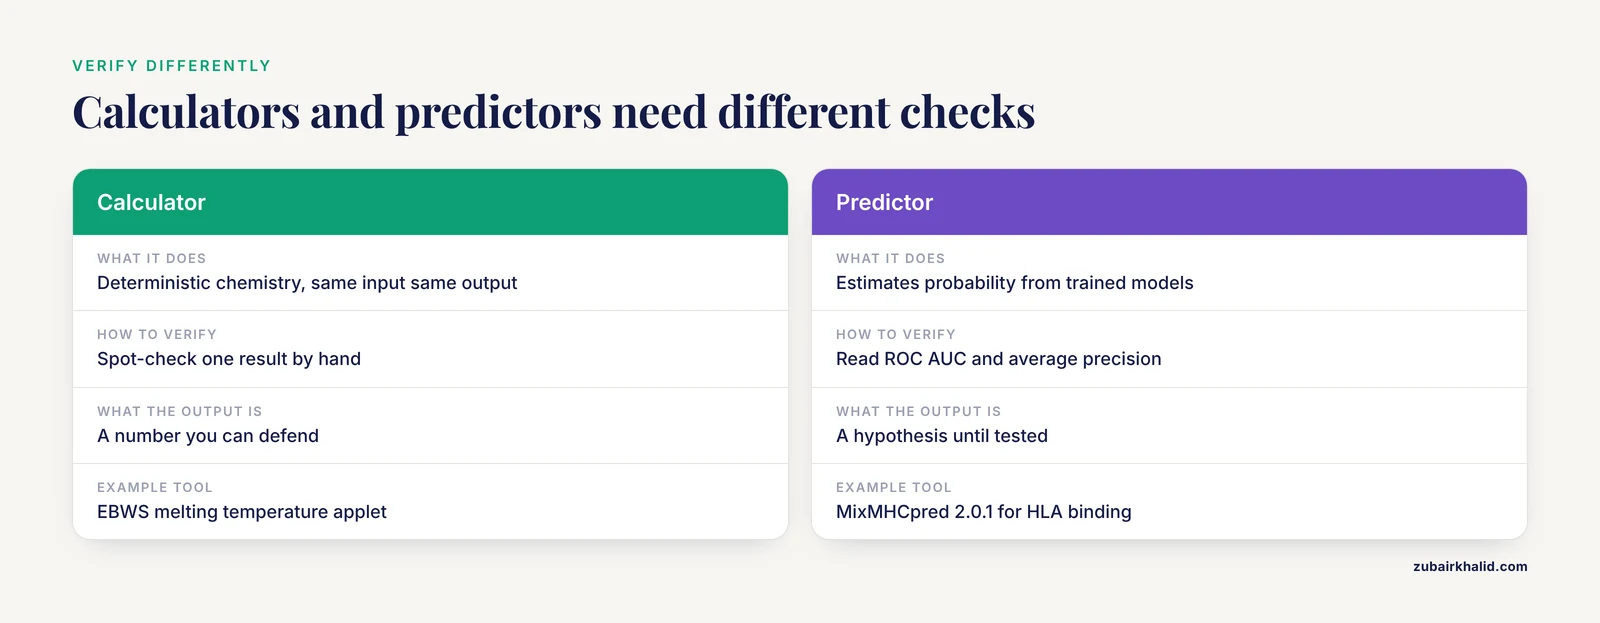
Every sequence project starts with small calculations, and a dependable bioinformatics calculator saves hours of manual work. The Essential Bioinformatics Web Services (EBWS) suite is a strong example of the category. It runs nine web applets on a single PHP-based server, covering reverse complementary DNA generation, random DNA, RNA, and peptide oligomer generation, pattern searching, restriction enzyme digestion, prokaryotic open reading frame (ORF) finding, and random mutation generation [1]. Its melting temperature (Tm) calculators handle DNA/DNA, RNA/RNA, and DNA/RNA hybrids, and a separate applet computes annealing temperatures for multiplex PCR, where several primer pairs must work in one tube [1]. Two details show why published tools beat anonymous calculators. The pattern searcher accepts any number of motif inputs and supports regular expression (Regex) quantifiers, which let you describe complex sequence patterns precisely. The restriction cutter draws on a database of 1,502 restriction enzymes, so an obscure cloning site will not be missing [1]. The suite also includes a guide RNA (gRNA) generator for CRISPR/Cas9 experiments that searches 25 bacterial genomes by default and accepts any user-supplied genome [1]. A biology calculator of this kind performs deterministic chemistry, meaning the same input always produces the same output, and that property makes it easy to verify against manual work.
Alignment, conservation, and structure prediction services
Multiple sequence alignment (MSA) arranges related sequences so homologous positions line up, and it underlies most evolutionary and structural inference. The Dundee Resource for Sequence Analysis and Structure Prediction (DRSASP) from the Barton Group bundles the JPred4 webserver for protein secondary structure and solvent accessibility prediction with JABAWS 2.2, which serves multiple sequence alignment, disorder prediction, amino acid conservation calculations, and specificity-determining site prediction [2]. Two features matter for reliability. The services are reachable through web interfaces and APIs, and they are integrated into the Jalview sequence analysis workbench, so you can chain several tools without retyping data [2]. The group reports that DRSASP services completed over 1.5 million jobs in the years since 2016, a sign of sustained real-world use and maintenance [2].
Homology search and domain annotation
Profile hidden Markov models (profile HMMs) are statistical models that capture the conserved pattern of an entire protein family, and they detect remote relatives that simple similarity searches miss. The HMMER web server, hosted at the EMBL-EBI Tools portal, gives browser access to the HMMER suite for searching sequences against regularly updated protein databases and for annotating sequences with domains and families from profile HMM libraries [3]. The 2026 update illustrates what active maintenance looks like. The team reengineered the interface with modern web technologies, added session-based search history, rewrote the API with JSON responses, and redesigned the infrastructure with horizontal scaling and asynchronous job processing so search speed keeps pace with growing databases [3]. The service is free, open to all users, and requires no login [3].
Protein structure workstations
PROFASA is a web-based protein workstation built around one-click operations for tasks that normally require technical expertise [5]. Users can construct protein models with I-TASSER or AlphaFold2 in a single step, generate new sequences and models, evaluate structures, calculate protein parameters, and visualize results [5]. Real-time collaboration, note sharing, and shared projects make it usable in a teaching laboratory where several people need to see the same analysis [5]. The developers designed it for users who lack the background most structural tools demand, while keeping customization options for professionals [5].
Feature engineering and machine learning
iLearn is a Python-based toolkit that integrates feature extraction, clustering, normalization, feature selection, dimensionality reduction, predictor construction, model selection, ensemble learning, and visualization for DNA, RNA, and protein sequences [6]. Its design target is the user who wants to upload a dataset, select the analyses needed, and let the software complete all procedures with optimal settings automatically [6]. The package includes 16 different types of feature algorithms and supports four output formats, so results can feed directly into other computational tools [6]. For a researcher building a sequence classifier, this replaces weeks of pipeline assembly.
Omics analysis with graphical interfaces
GENAVi (Gene Expression Normalization Analysis and Visualization) is a Shiny web application that wraps Bioconductor packages, the standard R libraries for high-throughput genomics, in a graphical interface for normalizing human or mouse feature count RNA-Seq data and running differential expression analysis [7]. Users can cluster samples, calculate and plot principal components, and perform gene set enrichment, and the tool ships with a panel of 20 commonly used breast and ovarian cancer cell lines as a foundation for bringing in their own data [7]. The developers built it precisely because the expertise to choose an analysis pipeline and the programming skill to apply one rarely sit in the same person [7].
EpiMOLAS extends the same philosophy to DNA methylation. Its two-phase framework runs whole-genome bisulfite sequencing (WGBS) workflows, which convert raw reads into single-nucleotide methylation calls, inside Galaxy and packages the computation environment as a Docker container image named DocMethyl, then links the resulting methylation tables to gene annotation databases on the EpiMOLAS_web server [8]. Containerization means a colleague can redeploy the identical environment without fighting software dependencies, which is what reproducible analysis requires [8].
Specialized biological predictors
This is the largest category, and the one where reliability matters most, because predictions guide experiments.
Post-translational modifications (PTMs) are chemical changes added to protein residues after translation, such as phosphorylation. A methods review of PTM web resources describes practical protocols for querying PTM databases, searching modification sites in sequences and structures, and calculating the pI and molecular mass of PTM isoforms, which lets researchers express protein modification in quantitative terms [17]. PERCEPTRON-PTMKB goes further by scoring each residue's propensity for modification based on its neighborhood, using empirical datasets, and it exposes the pipeline through a secure RESTful API so sequence search engines can call it directly [4].
For peptide immunotherapy, tools that predict whether a peptide binds a specific HLA class I allotype, a human immune presentation molecule, are central to target selection, and several mature options have been compared head to head in an independent benchmark (see the criteria section below) [16].
In precision oncology, PredictONCO automates the interpretation of missense variants, changes that alter a single amino acid. The server models the mutant protein structure, calculates stability changes, pocket information, evolutionary conservation, and ionization changes at catalytic residues, feeds these features to an XGBoost machine-learning predictor, and adds docking of approved small molecules [9].
For RNA researchers, RNA2DMut analyzes the effect of every possible point mutation on RNA secondary structure, the base-paired folding of an RNA molecule, using metrics based on the Boltzmann structure ensemble so that a robust preexisting structure model is not required [10]. Users can constrain mutations to specific residues or to purines and pyrimidines, which supports applications from mutant design for biological assays to improving RNA crystallization [10].
Statistical and genetics calculators
Association genetics involves a fixed set of calculations that are easy to get wrong by hand. GeneRiskCalc automates Hardy-Weinberg equilibrium (HWE) testing, which checks whether genotype frequencies match expectations for a population, along with odds ratios and 95 percent confidence intervals, and it generates forest plots for visualizing effect sizes across genetic models [12]. The developers cross-validated the outputs against established statistical methods and designed the interface to minimize prerequisite statistical expertise [12].
X-cross/over estimates meiotic crossover events, the exchange points between chromosome pairs during recombination, from SNP datasets in HapMap format using a graph-theoretical algorithm [13]. It was evaluated on publicly available barley backcross inbred populations and newly developed wheat doubled haploid lines, and it detected crossovers with high accuracy and sensitivity, producing results consistent with published genotyping and cytological analyses while remaining usable without bioinformatics expertise [13].
Domain-specific pipelines
Some reliable web tools serve a single organism, data type, or workflow, and their narrow focus is a strength because generic tools often miss biology-specific detail.
PaREx is an open-source pipeline for analyzing the resistome, the collection of resistance genes in a sample, of Pseudomonas aeruginosa from whole-genome sequences. It screens 221 chromosomal genes for mutation-driven resistance and detects horizontally acquired determinants, and its companion PDC analyzer web tool designates Pseudomonas-derived cephalosporinase variants [15]. The pipeline was demonstrated on 260 isolates, and the PDC analyzer was validated against more than 30,000 global genomes, achieving results comparable to manual bioinformatic analysis [15].
ColabCuraTE runs a transposable element curation pipeline in Google Colaboratory, so researchers refine repetitive DNA consensus sequences in a browser with built-in visualization and no local installation [14]. Validation on both megabase-sized and gigabase-sized genomes showed it reliably improves the quality and completeness of consensus sequences compared with automated de novo annotation alone [14].
DynamiSpectra automates the statistical analysis and visualization of molecular dynamics (MD) trajectories, the time courses of atom movements in simulations. It processes GROMACS-generated files directly, computes measures such as RMSD, radius of gyration, solvent accessible surface area, hydrogen bonds, and principal component analysis, and requires no topology file handling or programming expertise [11]. Comparative tests found its results consistent with widely used MD analysis packages [11].
How to Compare Tools: The Criteria That Decide Real Choices
Benchmark results beat popularity
Any shortlist of the best reliable bioinformatics web tools should come from head-to-head benchmarks, not from search rankings. The HLA class I evaluation is a model of how this works. Rather than trusting vendor claims, the authors collected an independent validation set of 21,101 experimentally verified ligands spanning 19 HLA-I allotypes and scored every tool on data none of the tools had trained on [16]. MixMHCpred 2.0.1 achieved the best performance for most allotypes studied, NetMHCpan 4.0 led the machine learning-based tools, and NetMHCcons 1.1 led the consensus-based tools [16]. When you choose a predictor, look for exactly this kind of independent validation in its publication.
Concordance between independent tools
When two well-built tools disagree, the disagreement is information. A study of HIV-1 drug resistance interpretation compared three systems (SmartVir, HyDRA Web, and the Stanford HIVdb algorithm) on routine next-generation sequencing data from 11 laboratories [18]. Valid coverage for resistance analysis ranged from roughly 71 to 75 percent depending on the tool, mutations present at frequencies above 10 percent showed fair concordance across systems, and low viral load and non-B subtypes reduced the data quality available for interpretation [18]. The practical lesson is to run critical calls through at least two independent tools and to define, in advance, the threshold at which you will accept a result.
Validation metrics you can read
Learn two numbers that appear in most predictor papers. The area under the receiver operating characteristic curve (ROC AUC) measures how well a tool separates true positives from true negatives across all thresholds, where 1.0 is perfect and 0.5 is chance. Average precision summarizes the same idea when positives are rare. PredictONCO reported ROC AUC values of 0.97 for structure-based and 0.94 for sequence-based prediction on held-out data, with average precision values of 0.99 and 0.94 [9]. Held-out means the model never saw those samples during training, which is what makes the numbers believable.
Usability versus control
Graphical interfaces lower barriers. PROFASA turns structure modeling into one-click operations while keeping customization for professionals [5]. GENAVi exists because pipeline expertise and programming skill rarely sit in the same person [7]. ColabCuraTE removes installation entirely by running in the browser [14], and X-cross/over produces results comparable to expert analysis without requiring bioinformatics training [13]. The trade-off is parameter visibility. A one-click workflow standardizes choices you might need to vary, so check how much control the interface exposes before committing a whole project to it.
Reproducibility infrastructure
Prefer tools that make your analysis repeatable. EpiMOLAS packages its computation environment as a Docker container so the identical setup can be redeployed anywhere [8]. The HMMER web server keeps session-based search history and documents its database updates [3]. APIs, such as the JSON endpoints at HMMER and the RESTful interface at PERCEPTRON-PTMKB, let you log calls programmatically instead of clicking through forms [3][4].
Reliable Bioinformatics Web Tools Pros and Cons
Pros of web-based tools:
- No installation, cross-platform access. Graphical applications hosted on web servers make complex workflows usable across operating systems and browsers without programming knowledge [7].
- Maintained compute and current data. Major servers scale their infrastructure as databases grow, so your search runs against up-to-date collections [3].
- Automation paths. APIs allow programmatic access and integration into larger pipelines [3][4].
- Lower expertise barriers. Browser pipelines with built-in visualization let researchers without bioinformatics training participate in analyses such as transposable element curation [14].
- Standardized, shareable workflows. Containerized frameworks and shared projects keep methods consistent across a team [8][5].
Cons of web-based tools:
- Data exposure. Uploading a sequence places it on someone else's server, so sensitive data needs a stated policy or a local alternative.
- Version drift. Results can change when a server updates its databases or algorithms, and older analyses may not be reproducible without version notes.
- Reduced parameter control. Simplified interfaces can hide settings that matter for unusual inputs, which is why some one-click tools also expose customization [5].
- Queue times and downtime. Popular public services process enormous job volumes, so long jobs may wait.
- Input size limits. Very large datasets may exceed what a web form accepts, pushing work toward local or containerized pipelines [8].
Worked Scenarios
Scenario 1: Designing primers for a multiplex PCR assay
You are planning a multiplex PCR, a reaction in which several primer pairs amplify different targets in the same tube. Start with the EBWS suite. Compute the melting temperature of each candidate primer with the DNA/DNA hybrid calculator, then use the dedicated annealing temperature calculator designed for multiplex conditions, where a single temperature must suit every pair [1]. Use the pattern searcher with Regex quantifiers to confirm each primer avoids unwanted motif matches, and if you plan to add restriction sites for cloning, check them against the 1,502 enzyme database in the DNA restriction cutter [1]. Because these are deterministic calculations, you can spot-check one primer by hand and confirm the server agrees.
Scenario 2: Annotating a newly sequenced protein
You have a protein sequence from an uncharacterized gene. Begin with the HMMER web server to search for similarity to known families and to annotate domains using profile HMM libraries [3]. Next, submit an alignment of your protein with its homologs to JABAWS for conservation calculation and disorder prediction, and run JPred4 for secondary structure and solvent accessibility [2]. Then take the structure question to PROFASA, which can build a model with AlphaFold2 or I-TASSER in one click and calculate basic parameters [5]. Finally, scan the sequence against PTM resources to identify candidate modification sites and compute the mass and pI of modified isoforms [17]. Each step uses a tool with a published method, so the whole annotation is citable.
Scenario 3: Selecting an HLA binding predictor for immunotherapy work
Your lab wants to shortlist peptides that bind a specific HLA class I allotype for a T-cell based experiment. Consult the benchmark literature first. On an independent validation set of 21,101 experimentally verified ligands across 19 allotypes, MixMHCpred 2.0.1 achieved the best performance for most allotypes, NetMHCpan 4.0 led the machine learning-based tools, and NetMHCcons 1.1 led the consensus-based tools [16]. Match the tool to your allotype, because performance varies across allotypes, and treat high-scoring peptides as candidates for experimental binding verification rather than as confirmed binders.
Common Mistakes and Limitations
- Trusting a single tool for a critical call. Independent interpretation systems for HIV drug resistance showed only fair agreement above defined mutation frequency thresholds, which is why careful laboratories cross-check with more than one system [18].
- Citing a tool without its version. Record the server URL, the tool version, and the database build date in your methods, or the analysis cannot be reproduced later.
- Pasting confidential data blindly. An upload is a disclosure. Read the data policy before submitting unpublished sequences.
- Confusing calculators with predictors. A bioinformatics calculator performs deterministic chemistry, such as a melting temperature, while a predictor estimates probability from trained models. Verify them differently.
- Choosing tools by search ranking instead of benchmarks. Popularity says nothing about accuracy on your data, as the HLA benchmark demonstrated [16].
- Skipping sanity checks on graphical output. A friendly interface reduces effort, not the need to inspect whether results make biological sense [7].
Web tools support analysis, they do not replace judgment. Experimental design, clinical interpretation, and statistical conclusions need qualified specialists, and a prediction from any server is a hypothesis until the laboratory tests it.
Frequently Asked Questions
What makes a bioinformatics web tool reliable?
A tool is reliable when its method is peer-reviewed, its algorithm and database versions are documented, and its performance has been verified on independent data. The fastest check is whether the server links to a citable publication and states when it was last updated.
Are online biology calculators accurate enough for real experiments?
Yes for deterministic calculations such as melting temperature, restriction mapping, and ORF finding, where the same input always gives the same output and the methods are published. Probabilistic predictors are different, and their outputs are hypotheses that laboratory experiments must confirm.
Which reliable bioinformatics web tools should a beginner start with?
Start with a sequence utilities suite for basic calculations, the HMMER web server for family and domain searches, and JPred4 for secondary structure prediction. All three run in a browser, require no programming, and have peer-reviewed descriptions.
Can web tools handle large datasets, or do I need command-line software?
Well-maintained servers handle large jobs because they run on scaled infrastructure, but repetitive or very large analyses belong in local or containerized pipelines. Check each server's stated input limits before you upload.
What should I do when two tools disagree about the same sequence?
Run a third independent tool, then check the benchmark literature to see which method performs better on data like yours. Disagreement usually reflects different training data or algorithms rather than a bug in either server.
Is it safe to upload unpublished sequences to a public web server?
Treat any upload as a disclosure until you have read the server's data policy. For sensitive data, prefer servers that state how long data is retained, or run equivalent software locally.
Sources
- EBWS: Essential Bioinformatics Web Services for Sequence Analyses.
- The Dundee Resource for Sequence Analysis and Structure Prediction.
- HMMER web server: 2026 update.
- PERCEPTRON-PTMKB: A Web Server for Residue-Based Post-Translational Modification Analysis and Propensity Scoring.
- PROFASA-a web-based protein fragment and structure analysis workstation.
- iLearn: an integrated platform and meta-learner for feature engineering, machine-learning analysis and modeling of DNA, RNA and protein sequence data.
- GENAVi: a shiny web application for gene expression normalization, analysis and visualization.
- EpiMOLAS: an intuitive web-based framework for genome-wide DNA methylation analysis.
- Analysis of mutations in precision oncology using the automated, accurate, and user-friendly web tool PredictONCO.
- RNA2DMut: a web tool for the design and analysis of RNA structure mutations.
- DynamiSpectra: A Python Software Package and Web Platform for Molecular Dynamics Data Analysis in Computational Biology.
- GeneRiskCalc: a web-based tool for genetic risk association analysis in case-control studies.
- X-cross/over: a web tool for graph-based estimation of meiotic crossover events in plants.
- ColabCuraTE: an easy-to-use, web-based pipeline for the manual curation of transposable elements.
- PaREx: an open-source pipeline for the automated analysis of Pseudomonas aeruginosa resistomes from whole-genome sequences.
- A comprehensive review and performance evaluation of bioinformatics tools for HLA class I peptide-binding prediction.
- Web-Based Computational Tools for the Prediction and Analysis of Posttranslational Modifications of Proteins.
- Comparison of Different HIV-1 Resistance Interpretation Tools for Next-Generation Sequencing in Italy.