Common Genetic Calculator Errors and How to Fix Them
By Dr. Zubair Khalid, DVM, MS, PhD ·
Most genetic calculator errors trace back to a single cause: the model built into the tool does not match the trait or dataset you fed it. A Punnett square tool assumes one diploid locus with clean dominance. A heritability calculator assumes a specific variance structure and balanced data. A bioinformatics calculator assumes clean input sequences. When any of those assumptions breaks, the arithmetic stays perfect and the answer still comes out wrong.
The first thing to check is not the software. Run the calculator on a worked example with a known answer, such as a standard test cross that must produce a 1:2:1 genotype ratio, or a published dataset with a reported result. If the known example reproduces, the tool works and the error sits in your inputs, your model choice, or your interpretation. If it does not reproduce, check the software version and settings before anything else.
This guide covers genetic calculator errors in order, from the most common causes to the rarest, explains the mechanism behind each failure, and gives concrete fixes you can apply to any biology calculator or bioinformatics calculator workflow.
What a Genetic Calculator Actually Computes
A genetic calculator is any tool that turns genetic inputs into a computed output. In teaching and breeding, a biology calculator covers Punnett squares, Hardy-Weinberg equilibrium checks, chi-square ratio tests, and heritability estimators. In sequence analysis, a bioinformatics calculator covers error-rate estimation, allele frequency counting, genomic relationship matrices, and estimated breeding values. The labels differ, the failure modes do not. Every one of these tools encodes a model of how genes behave, and every one inherits the quality of the data you supply.
That dual dependency explains most trouble. A calculator cannot tell you that your expected ratio is wrong for an epistatic trait, that your pedigree contains a misassigned parent, or that your sequencing reads carry PCR artifacts. It computes faithfully on whatever assumptions and inputs it receives.
Troubleshooting Genetic Calculator Errors: Symptoms, Causes, and Fixes
Use this table as a first-pass index. Each row is expanded in the sections that follow.
| Symptom | Likely cause | How to confirm | Fix |
|---|---|---|---|
| Offspring ratios miss 3:1 or 9:3:3:1 | Trait needs a two- or three-gene epistatic model | Fit single-gene and multi-gene models, compare fit statistics | Adopt the best-fitting model and derive its expected ratio |
| Chi-square rejects a visually close ratio | Wrong degrees of freedom or wrong expected ratio | Recount classes, recompute degrees of freedom, check expected counts | Correct degrees of freedom, pool rare classes, use an exact test for small samples |
| Heritability near 1.0 but weak selection response | Broad-sense H2 reported where narrow-sense h2 is needed | Check which variance components the tool sums | Use additive variance over total variance for response prediction |
| Two tools give different heritability for the same data | Different estimation methods | Compare method notes, rerun both on balanced data | Match method to design, report the method with the estimate |
| Genetic variance shifts after adding fixed effects | Environmental or sex-linked effects were absorbed as genetic | Refit with and without fixed effects | Include herd, year, sex, and sex-linked components |
| Parent-offspring relationship far from 0.5 | Pedigree error or sample swap | Scan for Mendelian inconsistencies and opposing homozygotes | Correct the pedigree, verify parentage, recompute |
| Impossible ratios in tetraploid crosses | Diploid calculator applied to a polyploid | Confirm ploidy, test tetrasomic against disomic models | Use a polysomic inheritance calculator with a pairing model |
| Variant counts flooded with rare calls | PCR and library preparation artifacts | Check strand bias, duplicate rates, chimeric reads | Add sample duplicates, duplex methods, artifact filters |
| Population history estimates unstable | Haplotype phasing errors in a small sample | Benchmark against simulated data with known truth | Use phasing-robust tools, treat estimates as approximate |
| Output looks right but downstream data look wrong | Corrupted inputs, image or sequence artifacts | Inspect raw images, read lengths, source traces | Preprocess inputs, filter outliers, verify against raw data |
Error 1: Wrong Inheritance Model
The most common genetic calculator error is feeding the tool a model the trait does not follow. Single-locus calculators expect one gene with two alleles and simple dominance. Many real traits refuse that structure.
Pericarp pigmentation in Corn Belt dent maize shows how far real crosses drift from textbook ratios. Researchers screened 10 doubled haploid biparental populations segregating for pigmented pericarp and tested qualitative genetic models with chi-square tests. For 9 of the 10 populations, inheritance best fit a two- or three-gene epistatic model rather than a single-locus ratio [1]. Epistasis means one gene's effect depends on the genotype at another gene. A Punnett square tool loaded with a 3:1 expectation would reject the true model and flag perfectly good data as anomalous.
Gene number is only half the problem. Gene action is the other half. Androgenesis response in pepper, the tendency of anthers to produce haploid plants, is controlled by roughly two genes, but additive effects account for only 21 percent of gene action while dominance effects account for 79 percent [2]. A calculator that assumes additive inheritance will mispredict both the segregation ratios and the response to selection.
How to fix it. Derive the expected ratio from the cross design and everything known about gene action before touching the calculator. Where the model is unknown, fit several candidate models and let the fit statistics decide, as the maize study did. If the trait varies continuously rather than in discrete classes, stop using ratio calculators entirely and move to quantitative methods.
Error 2: Chi-Square and Ratio-Testing Mistakes
The chi-square goodness-of-fit test compares observed offspring classes against an expected ratio, and it is the standard place for calculator errors to hide. Three mistakes dominate.
First, wrong degrees of freedom. Degrees of freedom equal the number of classes minus 1, minus any parameters estimated from the data. A two-class test has 1 degree of freedom, a four-class test has 3. A calculator fed the wrong class count silently uses the wrong distribution.
Second, wrong expected ratio. The test compares data against whatever expectation you supply. Supply the wrong one and a correct test rejects a correct dataset, which is the failure mode described in Error 1.
Third, forcing continuous traits into ratio tests. The maize pigmentation work made this split explicit. Discrete pericarp classes were tested with chi-square, while pigment intensity across 1,327 inbred lines was measured quantitatively as hue calculated from RGB pixel values and then mapped with quantitative trait locus and genome-wide association methods [1]. Intensity is not a ratio, and pushing it through a goodness-of-fit calculator destroys the information.
How to fix it. Confirm the class count, recompute degrees of freedom, and check that every expected class count is adequate before trusting a rejection. For small samples, use an exact test. For continuous measurements, use quantitative tools.
Error 3: Heritability Confusion, H2 Versus h2
Heritability calculators return a number between 0 and 1 that means very different things depending on which variance components were summed. Broad-sense heritability (H2) is total genetic variance divided by total phenotypic variance. Narrow-sense heritability (h2) is additive variance divided by total phenotypic variance, and only additive variance predicts response to selection.
The pepper androgenesis data make the gap concrete. Broad-sense heritability came out at 0.97 while narrow-sense heritability was 0.20, because dominance variance (89.9) dwarfed additive variance (23.9) within the total genetic variance of 113.8 [2]. A breeder reading only the 0.97 would expect strong selection response and receive roughly a fifth of it.
Method choice changes the number too. The CEBAS-CSIC almond breeding program assembled over 17,500 individuals and more than 30 years of phenotypic records, then estimated heritability for flowering, maturity, and productivity with classical methods (midparent-offspring regression and between/within family variance components) and with a Bayesian linear mixed model implemented in the MCMCglmm R package. Classical approaches produced the highest heritability values, while the Bayesian mixed models handled the unbalanced data and yielded repeatability estimates ranging from 0.15 to 0.56 [3]. Same trait, same population, materially different answers depending on the estimator.
Variance prediction carries a related trap. Calculators that predict genetic variance from summed marker effects ignore recombination. In maize and wheat, the contribution of crossing over to genetic variance ranged from positive values of 7 percent and 16 percent in two maize populations to negative values between -74 percent and -25 percent in five others [4]. Recombination can destroy favorable allele combinations as well as create them, so treat marker-effect-based variance predictions as rough approximations.
How to fix it. Read the tool documentation and identify which estimate it returns. Match the estimator to the design. Report the method next to every heritability number you publish or act on.
Error 4: Ignored Fixed Effects and Unbalanced Data
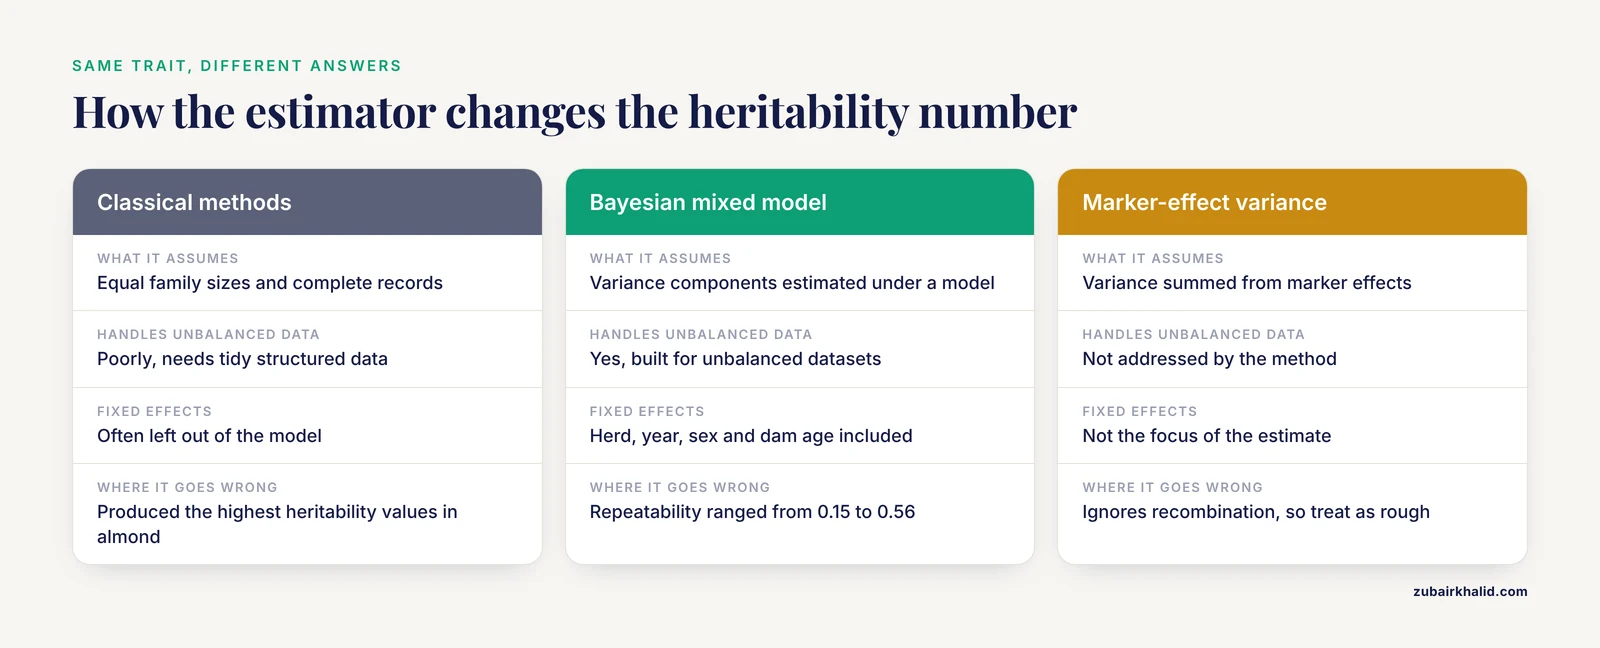
Quantitative genetics calculators partition phenotypic variance into genetic and environmental components. Fixed effects are systematic environmental factors such as herd, year, season, sex, or age of the dam. When they are left out of the model, their influence gets absorbed into the genetic term and inflates the estimate.
Growth traits in Murciano-Granadina goats illustrate the size of the distortion. In a multivariate animal model analysis of 19,582 birth weight records, excluding sex-linked chromosomal effects from the optimal model increased autosomal additive genetic variance by 3 to 14 percent and residual variance by 7 to 20 percent [5]. The calculator was not wrong, the model specification was.
Unbalanced data create a second layer of trouble. Simple variance calculators assume equal family sizes and complete records. Long-term breeding datasets are never that tidy, which is why the almond program turned to Bayesian mixed models that estimate variance components, breeding values, and repeatability under unbalanced conditions, computing estimated breeding values for every individual, including animals with no phenotypic records of their own [3].
How to fix it. List the environmental effects that could plausibly influence the trait and include them as fixed effects. Check the balance of the design. If records are missing in structured patterns, use mixed-model software rather than a simple variance calculator.
Error 5: Pedigree and Genotype Mismatches
Relationship calculators, inbreeding coefficients, and estimated breeding values all assume the pedigree is correct. When it is not, the calculator happily produces precise numbers about the wrong family.
Molecular genotypes expose these errors through Mendelian inconsistencies, offspring genotypes that a stated parent could not have produced. In a selected Australian Angus population of 11,224 animals genotyped for 61,105 autosomal markers, the additive genomic relationship averaged 0.488 (SD 0.037) for parent-offspring pairs and 0.483 (SD 0.054) for full-sib pairs against a theoretical expectation of 0.5, and opposing homozygote counts among full sibs ran at about half the count among half sibs, matching theory [6]. Those small, systematic departures are the healthy baseline. Large departures from them mark misassigned parents or swapped samples.
How to fix it. Before computing anything downstream, scan for Mendelian inconsistencies marker by marker. Compare genomic relationships against pedigree expectations for each relationship class. Investigate outliers, correct the pedigree, and only then run the relationship or inbreeding calculator.
Error 6: Ploidy and Segregation Model Errors
Diploid calculators assume two alleles per locus and one pairing pattern at meiosis. Polyploids break both assumptions. A tetraploid carries four alleles per locus, and its chromosomes can pair in groups of four (tetrasomic inheritance) or preferentially as pairs from the same ancestral genome (disomic inheritance).
Citrus provides the worked example. Tetraploid pummelo and mandarin behave as autotetraploids built from a single genome, while sour orange is an allotetraploid interspecific hybrid of pummelo and mandarin genomes. Researchers used polymorphic SSR and SNP markers to estimate parental heterozygosity restitution and allele frequencies at centromeric loci to calculate preferential pairing rates, separating disomic from tetrasomic segregation across the three genotypes [7]. The inheritance pattern differed with phylogenomic structure, which means no single diploid-style ratio could describe all three.
How to fix it. Confirm ploidy before choosing a calculator. For polyploids, use tools that support polysomic inheritance and let you specify or estimate the preferential pairing rate. If your tool has no polyploid mode, the ratios it returns for tetraploid crosses are not interpretable.
Error 7: Sequencing Artifacts That Poison the Numbers
Bioinformatics calculators compute from sequencing reads, and a large share of their errors are actually upstream laboratory artifacts wearing the costume of biology. Several artifact classes recur.
PCR errors come first. In circulating cell-free DNA sequencing, early and random PCR errors are a principal source of next-generation sequencing noise, and they persist despite duplex molecular barcoding and suppression of patterned errors. Sample duplicates were necessary to eliminate the stochastic noise and expose true very low frequency variants [8]. If your error-rate calculator reports more noise than expected, early-cycle PCR is a leading suspect.
Fixed tissue adds its own artifacts. Formalin-fixed paraffin-embedded (FFPE) samples generate chimeric reads that appear to come from non-contiguous genome segments. A large proportion of these strand-split artifact reads (SSARs) align to both the Watson and Crick strands of the reference genome, and S1 nuclease treatment that removes single-stranded fragments and overhangs reduced the artifacts along with sequence bias, base error rates, and false positive copy number and single nucleotide variant calls [9].
Transposable element detection faces the same problem at higher severity. A pipeline built for somatic AluYa5 insertion detection paid particular attention to artifacts arising during library preparation, and its filtration parameters removed at least 80 percent of artifacts while preserving 75 percent of potentially somatic insertions [10]. Without that filtration layer, the insertion counter reports artifacts as biology.
Amplification length matters too. In PacBio full-length 16S rRNA library preparations, longer amplicons accumulate more PCR error, and overamplified fixed-cycle libraries degrade. An autonormalization approach that stops each reaction during exponential amplification at a real-time fluorescence threshold kept residual error rates below 0.005 percent across seven specimen types [11]. A fixed-cycle assumption (20, 24, or 30 cycles for every sample) fails when input biomass varies widely between samples.
Structural variant junctions need their own error control. Duplex sequencing, which requires confirmation of a variant on both strands of a source DNA molecule, eliminated false junctions arising from chimeric PCR, while tagmentation-based libraries combined with strand family size filtering reduced both chimeric PCR and intermolecular ligation artifacts in the svCapture workflow [12].
Safety note. FFPE workflows expose staff to formalin, which is toxic and a regulated carcinogen. Perform fixation, cutting, and deparaffinization under a fume hood with nitrile gloves and eye protection, and follow your institution's chemical hygiene plan. Standard PCR and gel-imaging steps also carry routine chemical and UV hazards, so apply the personal protective equipment your laboratory's protocols require.
How to fix it. Add sample duplicates for low frequency variant work, apply duplex or single-molecule error correction where the variant class demands it, use artifact filters tuned to the library method, and avoid overamplification by normalizing PCR cycles to input amount.
Error 8: Phasing Errors in Population Genetics Tools
Population genetics calculators that reconstruct ancestral recombination graphs (ARGs) depend on computationally phased haplotypes, and phasing accuracy drops in the small and medium samples typical of non-model organisms. The concern is real but smaller than assumed. A benchmark of four ARG inference tools (Relate, SINGER, Threads, and tsinfer+tsdate) under simple and realistic demographic models found only slight performance degradation when computational phasing replaced accurate phasing, measured across pairwise coalescence times, recombination breakpoint counts, and branch-length-based diversity [13].
How to fix it. Prefer tools benchmarked for phasing robustness. Where possible, validate against simulated data with known truth. Report the phasing method and sample size alongside any ARG-based estimate, and treat the outputs as approximations when phasing is uncertain.
Error 9: Corrupted Inputs, From Images to Protein Sequences
Calculators amplify whatever defects ride in on the input files. Three input classes fail often enough to deserve their own checks.
Microarray expression values are extracted from images through preprocessing, gridding, segmentation, and intensity quantification, and the image generation step itself is error-prone, producing structural problems that propagate into gene expression calls. Contrast enhancement driven by a genetic algorithm outperformed adaptive histogram equalization and multi-decomposition histogram equalization before gridding in comparative testing on cDNA microarray images [14]. If an expression calculator returns noisy values, inspect the image pipeline first.
Automated image stitching can fabricate findings. In ultra-widefield retinal imaging, an automated montage misidentified the optic nerve head in one source image, misaligned the stitched result, and created the false appearance of a fourth retinal hemangioblastoma that clinical examination did not confirm [15]. Any calculator that assembles outputs from pieces can make the same class of error, so verify surprising results against the raw sources.
Protein sequence databases carry artifacts of their own. Clustering bacterial proteomes with MMseqs2 shows that core protein clusters have highly uniform lengths, so proteins shorter than 75 percent of the cluster mode length are usually artifacts from frameshifts, premature termination codons, or initiation codon choice, and at least 80 percent of short-outlier genomes contain mode-length copies that annotation missed [16]. Length filters catch most of these before they reach downstream calculators.
How to fix it. Build input quality checks into every workflow. Inspect raw images before quantification, filter sequence length outliers, and trace any surprising calculator output back to the raw data before acting on it.
A Short Diagnostic Sequence
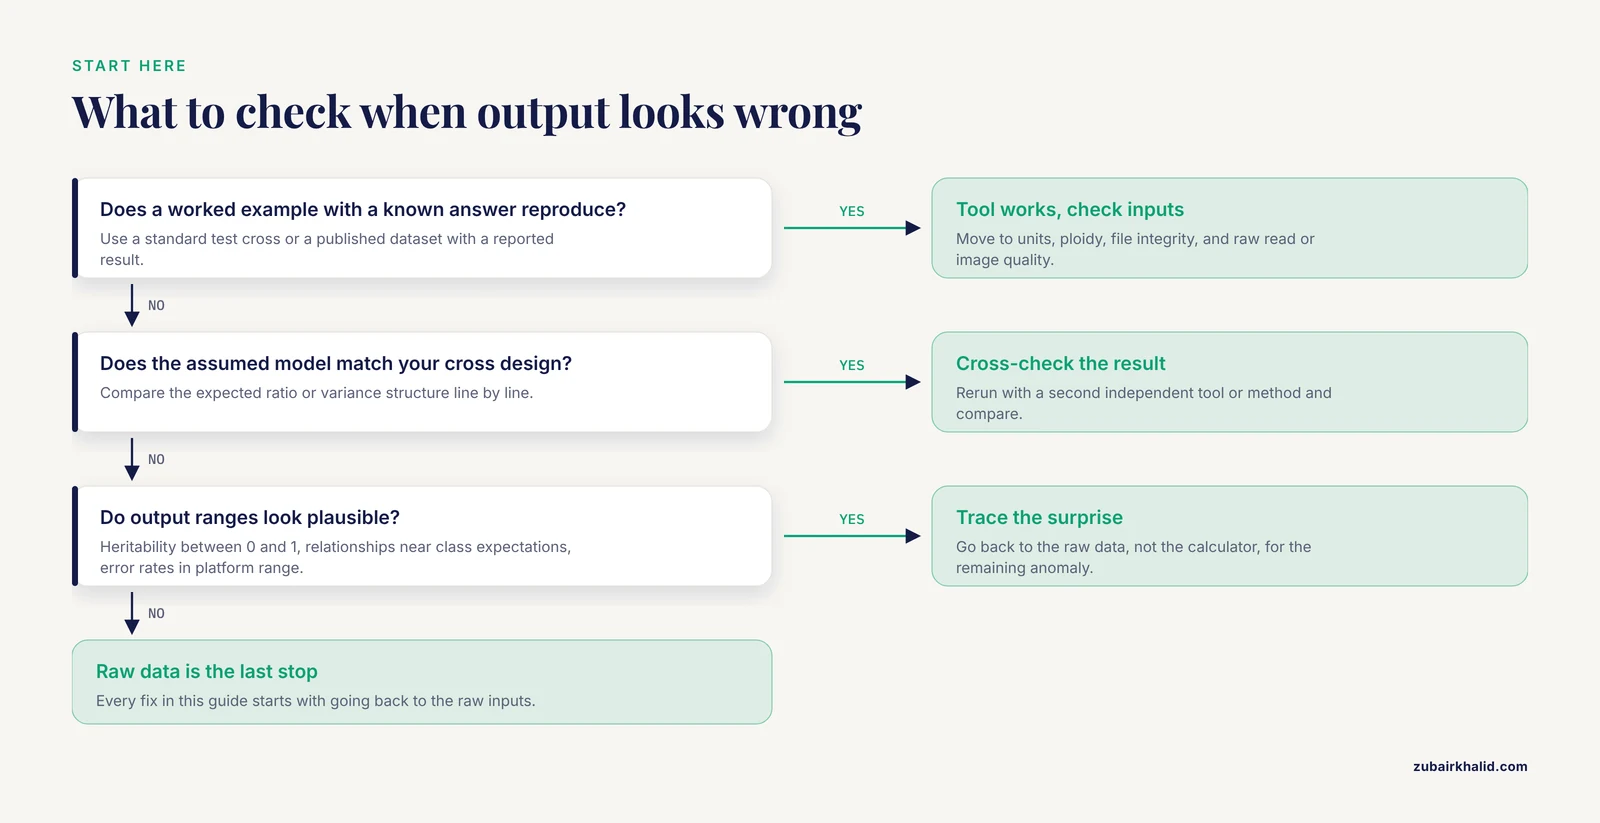
When output looks wrong, work through this list in order.
- Reproduce a known answer. Run the calculator on a worked example with a published result. Failure here points to the tool or its settings.
- Verify the inputs. Check units, ploidy, file integrity, and raw read or image quality.
- Write down the model the calculator assumes, then write down your cross design and the expected ratio or variance structure. Compare them line by line.
- For ratio tests, recount classes, recompute degrees of freedom, and check expected class counts.
- Refit quantitative models with and without fixed effects and compare the variance components.
- Cross-check the result with a second, independent tool or method.
- Sanity-check the output ranges. Heritability must fall between 0 and 1, genomic relationships should land near their class expectations, and error rates should match the platform's documented range.
- Trace any remaining surprise back to the raw data, not to the calculator.
Prevention Practices
Prevention costs less than diagnosis. These habits remove most of the errors above before they happen.
- Keep a small test suite of known-answer examples and run it after every software update or setting change.
- Record software versions, parameter settings, and filter thresholds with every analysis so results can be reproduced exactly.
- Match the calculator to the design before collecting data, not after. A polyploid cross planned around a diploid calculator wastes a season.
- Report the estimation method with every number. An h2 value without its method is not interpretable.
- Use reliability or uncertainty measures to weight results, and rank candidates only above a reliability threshold you set in advance.
- For selection decisions across multiple traits, use frameworks built for the purpose, such as multivariate selection models with explicit genetic parameters and scripted, repeatable calculation steps [17].
- Archive the raw data. Every fix in this article starts with going back to the raw inputs.
Common Mistakes and Limitations
- Treating calculator output as measurement. Heritabilities, breeding values, and error rates are estimates with uncertainty, not physical constants.
- Copying expected ratios from memory. Derive them from the cross design every time, because epistasis and linkage change them.
- Using broad-sense heritability to predict selection response. Only additive variance responds to selection the way most calculators assume.
- Ignoring data balance and fixed effects, then blaming the tool when variance components shift.
- Trusting a single tool. Classical and model-based estimators of the same trait can disagree materially, so cross-check before deciding.
- Skipping input quality control. Image artifacts, frameshift-derived short proteins, and PCR noise all masquerade as results.
- Individual cases need a professional. A veterinarian should interpret any calculator output before animal health or breeding decisions follow, and human genetic questions call for a clinical genetics professional. Calculators inform decisions, they do not make them.
Frequently Asked Questions
Why do my calculated ratios not match my offspring counts?
The most common reason is that the trait does not follow the single-gene model your calculator assumes. Epistasis, multiple genes, linkage, and small sample size all shift observed ratios away from textbook expectations. Test alternative models before concluding the tool failed.
What is the difference between broad-sense and narrow-sense heritability?
Broad-sense heritability (H2) sums all genetic variance, including dominance and epistatic effects. Narrow-sense heritability (h2) counts only additive variance, the portion that responds to selection. Use h2 when predicting selection response.
Why does my chi-square test reject a ratio that looks close?
Chi-square is sensitive to sample size, so with many offspring even tiny deviations become statistically significant. Also verify your degrees of freedom and confirm the expected ratio matches the actual cross design.
Can I use a diploid calculator for tetraploid plants?
No. Tetraploids segregate under tetrasomic or disomic models, often with preferential pairing, and a diploid tool returns ratios that are impossible or misleading for them. Use a calculator with a polyploid mode.
Why does my sequencing error rate look too high?
Most excess error comes from PCR and library preparation artifacts rather than the sequencer itself. Early random PCR errors can persist even with molecular barcoding, so add sample duplicates and artifact filters before trusting the number.
How do I check whether my pedigree matches my genotypes?
Scan for Mendelian inconsistencies, meaning offspring alleles that a stated parent cannot carry. Genomic relationship estimates and opposing homozygote counts also flag pairs whose recorded and actual relationships disagree.
Do calculator predictions replace measured breeding data?
No. Estimated breeding values and selection indices are predictions whose accuracy depends on data quantity, balance, and model fit. Reliability values indicate how much weight each prediction can carry.
What is the first thing to check when a genetic calculator gives strange output?
Run the tool on a worked example with a known answer, such as a standard test cross or a published dataset. If the known example reproduces, the problem lies in your inputs or model choice, not the tool.
Sources
- Genetic analysis of pericarp pigmentation variation in Corn Belt dent maize.
- Inheritance of androgenesis response in pepper.
- Genetic evaluation of flowering, maturity time and productivity in almond (Prunus dulcis): heritability estimates and breeding value predictions.
- Contribution of crossing over to genetic variance in maize and wheat populations.
- Deciphering autosomal and X-linked genetic effects of early growth traits in Murciano-Granadina goats via a multivariate animal model.
- Short communication: genomic kinship, opposing homozygotes and genetic diversity in a selected population of Australian Angus cattle.
- Inheritance pattern of tetraploids pummelo, mandarin, and their interspecific hybrid sour orange is highly influenced by their phylogenomic structure.
- The stochastic nature of errors in next-generation sequencing of circulating cell-free DNA.
- Sources of erroneous sequences and artifact chimeric reads in next generation sequencing of genomic DNA from formalin-fixed paraffin-embedded samples.
- [[A Pipeline for the Error-free Identification of Somatic Alu Insertions in High-throughput Sequencing Data].](https://pubmed.ncbi.nlm.nih.gov/30895963/)
- Applying PCR cycle autonormalization to PacBio full-length 16S rRNA library preparations: impacts on error rates and sequence distributions.
- svCapture: efficient and specific detection of very low frequency structural variant junctions by error-minimized capture sequencing.
- Robustness of Ancestral Recombination Graph Inference Tools to Phasing Errors.
- Microarray Images Contrast Enhancement and Gridding Using Genetic Algorithm.
- Montage Error in Ultra-Widefield Imaging of Retinal Hemangioblastomas.
- Early terminated transcripts and missing proteins reflect artifacts in bacterial proteomes.
- A novel selection model based on multivariate methods and arbitrary genetic parameters: a case study on tomato families.