Control Group Definition: Meaning and Examples in Research
By Dr. Zubair Khalid, DVM, MS, PhD ·
A control group is the group in a study that does not receive the treatment being tested. Researchers compare it with the experimental group to see whether the intervention actually caused the change in outcomes. Without a control group, you cannot tell whether an improvement came from the treatment or from time, expectation, or other outside factors.
Quick Answer
- A control group is the baseline comparison group in an experiment. It gets no treatment, a placebo, or the current standard treatment.
- Its job is to show what would have happened without the new intervention.
- Random assignment places participants into the control or experimental group so the groups start out similar.
- The difference between group means is the estimated treatment effect.
- A control group does not prove causation on its own, but it is one of the strongest tools for ruling out alternative explanations.
What Control Group Means
In plain terms, the control group is the reference point. If you test a new study method with one class and give a second class the usual method, the second class is your control group. Any gap between the two classes is evidence about the new method.
The precise statistical definition is narrower. A control group is a set of units that is treated identically to the experimental group in every way except for the intervention under study. The only systematic difference between the groups is the treatment itself. That single difference is what lets you attribute a change in the outcome to the treatment.
Control groups appear in many forms. A clinical control group can be a placebo arm, or it can be an old treatment used as the standard of comparison when testing a new idea [1]. In a superiority trial, the control group is often the older medication, and the question is whether the new drug beats it [1]. The common thread is that the control group represents the counterfactual: what the outcome would look like without the new intervention.
How It Works
The mechanism is comparison. You measure the outcome in both groups, then estimate the treatment effect as the difference between the group means.
$$ \hat{\tau} = \bar{X}_{\text{treatment}} - \bar{X}_{\text{control}} $$
Each symbol means:
- $\hat{\tau}$ (tau-hat) is the estimated treatment effect.
- $\bar{X}_{\text{treatment}}$ is the mean outcome in the experimental group.
- $\bar{X}_{\text{control}}$ is the mean outcome in the control group.
To judge whether that difference is larger than chance, you use a test statistic. For two independent groups, the pooled t statistic is:
$$ t = \frac{\bar{X}_{\text{treatment}} - \bar{X}_{\text{control}}}{s_p \sqrt{\frac{1}{n_1} + \frac{1}{n_2}}} $$
Here $s_p$ is the pooled standard deviation, and $n_1$ and $n_2$ are the group sizes. The denominator is the standard error of the difference. A large $t$ relative to its degrees of freedom means the gap is unlikely to be random noise.
Random assignment is what makes this work. When participants are randomly assigned to the control or experimental group, the groups tend to be balanced on age, health, and other traits before the study begins [2]. That balance is what supports the claim that the treatment, and not some pre-existing difference, produced the result.
Worked Example
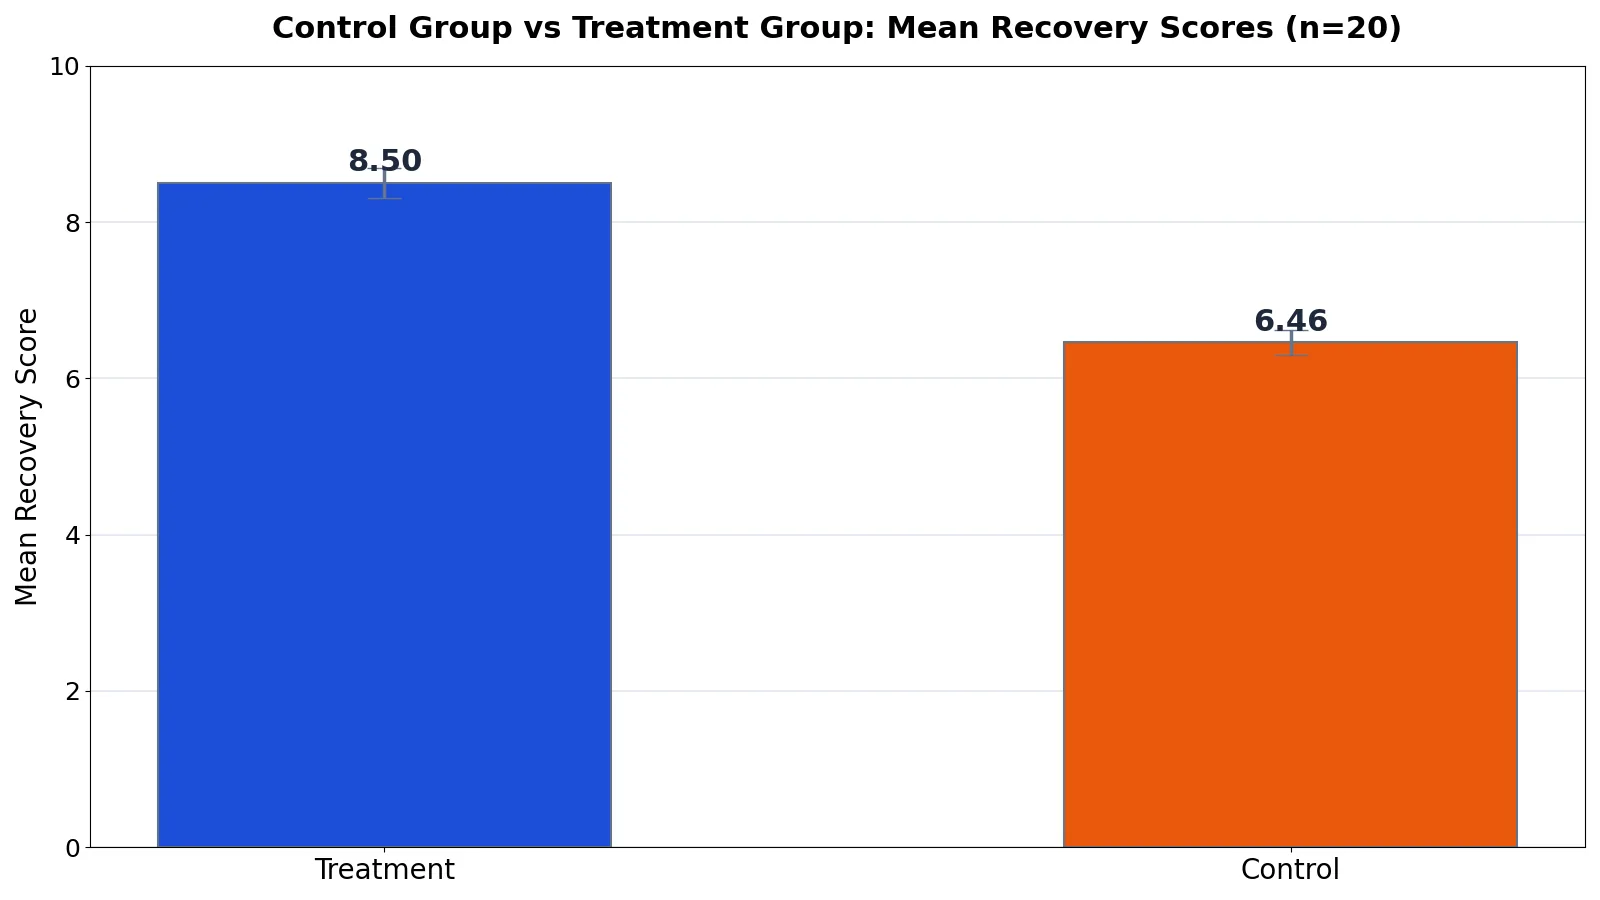
Consider a drug trial with 20 participants split into a treatment group (n=10) and a control group (n=10). Recovery scores are measured on a 0 to 10 scale. The control group receives a placebo.
| participant_id | group | recovery_score |
|---|---|---|
| 1 | Treatment | 8.2 |
| 2 | Treatment | 7.5 |
| 3 | Treatment | 9.1 |
| 4 | Treatment | 8.8 |
| 5 | Treatment | 7.9 |
| 6 | Treatment | 9.4 |
| 7 | Treatment | 8.6 |
| 8 | Treatment | 8.0 |
| 9 | Treatment | 9.2 |
| 10 | Treatment | 8.3 |
| 11 | Control | 6.1 |
| 12 | Control | 6.8 |
| 13 | Control | 5.9 |
| 14 | Control | 7.2 |
| 15 | Control | 6.5 |
| 16 | Control | 6.0 |
| 17 | Control | 7.1 |
| 18 | Control | 6.3 |
| 19 | Control | 5.8 |
| 20 | Control | 6.9 |
Step by step:
- Treatment group mean: (8.2+7.5+9.1+8.8+7.9+9.4+8.6+8.0+9.2+8.3) / 10 = 8.5000
- Control group mean: (6.1+6.8+5.9+7.2+6.5+6.0+7.1+6.3+5.8+6.9) / 10 = 6.4600
- Treatment SD (n-1): sqrt(sum((x-8.5000)^2)/9) = 0.6236
- Control SD (n-1): sqrt(sum((x-6.4600)^2)/9) = 0.5147
- Mean difference: 8.5000 - 6.4600 = 2.0400
- Pooled SD: sqrt(((9)*0.6236^2 + (9)*0.5147^2)/18) = 0.5717
- Standard error: 0.5717 * sqrt(1/10 + 1/10) = 0.2557
- t statistic: 2.0400 / 0.2557 = 7.9784
- Degrees of freedom: 10 + 10 - 2 = 18
- p-value (two-tailed): 2 * (1 - T.cdf(|7.9784|, 18)) = 0.0000
- 95% CI lower: 2.0400 - 2.1009 * 0.2557 = 1.5028
- 95% CI upper: 2.0400 + 2.1009 * 0.2557 = 2.5772
- Cohen's d: 2.0400 / 0.5717 = 3.5680
from scipy import stats
treatment = [8.2, 7.5, 9.1, 8.8, 7.9, 9.4, 8.6, 8.0, 9.2, 8.3]
control = [6.1, 6.8, 5.9, 7.2, 6.5, 6.0, 7.1, 6.3, 5.8, 6.9]
t, p = stats.ttest_ind(treatment, control)

import numpy as np
diff = np.mean(treatment) - np.mean(control)
sp = np.sqrt((np.var(treatment, ddof=1) + np.var(control, ddof=1)) / 2)
se = sp * np.sqrt(1/10 + 1/10)
tcrit = stats.t.ppf(0.975, 18)
print(f"t = {t:.4f}, p = {p:.4f}, mean diff = {diff:.4f}, 95% CI = [{diff - tcrit*se:.4f}, {diff + tcrit*se:.4f}], Cohen's d = {diff/sp:.4f}")
Output:
t = 7.9784, p = 0.0000, mean diff = 2.0400, 95% CI = [1.5028, 2.5772], Cohen's d = 3.5680The treatment group averaged 8.50 and the control group averaged 6.46, a difference of 2.04 points. The t statistic of 7.9784 with 18 degrees of freedom gives a p-value of 0.0000. The 95% confidence interval runs from 1.5028 to 2.5772, so the true effect is estimated to be somewhere in that range. Cohen's d of 3.5680 indicates a very large standardized effect.
How to Interpret It
Read the mean difference first. It tells you the size of the effect in the units you measured. A 2.04-point gap on a 10-point recovery scale is meaningful in practical terms.
Then read the confidence interval. The interval [1.5028, 2.5772] excludes zero, which means the data are inconsistent with no effect. If the interval had included zero, you could not rule out chance as the explanation.
Then read the p-value. A p-value of 0.0000 means that if there were truly no difference between the groups, a gap this large would be extremely unlikely. It does not tell you the probability that the treatment works. It tells you how surprising the data are under the assumption of no effect.
Finally, read the effect size. Cohen's d of 3.5680 is far above the conventional threshold of 0.8 for a large effect. Effect size matters because statistical significance and practical importance are different things. A tiny difference can be significant with a large sample.
When to Use It (and when not to)
Use a control group whenever you want to attribute a change to a specific intervention. This covers clinical trials, educational studies, behavioral research, and any experiment where you can assign units to conditions. It is the standard design for testing whether a new method outperforms an existing one.
You also need a control group when you want to measure change over time. In the PAAD-2 study, participants in the control group were asked to maintain their current lifestyle while the experimental group began a walking and strength-training program [2]. Both groups were tested throughout. If the exercise group improved and the control group did not, the change is linked to the exercise protocol. If both groups declined by equal amounts, the change is more likely due to normal aging [2].
Do not use a control group when the intervention cannot be withheld ethically. You cannot assign people to a control condition that denies them a known effective treatment for a serious condition. In those cases, the control group receives the current standard of care instead of a placebo [1]. You also do not need a control group for purely descriptive research, where the goal is to characterize a population rather than test a cause.
Control Group vs Experimental Group
The experimental group receives the intervention. The control group does not, or receives a comparison condition. Everything else should be as similar as possible.
| Feature | Control group | Experimental group |
|---|---|---|
| Treatment | None, placebo, or standard care | The new intervention |
| Purpose | Baseline for comparison | Tests the effect of the intervention |
| Assignment | Random | Random |
| Measurement | Same outcome measures | Same outcome measures |
| Role in analysis | Reference mean | Treatment mean |
For a fuller breakdown of the treatment arm, see Experimental Group: Definition, Role vs Control Group & Examples. The two groups are defined by their relationship to each other, so understanding one requires understanding the other.
Common Mistakes
- No control group at all. Without a comparison, you cannot separate the treatment effect from time or outside factors. Fix: add a control condition that receives no treatment or standard care.
- Non-random assignment. If participants choose their group, the groups may differ before the study starts. Fix: use random assignment so the groups are balanced on average [2].
- Confusing statistical and practical significance. A p-value of 0.0000 does not mean the effect is large in real terms. Fix: report and interpret the effect size alongside the p-value.
- Ignoring baseline differences. Even with randomization, groups can differ by chance in small samples. Fix: check baseline characteristics and adjust if needed.
- Treating the control group as unimportant. The control group carries half the information in the comparison. Fix: measure the control group with the same care and the same instruments as the treatment group.
- Assuming a placebo control is always ethical. Withholding effective treatment can be unethical. Fix: use the current standard of care as the control when a proven treatment exists [1].
Limitations
A control group cannot fix a flawed design. If the outcome measure is unreliable, if participants drop out unevenly, or if the treatment and control groups differ in ways you did not measure, the comparison will mislead you. Randomization balances groups on average, but it does not guarantee balance in any single study, especially with small samples.
A control group also cannot tell you why an effect occurred. It shows that the treatment group differed from the control group. The mechanism behind that difference requires separate investigation. And a statistically significant difference does not guarantee the result generalizes beyond the population and conditions you studied.
Frequently Asked Questions
What is a control group in simple terms?
A control group is the group that does not get the treatment being tested. It serves as the baseline. By comparing the treatment group with the control group, you can see whether the treatment made a difference.
Why is a control group important in an experiment?
It rules out alternative explanations. Without it, you cannot tell whether an improvement came from the treatment or from time, natural recovery, or expectations. The control group shows what would have happened without the intervention.
What is the difference between a control group and a placebo group?
A placebo group is one type of control group. In a placebo-controlled trial, the control group receives an inactive treatment. But a control group can also receive the current standard treatment instead of a placebo, which is common when withholding effective care would be unethical [1].
Can a study have more than one control group?
Yes. A study can include multiple comparison arms, such as a placebo group and a standard-care group. This lets researchers compare the new treatment against more than one baseline. It increases sample size requirements but gives a richer picture.
Does a control group prove causation?
A control group strengthens causal inference but does not prove it by itself. Random assignment, a well-defined intervention, and control of confounders all contribute. Together they make a causal claim credible, but no single study design eliminates every alternative explanation.
For more on how control groups are selected and used across study types, see Understanding Control Groups in Clinical Trials: Types and Selection and Control Groups in Experiments: How to Choose and Use Them. If you are working in a health context, Understanding Control Groups in Clinical Research covers the clinical side in more detail.
References
Further Reading
- Krzywinski M, Altman N (2013). Importance of being uncertain. Nature Methods
- NIST/SEMATECH e-Handbook of Statistical Methods
- Ioannidis JPA (2005). Why Most Published Research Findings Are False. PLoS Medicine
- OpenStax. Introductory Statistics 2e