Accuracy, Precision and Recall: Differences and When to Use Each
By Dr. Zubair Khalid, DVM, MS, PhD ·
Accuracy, precision and recall are three ways to score a classifier, and they answer three different questions. Accuracy asks how many predictions were correct overall. Precision asks how many predicted positives were truly positive. Recall asks how many actual positives the model found. The metric you report should match the cost of the errors your problem cares about.
Quick Answer
- Accuracy = correct predictions / all predictions. It is easy to read but hides failures on rare classes.
- Precision = true positives / (true positives + false positives). It answers "when the model says yes, how often is it right?"
- Recall = true positives / (true positives + false negatives). It answers "of all the real positives, how many did the model catch?"
- Use accuracy when classes are roughly balanced and every error costs about the same [1].
- Use precision when false alarms are expensive, and recall when missing a positive is expensive [1].
What Accuracy, Precision and Recall Mean
In plain terms, accuracy is your overall hit rate, precision is your trustworthiness when you raise a flag, and recall is your coverage of the things you were supposed to find.
The precise definitions come from the confusion matrix, which counts four outcomes: true positives (TP), true negatives (TN), false positives (FP) and false negatives (FN). With $N = TP + TN + FP + FN$ as the total population, the foundational metrics are defined as follows [2]:
$$\text{Accuracy} = \frac{TP + TN}{N}$$
$$\text{Precision} = \frac{TP}{TP + FP}$$
$$\text{Recall} = \frac{TP}{TP + FN}$$
Accuracy is the overall proportion of correct predictions, which is the same as 1 minus the total error rate [2]. Precision considers all positive classifications, while recall considers all actual positives [1]. That single difference is the source of most confusion between the two.
How It Works
Each metric is a ratio, and the denominator tells you what the metric is measuring.
- Accuracy divides by $N$, the whole dataset. Every prediction counts once, correct or not.
- Precision divides by $TP + FP$, the total number of positive predictions the model made. It ignores true negatives entirely.
- Recall divides by $TP + FN$, the total number of actual positives in the data. It ignores true negatives as well, but from the other direction.
Because precision and recall share the numerator $TP$ but have different denominators, they move in opposite directions as you change the decision threshold. A precision-recall curve plots precision as a function of recall, and precision usually falls as recall rises [2]. When you need one number, the F1 score combines them as the harmonic mean [1]:
$$\text{F1} = 2 \cdot \frac{\text{precision} \cdot \text{recall}}{\text{precision} + \text{recall}} = \frac{2TP}{2TP + FP + FN}$$
When precision and recall are both 1.0, F1 is also 1.0. When they are close in value, F1 sits near that value. When they are far apart, F1 drops toward the smaller one [1].
Worked Example
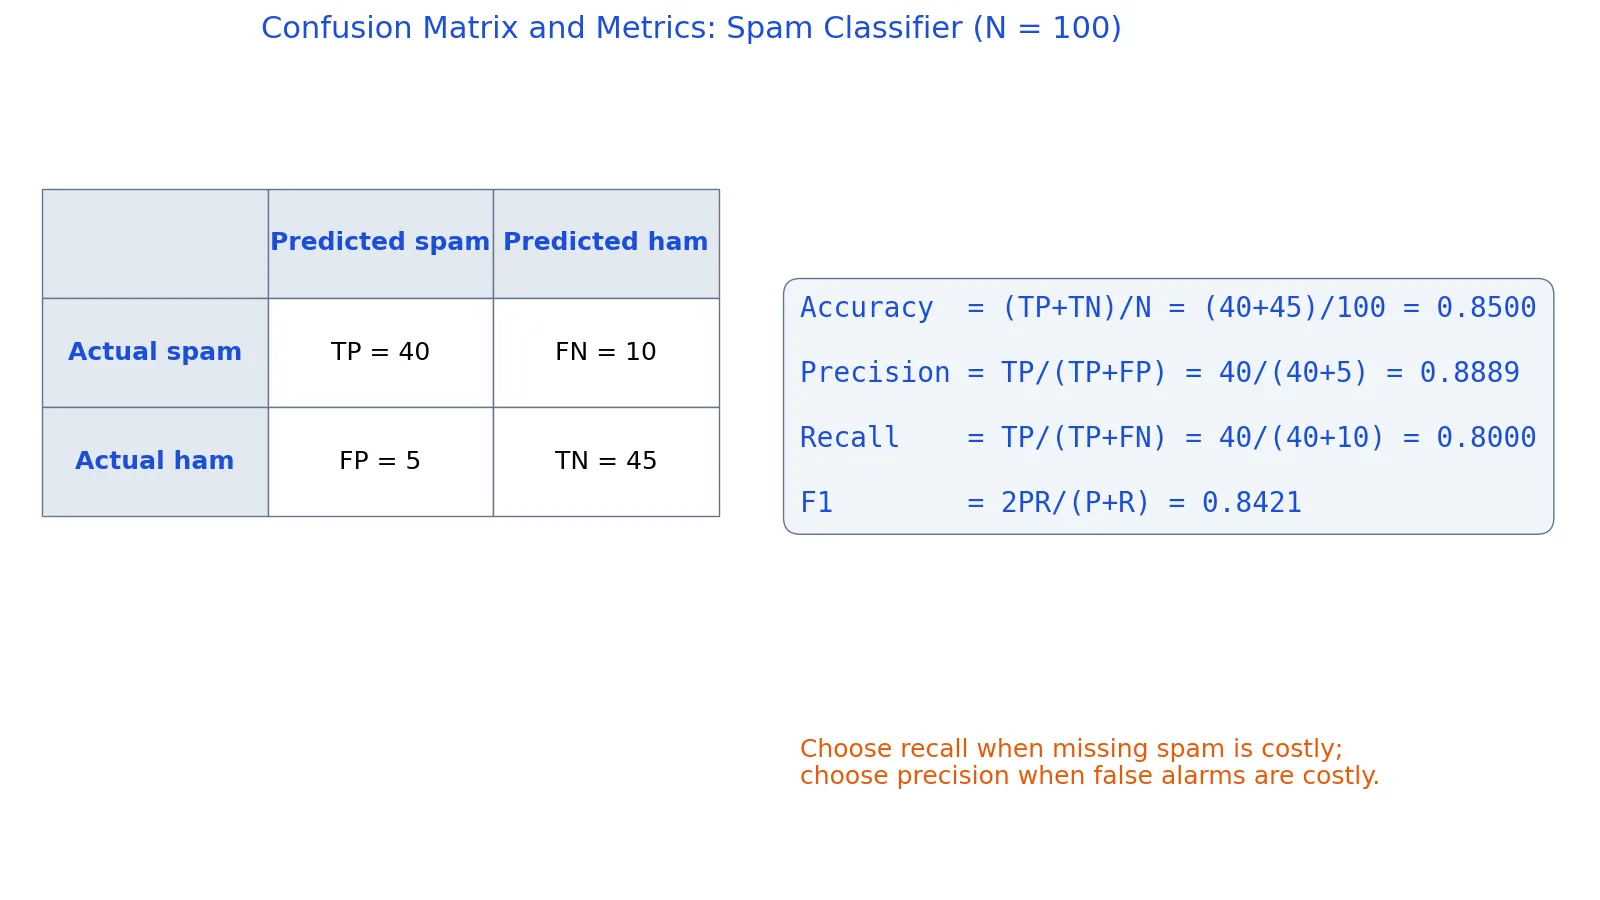
This confusion matrix comes from 100 test cases of a spam classifier, where "spam" is the positive class.
| actual | predicted | count |
|---|---|---|
| spam | spam | 40 |
| spam | ham | 10 |
| ham | spam | 5 |
| ham | ham | 45 |
Reading the matrix: TP = 40, FN = 10, FP = 5, TN = 45.
Step 1. Total test cases.
$$N = 40 + 10 + 5 + 45 = 100$$
Step 2. Accuracy.
$$\text{Accuracy} = \frac{40 + 45}{100} = 0.8500$$
Step 3. Precision.
$$\text{Precision} = \frac{40}{40 + 5} = 0.8889$$
Step 4. Recall.
$$\text{Recall} = \frac{40}{40 + 10} = 0.8000$$
Step 5. F1.
$$\text{F1} = \frac{2 \cdot 0.8889 \cdot 0.8000}{0.8889 + 0.8000} = 0.8421$$
The same numbers in Python:
from sklearn.metrics import accuracy_score, precision_score, recall_score
y_true = ['spam']*50 + ['ham']*50
y_pred = ['spam']*40 + ['ham']*10 + ['spam']*5 + ['ham']*45
accuracy_score(y_true, y_pred)   # 0.8500
precision_score(y_true, y_pred, pos_label='spam')  # 0.8889
recall_score(y_true, y_pred, pos_label='spam')     # 0.8000
Output:
accuracy=0.8500, precision=0.8889, recall=0.8000, f1=0.8421In a spreadsheet, with TP in B2, FN in B3, FP in C2 and TN in C3, the formulas are =(B2+C3)/(B2+B3+C2+C3) for accuracy, =B2/(B2+C2) for precision and =B2/(B2+B3) for recall. They return 0.8500, 0.8889 and 0.8000.
How to Interpret It
Read accuracy first as a baseline, then check precision and recall to see where the errors sit. In the example, accuracy of 0.8500 sounds decent, but it hides the shape of the failure. The model missed 10 of 50 spam emails, so recall is only 0.8000. It also flagged 5 legitimate emails as spam, so precision is 0.8889.
The gap between the three numbers tells you which way the model leans. Here precision exceeds recall, which means the classifier is slightly conservative about calling something spam. If you lower the threshold, recall rises and precision falls. If you raise it, the reverse happens.
Always compare these scores against a trivial baseline. A classifier that labels everything "ham" would score 0.5000 accuracy on this balanced set, and its precision would be undefined because it makes no positive predictions at all [1]. A metric only means something relative to what a naive rule would achieve.
When to Use It (and when not to)
Use accuracy when classes are balanced and the cost of a false positive roughly equals the cost of a false negative. It is also useful for tracking training progress on balanced datasets, but for model performance it works best alongside other metrics [1].
Use precision when a false positive is the expensive error. If a spam filter sends a real client email to the junk folder, that is a costly FP. Precision is the metric that punishes those.
Use recall when a false negative is the expensive error. Missing a fraudulent transaction or a diseased patient is an FN, and recall is the metric that punishes those.
Use F1 when you need a single balanced score and both error types matter [1].
Avoid accuracy on imbalanced datasets, where it can look high while the model ignores the minority class entirely [1]. If you want a single balanced number that still behaves like accuracy, balanced accuracy is the macro-average of recall per class, and it equals ordinary accuracy when the classes are balanced [3].
Accuracy vs Precision
The names sound similar, but they measure different denominators. Accuracy divides by every prediction. Precision divides only by the positive predictions.
| Aspect | Accuracy | Precision |
|---|---|---|
| Question answered | How many predictions were correct? | When the model says positive, how often is it right? |
| Formula | $(TP + TN) / N$ | $TP / (TP + FP)$ |
| Counts true negatives | Yes | No |
| Sensitive to class imbalance | Yes, badly | Less so, but blind to missed positives |
| Typical use | Balanced classes, equal error costs | False alarms are expensive |
A useful way to see the link is that accuracy is a weighted average of precision and its inverse, weighted by how often the model predicts positive [2]. Precision is one ingredient of accuracy, not a synonym for it. If you want the broader statistical distinction between accuracy and precision as measurement concepts, see accuracy vs precision.
Common Mistakes
- Reporting accuracy on an imbalanced dataset. With 1% positives, a model that always predicts negative scores 0.99 accuracy and finds nothing. Fix: report precision, recall or balanced accuracy instead [1].
- Treating precision and recall as interchangeable. They punish opposite errors. Fix: decide which error type costs more before you pick a metric.
- Optimizing one metric in isolation. Pushing recall to 1.0 usually drags precision down. Fix: track both, or use F1 when you need a single number [1].
- Computing precision when the model makes no positive predictions. The denominator $TP + FP$ is zero, so the result is undefined rather than zero [1]. Fix: report the undefined case explicitly.
- Forgetting to state the positive class. Precision and recall depend on which label you call positive. Fix: name it every time you report the numbers.
- Comparing scores across datasets with different class balance. Prevalence changes what a given precision means. Fix: compare on the same split, or report prevalence alongside the scores [2].
Limitations
These metrics summarize a single threshold. They say nothing about how the model behaves at other cutoffs, and a model with strong precision and recall at one threshold can collapse at another. The precision-recall curve exists precisely because one pair of numbers hides that trade-off [2].
Accuracy, precision and recall also ignore the magnitude of errors and the cost structure of your problem. They treat every mistake as equally weighted within their category, which is rarely true in practice. The metric you prioritize depends on the costs, benefits and risks of the specific problem, and no single number captures all three [1]. For a fuller picture, pair them with a confusion matrix, a precision-recall curve, or a cost-weighted analysis.
Frequently Asked Questions
What is the difference between accuracy precision and recall in one sentence?
Accuracy is the share of all predictions that were correct, precision is the share of positive predictions that were correct, and recall is the share of actual positives that the model found. They differ only in what goes in the denominator.
Can precision and recall both be high at the same time?
Yes, when the model separates the classes well. In the worked example, precision is 0.8889 and recall is 0.8000, which is reasonably close. When both reach 1.0, F1 also reaches 1.0 [1]. In practice you usually trade one against the other by moving the threshold.
Which metric should I use for an imbalanced dataset?
Precision, recall or F1, not accuracy. Accuracy is inflated on imbalanced data because the majority class dominates the count [1]. Balanced accuracy is another option, since it averages recall across classes and equals ordinary accuracy when the classes are balanced [3].
Is F1 always better than accuracy?
No. F1 is the harmonic mean of precision and recall and is useful when both error types matter and classes are imbalanced [1]. On balanced data where every error costs the same, accuracy is simpler and easier to explain.
How do I compute these metrics in scikit-learn?
Use accuracy_score, precision_score and recall_score from sklearn.metrics, and set pos_label to name your positive class. You can also pass several scorers at once to cross_validate, for example ['precision_macro', 'recall_macro'], to evaluate them across folds [4]. For per-class breakdowns, precision_recall_fscore_support returns precision, recall, F-measure and support together [3].
References
- Classification: Accuracy, recall, precision, and related metrics | Machine Learning | Google for Developers
- Precision and recall - Wikipedia
- 3.4. Metrics and scoring: quantifying the quality of predictions, scikit-learn 1.9.1 documentation
- 3.1. Cross-validation: evaluating estimator performance, scikit-learn 1.9.1 documentation
Further Reading
- Lever J, Krzywinski M, Altman N (2016). Classification evaluation. Nature Methods
- scikit-learn User Guide
- Wilson G, Bryan J, Cranston K et al. (2017). Good enough practices in scientific computing. PLOS Computational Biology
Related Articles
- Accuracy vs Precision: Differences and Examples
- Mean vs Median: Differences and When to Use Each
- Correlation vs Covariance: Differences and When to Use Each
- Measures of Variability: Range, Variance and Standard Deviation
- Nominal vs Ordinal Variables: Differences and Examples
- Precision and Recall in Variant Calling: How to Calculate and Interpret Performance Metrics
- Evaluating Variant Filtering Performance: Metrics and Methods to Assess Precision and Recall
- The Biology Student's Guide to Active Recall: 7 Techniques That Actually Work