# How to Create a Data Provenance Graph for Your Research Project
By the end of this article you will be able to draw a complete data provenance graph for one of your own experiments, express it in the W3C PROV standard using PROV-N syntax, generate the same graph programmatically in Python, render it as an image, and query it to answer questions such as "which raw files fed into this figure?" You will also get a reproducibility checklist and a list of mistakes that trip up first-time builders.
To follow the hands-on sections you need Python 3.8 or newer, pip, and the Graphviz graph-drawing software installed on your system. Everything else installs from a single pip command. No prior experience with provenance tools or graph databases is required.
## What a Data Provenance Graph Is
A data provenance graph is a machine-readable record of where your data came from and what happened to it. Each node represents a thing (a file, a measurement, a piece of software) or a process (a script run, a sequencing lane, a cleaning step). Each edge records how nodes relate, for example "this plot was generated by that script, which used that CSV file". Data provenance, in general, records the origin, transformation, ownership, and movement of data, and it underpins data quality, reproducibility, compliance, and trustworthiness in large analytics environments [1].
The dominant standard for expressing this structure is the W3C PROV data model. The W3C PROV standard provides textual and graphical syntaxes, including PROV-N, for expressing and storing provenance [2]. Because it is a published standard, a graph you write today can still be parsed, validated, and reused years later by collaborators or repositories. Provenance frameworks aligned with the W3C Provenance Ontology (PROV-O) support concrete scientific operations such as rerunning a workflow over the same or different source data, altered reruns, undo operations, and provenance retrieval [3].
### Entities, Activities, and Agents
The PROV data model rests on three node types and five main relationships.
| PROV element | Meaning | Life science example | PROV-N statement |
|--|--|--|--|
| Entity | A thing with fixed state | `sampleA.fastq.gz`, `counts.csv`, `figure1.png` | `entity(ex:counts_csv)` |
| Activity | A process with a start and end time | a FastQC run, an R session that builds a plot | `activity(ex:fastqc_run, 2026-03-02T09:15:00, ...)` |
| Agent | Something with responsibility | the researcher, a lab, a software tool | `agent(ex:jdoe, [prov:type='prov:Person'])` |
| Usage | An entity was consumed by an activity | the FASTQ file was read by FastQC | `used(ex:fastqc_run, ex:sampleA_fastq)` |
| Generation | An entity was produced by an activity | the HTML report was produced by FastQC | `wasGeneratedBy(ex:fastqc_report, ex:fastqc_run)` |
| Derivation | An entity traces back to another | the report derives from the FASTQ file | `wasDerivedFrom(ex:fastqc_report, ex:sampleA_fastq)` |
| Attribution | An entity is the responsibility of an agent | the report is Jane's output | `wasAttributedTo(ex:fastqc_report, ex:jdoe)` |
A graph built from these elements is deliberately simple. The complexity of real experiments comes from the number of nodes, not from exotic structures. That simplicity is why provenance graphs scale from a single pipette-and-plate experiment to system-wide records.
### Where You See Provenance Graphs in Life Science
Clinical imaging is a good example. One architecture for managing medical image datasets uses a graph-based provenance management strategy based on a standard provenance model, with a use case of automated image processing for identifying vascular lesions in the lower extremities, and the authors describe the provenance graph generated for that workflow [4]. The concept applies to arbitrary clinical data, not just images.
Toxicology gives another framing. New approach methodologies (NAMs) generate raw data that pass through multiple data layers on the way to a final hit definition, and because changes in any processing step can alter the final output, the processing pipeline is considered an essential part of the method description and should be included in reporting templates such as the ToxTemp [5]. A provenance graph is essentially that pipeline, recorded node by node.
The same graph structure also dominates outside biology. Computer security researchers build provenance graphs from system event logs to trace attacker behavior, and recent systems apply graph neural networks to those graphs at scale [6]. The structural idea is identical to the one you will build below.
## A Data Provenance Graph Example, Step by Step
This walkthrough uses a small, realistic life science scenario. Imagine you sequenced one sample, ran a quality-control tool on the raw reads, produced a count table with a pipeline, and made one figure. By the end of the walkthrough your graph will contain 6 nodes and 7 edges, and it will be stored in three forms: PROV-N text, a PNG image, and a JSON document.
### Step 1. List Your Artifacts and Processes
Before touching any tool, write down every artifact and process in chronological order. For the demo scenario:
1. `sampleA.fastq.gz`, raw sequencing reads (entity)
2. `fastqc_run`, a quality-control execution (activity)
3. `fastqc_report.html`, the QC report (entity)
4. `count_pipeline`, a script that computes gene counts (activity)
5. `counts.csv`, the count table (entity)
6. `figure1.png`, a plot of the counts (entity)
7. Jane Doe, the researcher (agent)
For each activity, note the tool name and version (for example, FastQC 0.12.1), the command you ran, and the start and end time. These become attributes on the activity node.
### Step 2. Install the Tools
Install the Python provenance library with the dot extra, which pulls in pydot for rendering:
```bash
python -m pip install "prov[dot]"
```
Then install the Graphviz engine itself, which pydot calls behind the scenes:
```bash
# on macOS with Homebrew
brew install graphviz
# on Ubuntu or Debian
sudo apt-get install graphviz
```
Verify the installation:
```bash
dot -V
```
Expected output resembles:
```
dot - graphviz version 12.2.1 (2024xxxx)
```
### Step 3. Write the Graph in PROV-N
PROV-N is the text syntax of the PROV standard, and graphical tools exist that convert drawn provenance models directly into PROV-N code [2]. Create a file called `provenance.provn` with this content:
```
document
prefix ex
prefix prov
agent(ex:jdoe, [prov:type='prov:Person',
foaf:name='Jane Doe'])
entity(ex:sampleA_fastq, [prov:label='sampleA.fastq.gz',
prov:type='prov:Entity'])
entity(ex:fastqc_report, [prov:label='fastqc_report.html',
prov:type='prov:Entity'])
entity(ex:counts_csv, [prov:label='counts.csv',
prov:type='prov:Entity'])
entity(ex:figure1, [prov:label='figure1.png',
prov:type='prov:Entity'])
activity(ex:fastqc_run, 2026-03-02T09:15:00, 2026-03-02T09:22:00,
[prov:type='ex:FastQC', ex:tool_version='0.12.1'])
activity(ex:count_pipeline, 2026-03-02T10:00:00, 2026-03-02T10:47:00,
[prov:type='ex:CountingPipeline', ex:tool_version='1.2.0'])
used(ex:fastqc_run, ex:sampleA_fastq, -,
[prov:role='ex:input_file'])
wasGeneratedBy(ex:fastqc_report, ex:fastqc_run, -)
used(ex:count_pipeline, ex:sampleA_fastq, -,
[prov:role='ex:input_reads'])
used(ex:count_pipeline, ex:fastqc_report, -,
[prov:role='ex:qc_input'])
wasGeneratedBy(ex:counts_csv, ex:count_pipeline, -)
wasDerivedFrom(ex:fastqc_report, ex:sampleA_fastq)
wasDerivedFrom(ex:counts_csv, ex:sampleA_fastq)
wasDerivedFrom(ex:figure1, ex:counts_csv)
wasAttributedTo(ex:counts_csv, ex:jdoe)
wasAttributedTo(ex:figure1, ex:jdoe)
endDocument
```
Every statement maps directly onto the table above. The dash (`-`) in `used` and `wasGeneratedBy` is a placeholder for an optional time value. The `prov:role` attribute distinguishes multiple inputs to the same activity, which matters when a pipeline consumes both reads and a QC report.
### Step 4. Build the Same Graph in Python
Manual files work, but for anything larger than a toy example you want the graph to be written by the same code that runs the analysis. Create `build_provenance.py`:
```python
from prov.model import ProvDocument
doc = ProvDocument()
doc.add_namespace("ex", "https://example.org/rnaseq/")
# Agent
jdoe = doc.agent("ex:jdoe",
{"prov:type": "prov:Person",
"foaf:name": "Jane Doe"})
# Entities
raw = doc.entity("ex:sampleA_fastq",
{"prov:label": "sampleA.fastq.gz"})
report = doc.entity("ex:fastqc_report",
{"prov:label": "fastqc_report.html"})
counts = doc.entity("ex:counts_csv",
{"prov:label": "counts.csv"})
figure = doc.entity("ex:figure1",
{"prov:label": "figure1.png"})
# Activities
qc = doc.activity("ex:fastqc_run",
startTime="2026-03-02T09:15:00",
endTime="2026-03-02T09:22:00",
other_attributes={"prov:type": "ex:FastQC",
"ex:tool_version": "0.12.1"})
pipeline = doc.activity("ex:count_pipeline",
startTime="2026-03-02T10:00:00",
endTime="2026-03-02T10:47:00",
other_attributes={"prov:type": "ex:CountingPipeline",
"ex:tool_version": "1.2.0"})
# Relationships
qc.used(raw, other_attributes={"prov:role": "ex:input_file"})
report.wasGeneratedBy(qc)
report.wasDerivedFrom(raw)
pipeline.used(raw, other_attributes={"prov:role": "ex:input_reads"})
pipeline.used(report, other_attributes={"prov:role": "ex:qc_input"})
counts.wasGeneratedBy(pipeline)
counts.wasDerivedFrom(raw)
figure.wasDerivedFrom(counts)
counts.wasAttributedTo(jdoe)
figure.wasAttributedTo(jdoe)
# Serialize
print(doc.get_provn())
with open("provenance.provn", "w") as f:
f.write(doc.get_provn())
with open("provenance.json", "w") as f:
f.write(doc.serialize(format="json"))
```
Run it:
```bash
python build_provenance.py
```
Expected output resembles:
```
document
default
prefix prov
agent(ex:jdoe, [prov:type='prov:Person', foaf:name='Jane Doe'])
entity(ex:sampleA_fastq, [prov:label='sampleA.fastq.gz', ...])
activity(ex:fastqc_run, 2026-03-02T09:15:00, 2026-03-02T09:22:00, [...])
used(ex:fastqc_run, ex:sampleA_fastq, -, [prov:role='ex:input_file'])
...
endDocument
```
The exact attribute order may differ between library versions. What matters is that every node and edge from Step 3 appears.
### Step 5. Render and Store the Graph
Add this block to the end of the script to produce a PNG:
```python
from prov.dot import prov_to_dot
dot = prov_to_dot(doc)
with open("provenance_graph.png", "wb") as f:
f.write(dot.create(format="png"))
```
Then run:
```bash
python build_provenance.py
```
Expected output: a new file `provenance_graph.png` in the working directory, with octagons for entities, rectangles for activities, and arrows labeled `used` and `wasGeneratedBy`. You now have the same provenance in three interchangeable formats: PROV-N text, JSON (the PROV-JSON representation), and a human-readable image.
Store all three next to the data itself. Versioning matters here. Modern provenance systems distinguish modifications of the same file using distinguishable versions, so a file edited twice appears as two versioned nodes rather than one ambiguous node. A practical habit is to embed a timestamp or hash in each entity identifier, for example `ex:counts_csv_v2026-03-02T1047`.
### Step 6. Query the Graph
Once the graph exists, you can ask it questions. For tiny graphs, reading the PROV-N file is enough. For larger ones, researchers routinely load provenance into property graph stores and query them with graph query languages such as Cypher. If you export your nodes to a graph database such as Neo4j, a lineage query looks like this:
```cypher
CREATE (raw:Entity {id: "sampleA.fastq.gz", kind: "fastq"}),
(qc:Activity {id: "fastqc_run", tool: "FastQC"}),
(raw)-[:USED_BY {role: "input"}]->(qc)
```
```cypher
MATCH (target:Entity {id: "figure1"})
MATCH path = (source:Entity)-[:USED_BY|GENERATED*]->(target)
RETURN source.id, target.id
```
The second query returns every ancestor of `figure1`, which is exactly the answer to "what inputs produced this figure?" Two high-level query operators exist for exactly this purpose in verbose provenance graphs: a graph segmentation operator, which retrieves the retrospective provenance between a set of source vertices and a set of destination vertices using flexible boundary criteria, and a graph summarization operator, which collapses similar segments to reduce verbosity. You will not need them for 6 nodes, but knowing they exist tells you how far the approach scales.
## Interpreting and Extending Your Graph
Three extensions turn a static graph into an active research tool.
**Provenance-aware reruns.** A provenance framework aligned with PROV-O can rerun the generation process over the same or different source data, supporting reproducibility, altered reruns, undo operations, and provenance retrieval [3]. Concretely, if your `counts.csv` node stores the tool version and command as attributes, you can regenerate it after a software update and compare the two versions.
**Weighted provenance for machine learning.** Program-dependence tracking treats every input as equally related to an output. For machine learning workflows that is misleading, since only some inputs matter. The LAMP system borrows automatic differentiation and computes the partial derivative of an output with respect to each input, quantifying input importance and producing more precise and succinct provenance than dependence-based techniques with low overhead [7]. If your project trains models on derived features, recording those weights alongside the derivation edges makes the graph far more diagnostic.
**Summarization for large graphs.** Real project graphs grow quickly because of multiple file versions, unfamiliar artifacts introduced by collaborators, and schema-later metadata. Segmentation and summarization operators were designed to address exactly this verboseness in evolving provenance graphs.
## Scaling From Demo to Real Project
The 6-node demo generalizes along three axes.
**Automation.** Hand-drawn graphs go stale. A prototype built for Trusted Research Environments applied a participatory design process with data analysts, researchers, and governance teams, then developed automated scripts to collect provenance information for the data processing workflow using the PROV-O ontology. The resulting tool, PE-TRE, displays linkage information from a knowledge graph together with rule-based validation checks, and user evaluations confirmed it would contribute to better quality data linkage and fewer processing errors [8]. The lesson is that provenance collection should be triggered by the workflow itself, not by memory.
**High-throughput pipelines.** In preclinical addiction research, a consortium phenotyped over 3,000 rats for oxycodone and cocaine addiction-like behaviors, producing over 100,000 data files. The team handled this with automated scripts that converted raw instrument output into structured files, integration with standardized metadata spreadsheets, and a cloud relational database, enabling automated quality control, backups, and daily summaries [9]. A provenance graph fits naturally on top of such a pipeline: each automated conversion is an activity node, each raw and structured file is an entity, and the daily quality-control checks become validation activities.
**Databases with provenance built in.** The Swiss HIV [Cohort Study](/blog/guides/cohort-studies-a-practical-guide-to-design-conduct-and-interpretation) built a viral next-generation sequencing database nested within its cohort studies, which have enrolled 21,876 people with HIV since 1988. The database explicitly addresses raw and processed data loads, downstream bioinformatic tools, high-performance computing, and reproducibility [10]. For longitudinal cohort work, the provenance graph effectively becomes a queryable index over years of processed data.
You do not need to write code at all if your bottleneck is data handling rather than analysis. Tools such as MedicalDataHandler, a research-oriented graphical interface for DICOM data, consolidate reading, visualization, and processing into one environment and promote reproducible data handling without custom scripting [11]. The provenance principle is the same even when the interface is graphical rather than programmatic.
## Reproducibility Checklist
Use this reproducibility checklist before you submit a manuscript or archive a dataset. Items 1 through 4 are the graph itself. Items 5 through 8 are the habits that keep it honest.
1. Every final output (figure, table, model) appears as an entity node.
2. Every entity traces back to at least one raw-data entity through `wasDerivedFrom` edges.
3. Every activity node carries the tool name, tool version, and execution timestamps as attributes.
4. Every derived entity is attributed to at least one agent.
5. The processing pipeline between each data layer is documented, since changes in any processing step can alter the final output and affect robustness and regulatory readiness [5].
6. Organization, documentation, storage, and sharing practices are written down, because accurate documentation of procedures and analysis methods is what allows independent validation [12].
7. A colleague can rerun the generation process for at least one output using only the graph and the stored files, the rerun test that provenance frameworks are designed to support [3].
8. The graph and its files are deposited in a citable repository together.
## Data Provenance Graph Example Tips
These field-tested tips follow directly from the step-by-step example above.
- **Record versions at capture time.** Tool versions are cheap to record in the activity attributes and nearly impossible to reconstruct later. Write them into the graph in the same script that runs the tool.
- **Give every entity a versioned identifier.** Provenance graphs get verbose when the same file appears under multiple versions, and distinguishable versions are how modern platforms handle file modification. `counts.csv` from March and `counts.csv` from June should be two nodes.
- **Use roles when an activity has several inputs.** The `prov:role` attribute is what lets you later tell the reads input apart from the QC-report input in a pipeline run.
- **Automate early.** Semi-automated provenance collection triggered by the workflow itself outperforms retrospective reconstruction, and user evaluations in the Trusted Research Environment study supported that automation reduces data processing errors [8].
- **Keep the human-readable image with the machine-readable graph.** Reviewers and collaborators read the picture. Validation scripts read the PROV-N or JSON. Publish both.
- **Plan the boundary of the graph.** Decide what counts as a raw entity before you start. In imaging projects, the boundary is often the DICOM file exported by the scanner, and downstream handling stages build the graph from there [11].
## Common Mistakes and Limitations
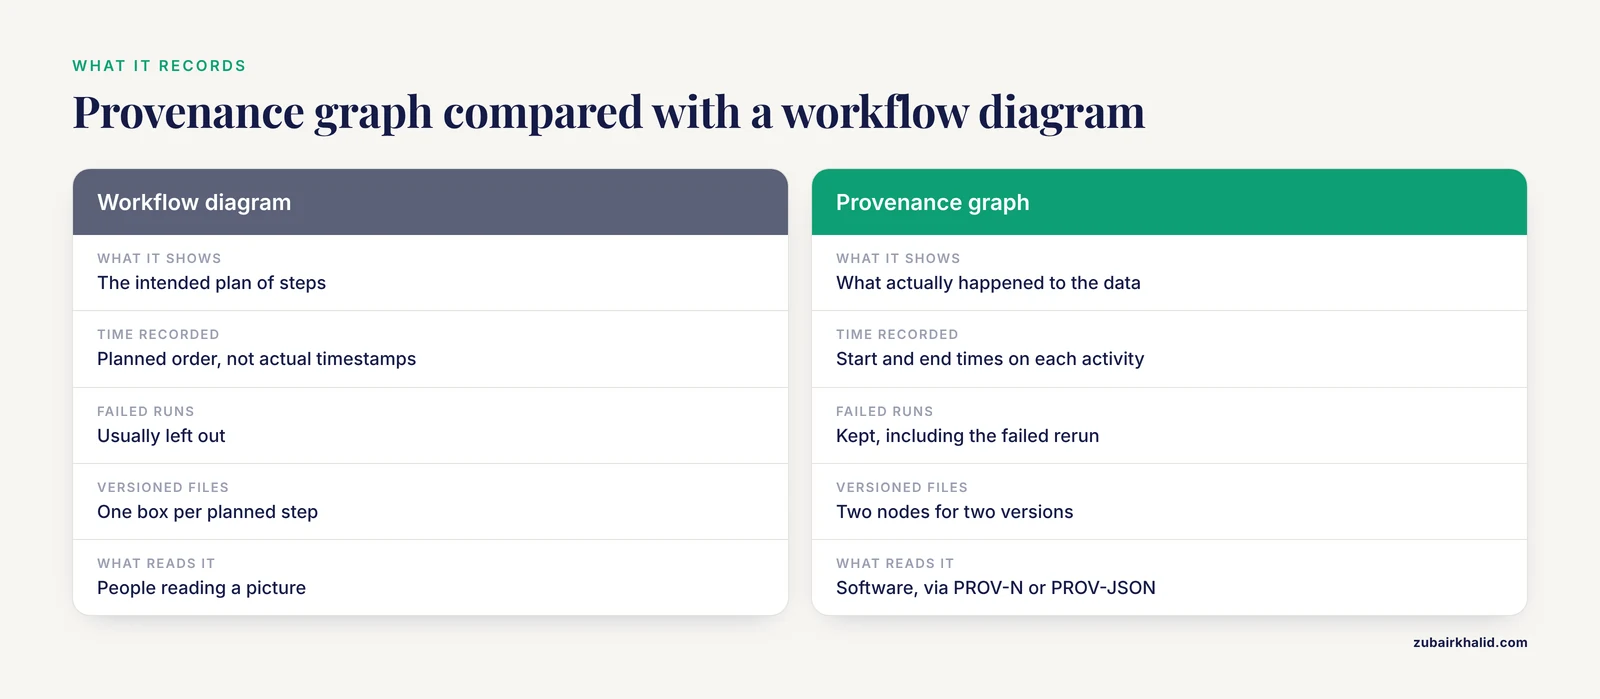
- **Confusing a provenance graph with a workflow diagram.** A workflow diagram shows the intended plan. A provenance graph records what actually happened, including the rerun at 2 a.m. that failed and the corrected rerun that followed. If your graph has no failed activities, you are probably drawing the plan, not the history.
- **Recording only final entities.** The single most common mistake is logging outputs without `used` edges back to inputs. Without usage edges, the graph cannot answer lineage questions, and query operators that recover derivation relationships between source and destination vertices have nothing to traverse.
- **Free-text provenance instead of a standard model.** Notes in a [lab notebook](/knowledge/molecular-biology/lab-notebook) are valuable but not parseable. Graph-based provenance built on a standard model was specifically proposed to overcome the limitations of systems with limited provenance support and poor extensibility. Use PROV-O or PROV-N so software can read your history.
- **Letting version information disappear.** When file versions are not distinguished, derivation relationships become ambiguous and queries return misleading answers. Handle modifications to the same file with distinguishable versions from the start.
- **Assuming equal importance of all inputs.** Dependence-based provenance cannot quantitatively assess how much each input mattered. For machine learning results, importance weighting through derivative computation is the more informative provenance [7].
- **Underestimating graph growth.** Provenance graphs become verbose and evolve as collaborators add unfamiliar artifacts, which is why summarization and segmentation operators exist. Budget for them before the graph exceeds a few hundred nodes.
- **Treating the graph as a substitute for [data management](/blog/guides/data-management-basics-principles-processes-and-best-practices).** The graph is one layer. Comprehensive data management, including organization, storage, sharing, and preservation, is what makes the underlying files durable enough for the graph to point at [12].
- **A limitation to state plainly.** A provenance graph records computational and data history. It does not certify scientific validity, and a graph is only as complete as the collection hooks you installed. Individual projects with unusual instruments, restricted clinical data, or legacy formats may need custom collection steps before the graph is trustworthy.
## Frequently Asked Questions
### What is a data provenance graph in simple terms?
It is a map of your data's history, drawn as nodes for files, processes, and people, and arrows showing how each output came from its inputs. The W3C PROV standard gives it a formal, machine-readable structure [2].
### Do I need the W3C PROV standard or can I use any diagram?
Use PROV if you want your history to be readable by software and by other researchers. A hand-drawn diagram is fine for thinking, but only a standard model supports automated reruns, undo operations, and provenance retrieval [3].
### What tools do I need to create a provenance graph?
Python with the `prov` library plus Graphviz is enough for a complete working example, as shown in the walkthrough above. Graphical modeling tools that generate PROV-N from drawn models also exist [2].
### How detailed should my provenance graph be?
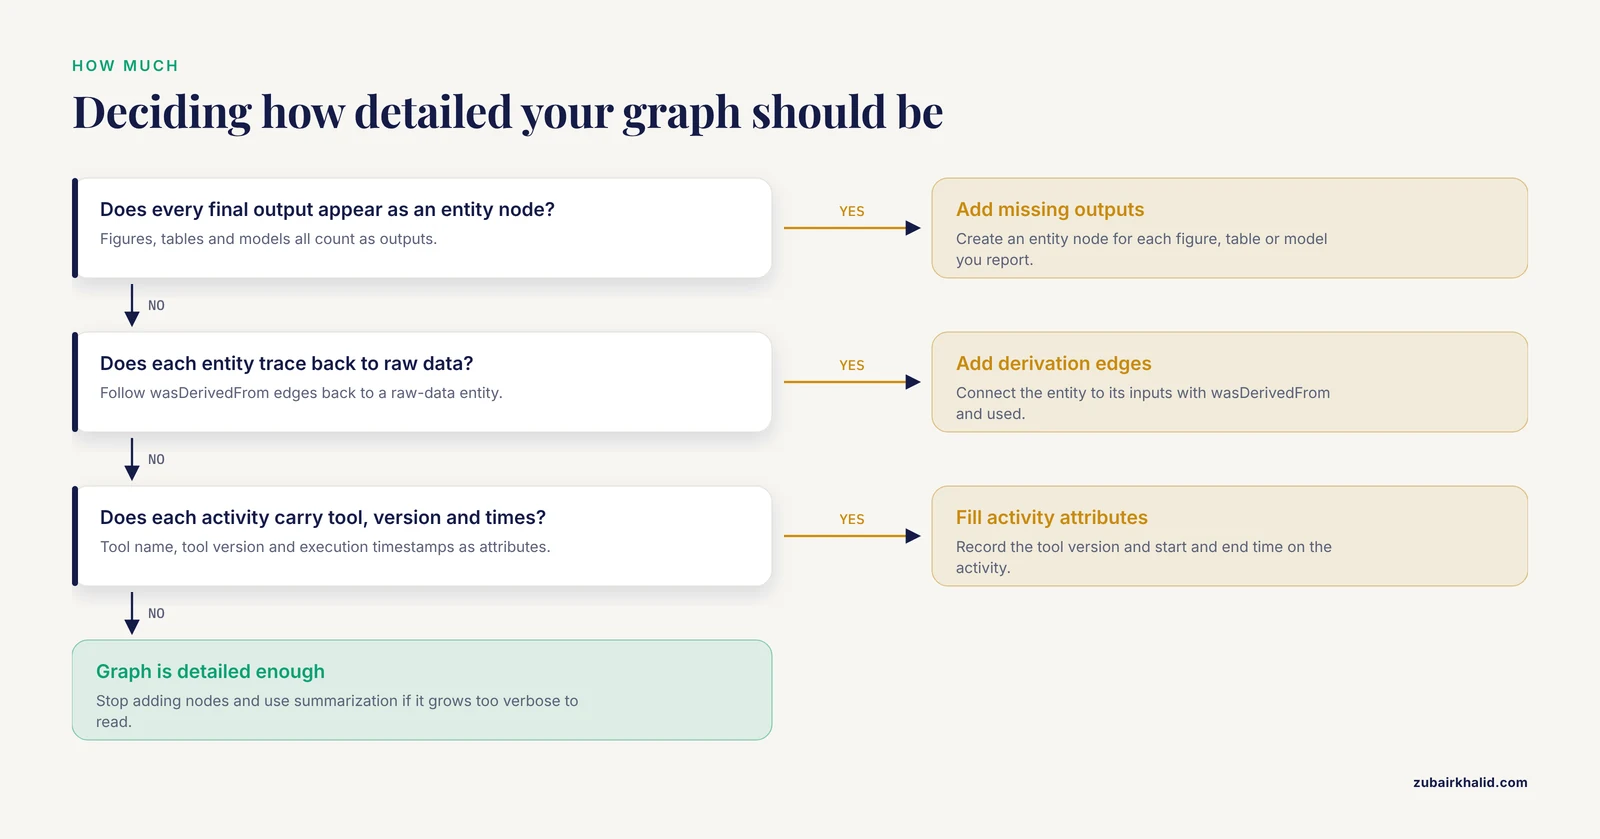
Detailed enough that every figure or table traces to raw data through explicit derivation edges, and every activity records tool name, version, and timestamps. Beyond that, use summarization if the graph becomes too verbose to read.
### Can a provenance graph help if my results change unexpectedly?
Yes. Because the graph records the exact chain from raw data to output, you can locate which processing step changed. Formal work on provenance shows that reconstructing causal relationships between inputs and decisions is a reliable diagnostic strategy.
### How do I keep a provenance graph up to date?
Automate it. Scripts that collect provenance as part of the workflow, rather than after the fact, were shown in a Trusted Research Environment study to improve linkage quality and reduce processing errors [8].
### Is a provenance graph useful for papers and data sharing?
Yes. Depositing a machine-readable provenance file alongside your data lets reviewers and readers see exactly how each result was produced, which supports the transparency and reproducibility goals of open science [3].
### What is the difference between a provenance graph and a knowledge graph?
A provenance graph records process history, meaning what happened to the data. A knowledge graph records factual domain knowledge, and provenance management within knowledge graph platforms is itself an active research area that supports reproducibility and updatability of the knowledge graph [3].
## Sources
1. [Intelligent Data Provenance Tracking for Large-Scale Analytics Platforms](https://doi.org/10.67228/30713498/ijadsmc-2024pi8d1z)
2. [Best of the Rest: MDE-Based Graphical Tool for Modeling Data Provenance According to the W3C PROV Standard](https://doi.org/10.1145/3736229.3736258)
3. [Managing Provenance Data in Knowledge Graph Management Platforms](https://doi.org/10.1007/s13222-023-00463-0)
4. [Managing Provenance for Medical Datasets - An Example Case for Documenting the Workflow for Image Processing](https://doi.org/10.5220/0006109402360243)
5. [The long way from raw data to NAM-based information: Overview on data layers and processing steps.](https://pubmed.ncbi.nlm.nih.gov/39817434/)
6. [Flash: A Comprehensive Approach to Intrusion Detection via Provenance Graph Representation Learning](https://doi.org/10.1109/SP54263.2024.00139)
7. [LAMP: data provenance for graph based machine learning algorithms through derivative computation](https://doi.org/10.1145/3106237.3106291)
8. [Semi-automated data provenance tracking for transparent data production and linkage to enhance auditing and quality assurance in Trusted Research Environments](https://pubmed.ncbi.nlm.nih.gov/40134562/)
9. [Automated pipeline for operant behavior phenotyping for high-throughput data management, processing, and visualization.](https://pubmed.ncbi.nlm.nih.gov/41360967/)
10. [Addressing data management and analysis challenges in viral genomics: The Swiss HIV cohort study viral next generation sequencing database.](https://pubmed.ncbi.nlm.nih.gov/40257980/)
11. [MedicalDataHandler, a research-oriented graphical user interface for DICOM data management.](https://pubmed.ncbi.nlm.nih.gov/41474038/)
12. [Best practices for data management and sharing in experimental biomedical research.](https://pubmed.ncbi.nlm.nih.gov/38451234/)