Frank-Starling Equation: Stroke Volume Explained
By Dr. Zubair Khalid, DVM, MS, PhD ·
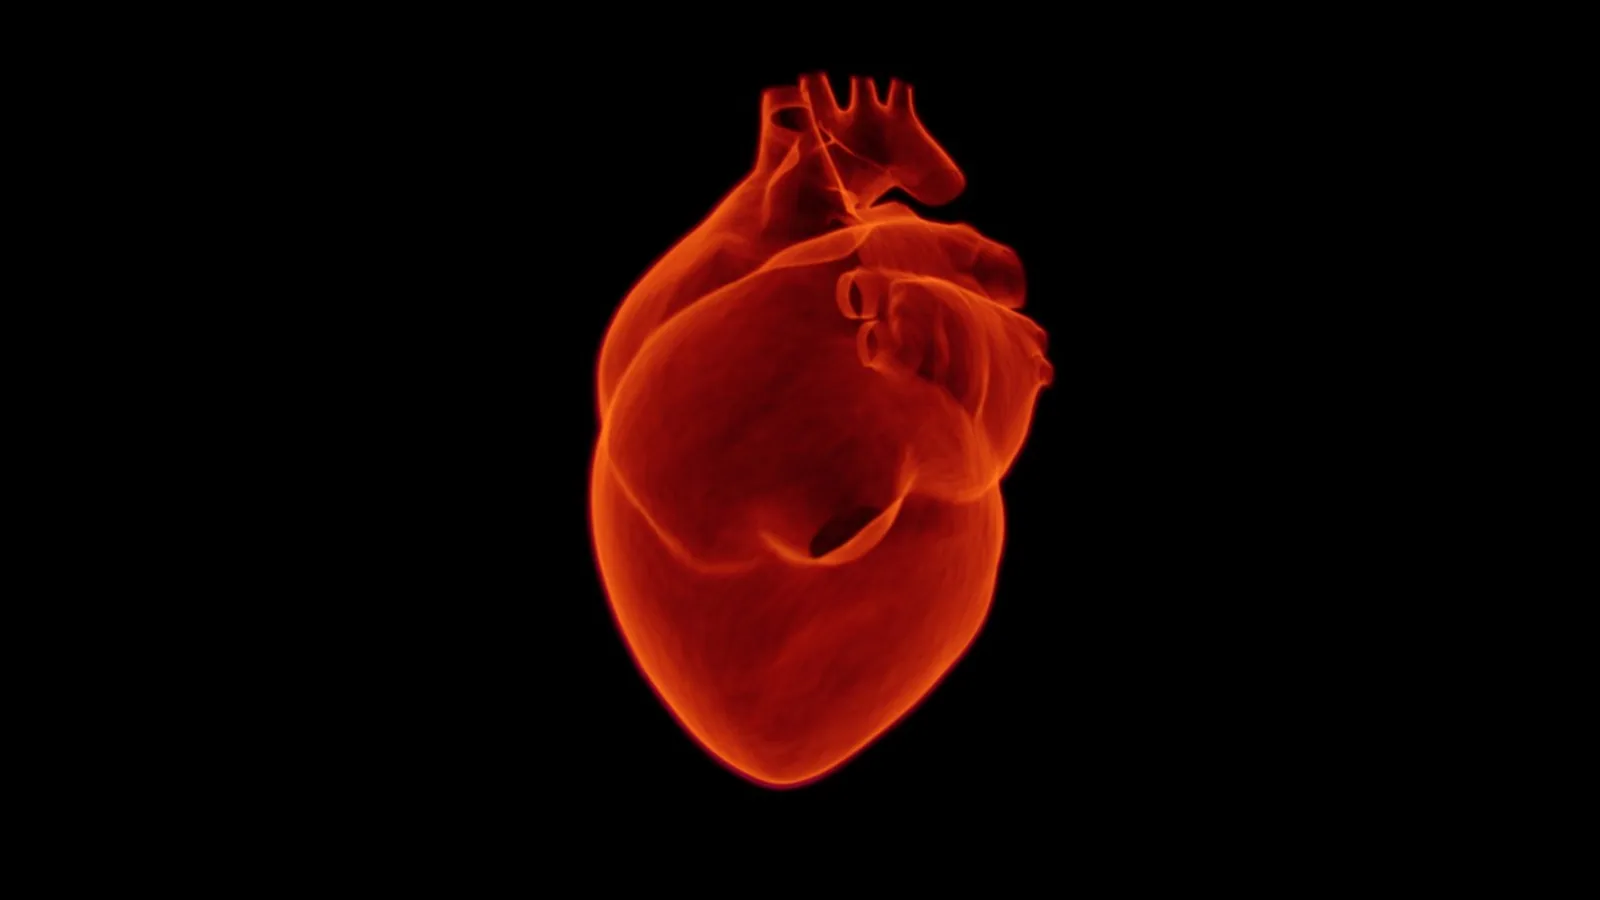
The Frank-Starling equation states that stroke volume equals end-diastolic volume minus end-systolic volume, so the volume of blood a ventricle ejects per beat is the difference between how full it was before contraction and how much blood remains after contraction. Ejection fraction is stroke volume divided by end-diastolic volume, expressed as a percent, and gives the fraction of the filled ventricle that was actually ejected.
This relationship matters because it explains how the heart of a dog, cat, horse, or cow matches its output to the blood returning to it beat by beat without waiting for a nerve signal or a hormone. When more blood fills the ventricle, the muscle stretches, contracts more forcefully, and ejects more. When less blood returns, the ventricle ejects less. That automatic matching is the Frank-Starling mechanism, and it is the foundation for interpreting every volume measurement you will ever read on an echocardiogram report.
This article is educational and is not a substitute for veterinary diagnosis or treatment.
The Core Formulas and What Each Variable Means
Two equations organize almost all clinical reasoning about ventricular pumping.
Stroke volume (SV) = end-diastolic volume (EDV) minus end-systolic volume (ESV)
- Stroke volume (SV) is the volume of blood ejected by one ventricle in one beat. Units: milliliters (mL) per beat.
- End-diastolic volume (EDV) is the volume of blood in the ventricle at the end of filling, immediately before contraction begins. Units: mL.
- End-systolic volume (ESV) is the volume of blood remaining in the ventricle at the end of contraction, after ejection stops. Units: mL.
Ejection fraction (EF) = stroke volume (SV) divided by end-diastolic volume (EDV), multiplied by 100
- Ejection fraction (EF) is the percentage of the end-diastolic volume that is ejected in one beat. Units: percent (%).
Because SV is itself EDV minus ESV, ejection fraction can also be written as (EDV minus ESV) divided by EDV. Both forms are algebraically identical, and both appear in clinical literature. A ventricle that fills to 80 mL and ejects 40 mL has an ejection fraction of 40 divided by 80, which is 0.50, or 50 percent.
Ejection fraction is a ratio, so it is dimensionless apart from the percent sign. That property makes it useful for comparing hearts of very different sizes. A 4 kg cat and a 40 kg dog have wildly different absolute stroke volumes, but a normal ejection fraction sits in a similar range for both.
Summary Table: Variables, Symbols, Units, and Typical Normal Ranges
| Variable | Symbol | Units | Typical normal range (adult dogs, resting) | Notes |
|---|---|---|---|---|
| End-diastolic volume | EDV | mL | Roughly 1.5 to 2.5 mL/kg body weight | Scales with body size, higher in trained athletes |
| End-systolic volume | ESV | mL | Roughly 0.5 to 1.0 mL/kg body weight | Falls when contractility rises |
| Stroke volume | SV | mL per beat | Roughly 1.0 to 1.5 mL/kg body weight | EDV minus ESV |
| Ejection fraction | EF | percent | Roughly 50 to 65 percent | SV divided by EDV, times 100 |
| Cardiac output | CO | mL per minute | Roughly 100 to 200 mL/kg per minute | SV multiplied by heart rate |
| End-diastolic pressure | LVEDP | mmHg | Commonly under about 12 mmHg at rest | Used as a surrogate for preload when volume is hard to measure |
The ranges above are standard textbook values for resting, awake animals and are given as orientation rather than as diagnostic cutoffs. Body size, species, sedation, heart rate, and the measurement method all shift them. A greyhound at rest and a sedated bulldog are not the same physiological preparation.
Why the Frank-Starling Mechanism Exists
The Frank-Starling mechanism, sometimes called the Frank-Starling law of the heart, is a filling-force relationship. Otto Frank observed that a ventricle held at a fixed volume generates more pressure when it is filled more. Ernest Starling later showed that the intact heart ejects more blood when it is filled more. Both observations describe the same underlying property of cardiac muscle, and modern modeling work treats the muscle as a force generator whose force depends on both time and length, with the ventricle acting as a pressure generator whose pressure depends on time and volume [1].
The cellular basis is the overlap between actin and myosin filaments inside the sarcomere. At low filling volumes, the filaments overlap poorly and fewer cross-bridges can form. As the ventricle fills and the muscle fibers stretch, the filaments slide into a more favorable overlap, calcium sensitivity of the contractile proteins increases, and each contraction generates more force. The result is a steeper, stronger contraction that ejects a larger fraction of a larger volume.
This mechanism is not unique to mammals. A positive relationship between the distension of a ventricular chamber and its force of ejection has been documented across all vertebrate lineages studied, which is a strong hint that it was selected early and retained [2]. The same study argued that the mechanism is not strictly required to stabilize an operating point in a mathematical model of the circulation, and proposed that its real roles include reducing the demand on central nervous control of the heart and smoothing short-term flow variation [2]. In practical terms, the mechanism lets the heart behave as a self-regulating pump that responds to filling before any reflex has time to act.
Reading the Frank-Starling Curve
Plot stroke volume on the vertical axis against end-diastolic volume or end-diastolic pressure on the horizontal axis and you get the Frank-Starling curve. Three features of that curve carry most of the clinical information.
The ascending limb
Over the low-to-moderate range of filling, stroke volume rises as end-diastolic volume rises. This is the working range of a normal heart at rest and during mild exercise. A study of left atrial contractile performance in people with ischemic heart disease found a positive, statistically significant relationship between the preload of the atrium and the volume it expelled, with a correlation coefficient of 0.80 [3]. That is the same shape of relationship you see at the ventricular level, just measured in a different chamber.
The plateau
At higher filling volumes, the curve flattens. Adding more volume produces little or no additional stroke volume. The sarcomere has reached the length at which further stretch no longer improves filament overlap, and the ventricle is already ejecting nearly everything it can. Clinically, this is the point at which more intravenous fluid stops helping and starts raising filling pressures that back up into the lungs or the systemic veins.
The descending limb
In the intact heart, a true descending limb is uncommon and usually reflects acute overdistension, ischemia, or a pericardial constraint rather than normal physiology. Most clinical curves are described as ascending with a plateau, and the plateau is the practical ceiling.
How the curve is quantified
The slope of the stroke volume versus end-diastolic volume relationship has a symbol, gamma, in the physiology literature. A first-order difference equation model of the beat-to-beat stroke volume response showed that the value of gamma determines what happens after a volume perturbation: a nonoscillatory decay when gamma is less than 1, an oscillatory decay when gamma is between 1 and 2, sustained mechanical alternans when gamma equals 2, and a chaotic response when gamma exceeds 2 [4]. In an experimental study in dogs, the slope of the stroke volume versus end-diastolic volume curve was measured directly by preventing filling in a beat after a steady state, and the value obtained was 0.892 plus or minus 0.078, which agreed with values already reported in the literature [5]. A slope below 1 means the system damps disturbances rather than amplifying them, which is the normal operating condition.
A Worked Example, Step by Step
Take a ventricle with an end-diastolic volume of 80 mL and an end-systolic volume of 40 mL.
- Write the formula. SV = EDV minus ESV.
- Substitute the numbers. SV = 80 mL minus 40 mL.
- Solve. SV = 40 mL per beat.
- Write the ejection fraction formula. EF = (SV divided by EDV) times 100.
- Substitute. EF = (40 mL divided by 80 mL) times 100.
- Solve. EF = 50 percent.
Interpretation: this ventricle filled to 80 mL, ejected half of what it held, and left 40 mL behind. If the same ventricle filled to 100 mL and contractility stayed the same, the Frank-Starling mechanism would predict a larger stroke volume, perhaps 50 mL, and the ejection fraction would be 50 percent again because both the numerator and denominator grew. If filling dropped to 60 mL, stroke volume would fall toward 30 mL. Notice that ejection fraction can stay constant while absolute stroke volume changes a great deal. That is why ejection fraction alone does not tell you whether cardiac output is adequate. You need stroke volume and heart rate.
Now change one variable to see the effect of contractility. Suppose the ventricle still fills to 80 mL but contractility improves so that end-systolic volume falls to 30 mL. Stroke volume becomes 50 mL and ejection fraction becomes 62.5 percent. Contractility changes move end-systolic volume. Filling changes move end-diastolic volume. Both change stroke volume, but they do so through different mechanisms, and that distinction is the single most useful idea in this topic.
Preload, Afterload, and Contractility in One Framework
Three determinants set stroke volume, and the Frank-Starling relationship is the one that links filling to ejection.
Preload is the load on the ventricular muscle at the end of diastole, before contraction begins. It is best represented by end-diastolic volume or by end-diastolic wall stress, and end-diastolic pressure is often used as a practical surrogate. Preload is the input to the Frank-Starling curve.
Afterload is the load the ventricle must overcome to eject. It is related to aortic or pulmonary arterial pressure and to vascular resistance. Rising afterload reduces stroke volume for any given preload, and it also tends to increase end-systolic volume.
Contractility is the intrinsic inotropic state of the muscle, independent of loading. It shifts the entire curve up or down.
The distinction between preload and afterload is not academic. A study of hemodynamic interventions in people found that angiotensin raised blood pressure and shifted the diastolic pressure-volume curve upward, while nitroprusside lowered blood pressure and shifted the curve downward [6]. The authors concluded that these shifts were not explained by acute changes in the elasticity of the myocardium itself, and that indirect changes in external mechanical constraints such as right ventricular pressure, the pericardium, and viscoelastic effects related to filling rate were likely responsible [6]. The practical warning from that work is direct: you cannot in general substitute end-diastolic pressure for end-diastolic fiber length when you interpret systolic events through the Frank-Starling mechanism, because the pressure-volume relationship itself moves with the hemodynamic state [6].
How the Mechanism Is Observed in Practice
Volume loading
Infusing isotonic saline in healthy volunteers increases end-diastolic volume and decreases end-systolic volume, which is exactly the pattern the Frank-Starling mechanism predicts [7]. In the same study, patients with hypertrophic cardiomyopathy did not show the same increase in end-diastolic volume or decrease in end-systolic volume during saline infusion, and their pressure-volume loops revealed different mechanical behavior, with controls but not patients showing decreased arterial elastance and potential energy during load manipulation [7]. The lesson is that the curve is not equally responsive in every heart.
Passive leg raising
Passive leg raising is a bedside maneuver that transiently increases venous return. In a study of normotensive, hypotensive, and hypertensive individuals, end-diastolic volume, stroke volume, cardiac output, ejection fraction, and fractional shortening all increased significantly after passive leg raising only in the hypotensive group [8]. Baseline echocardiographic filling variables and systolic blood pressure predicted which individuals would increase stroke volume by more than 15 percent during the maneuver [8]. This is a clean demonstration that the same preload challenge produces different stroke volume responses depending on where a subject sits on the curve.
Regional wall mechanics
The Frank-Starling mechanism also operates region by region within the ventricular wall. In anesthetized dogs, regional work per stroke increased as end-diastolic regional area increased during volume loading, methoxamine administration, and aortic constriction, which the authors described as the regional Frank-Starling mechanism [9]. When ischemia developed, the tension-area loop for the ischemic region shifted to the right and the work done by that region decreased, and after a certain stage the work became negative [9]. A ventricle can therefore be globally on the ascending limb while one segment is failing locally.
Beat-to-beat variability
In atrial fibrillation, ventricular performance depends heavily on the interval-force relationship, which is governed by the ratio of the preceding to the pre-preceding RR interval. A study in open-chest dogs with induced atrial fibrillation found that the residuals of the relationship between ventricular performance and that RR ratio correlated linearly with end-diastolic volume, with correlation coefficients of 0.20 plus or minus 0.14 for maximal left ventricular power and 0.24 plus or minus 0.17 for peak dP/dt [10]. The authors concluded that the Frank-Starling mechanism contributes modestly but measurably to ventricular performance during atrial fibrillation [10]. Translation for clinical work: in an irregular rhythm, part of the beat-to-beat variation in pulse strength is filling dependent and part is interval dependent.
Atrial contribution
The atrium follows its own Frank-Starling relationship. In people with ischemic heart disease, the contribution of left atrial contraction to left ventricular stroke volume correlated inversely with left ventricular ejection fraction, following the equation Y = -0.31X + 43.7, with a correlation coefficient of -0.56 [3]. In plain language, as ventricular function worsened, the atrium worked harder to compensate. The same study found that the stroke volume of the atrium correlated positively with its preload, following Y = 0.48X - 1.3, with a correlation coefficient of 0.80 [3]. This is why atrial contraction matters so much in patients with poor ventricular function, and why losing that contribution, for example with atrial fibrillation, can precipitate decompensation.
Clinical Relevance, Limitations and Common Mistakes
Heart failure depresses and shifts the curve
In systolic heart failure, the Frank-Starling curve is depressed and shifted to the right. Depressed means that for any given end-diastolic volume, the ventricle generates less stroke volume. Shifted to the right means that a higher filling volume is required to achieve any given stroke volume. The ventricle is operating on a flatter, lower curve, so it needs more preload to do the same work, and it tolerates volume overload poorly because the extra volume mostly raises filling pressure rather than output.
Ejection fraction recovery after relief of chronic pressure overload illustrates how reversible this can be. In a study of 121 patients with severe native-valve aortic stenosis and a baseline left ventricular ejection fraction below 50 percent who underwent transcatheter aortic valve implantation, ejection fraction improved significantly through one year, with a model-estimated increase of 12.3 percentage points, and left ventricular end-diastolic diameter, end-systolic diameter, and mass index all decreased [11]. Ischemic heart disease, baseline ejection fraction, baseline end-diastolic diameter, and baseline mean aortic valve pressure gradient were associated with the degree of recovery, and recovery was most limited in patients with ischemic heart disease and larger end-diastolic diameter [11]. Removing an afterload burden can move a heart back up its curve, but the starting point and the presence of ischemic disease set the ceiling.
Elevated filling pressure without a low ejection fraction
Heart failure with preserved ejection fraction is the situation in which ejection fraction looks acceptable but filling pressures are elevated. In a study of 253 women with signs and symptoms of ischemia and no obstructive coronary artery disease who underwent invasive coronary functional testing, mean resting left ventricular end-diastolic pressure was 14.4 plus or minus 5.0 mmHg and 150 of the 253 women, or 59 percent, had a value above 12 mmHg [12]. End-diastolic pressure related directly to body mass index and to systolic blood pressure at the time of testing, and to the time to peak filling rate, but showed no relationship to invasive or non-invasive measures of coronary microvascular dysfunction [12]. The takeaway is that a normal ejection fraction does not rule out an abnormal pressure-volume relationship, and that loading conditions and body habitus influence filling pressure independently of the coronary microcirculation.
Common mistakes students make
- Treating ejection fraction as a measure of cardiac output. Ejection fraction is a ratio. A small ventricle with a normal ejection fraction can have a low absolute stroke volume. Always pair ejection fraction with stroke volume and heart rate.
- Using end-diastolic pressure interchangeably with end-diastolic volume. The pressure-volume relationship shifts with vasoactive drugs, pericardial constraint, right ventricular pressure, and filling rate [6]. Pressure is a surrogate, not an identity.
- Assuming a bigger fill always means a bigger stroke volume. The curve plateaus. Past the plateau, additional volume raises pressure without raising output.
- Confusing contractility with preload. A failing ventricle can have a high preload and a low stroke volume. Preload is the input. Contractility sets the height of the curve.
- Ignoring the atrium. Atrial contraction contributes to ventricular filling, and that contribution grows when ventricular function falls [3].
- Forgetting that the mechanism is regional as well as global. A segment with ischemia can do negative work while the ventricle as a whole still looks reasonable [9].
- Reading one beat as the whole story. In irregular rhythms, stroke volume varies beat to beat through both interval-force and filling effects [10].
Limitations
The formulas are simple, but the measurements are not. End-diastolic and end-systolic volumes depend on the imaging method, the body size of the animal, and the loading conditions at the moment of the study. Normal ranges vary with species and breed. The Frank-Starling relationship describes a direction of effect, not a precise prediction for an individual animal. Any decision about fluid therapy, inotropes, or diuretics in a specific patient requires a veterinarian who can integrate the physical examination, the history, and the imaging findings.
Quick Review
- Stroke volume equals end-diastolic volume minus end-systolic volume, in mL per beat.
- Ejection fraction equals stroke volume divided by end-diastolic volume, times 100, in percent.
- Worked example: EDV 80 mL, ESV 40 mL, SV 40 mL, EF 50 percent.
- The Frank-Starling mechanism links preload (end-diastolic volume or pressure) to stroke volume through the force-length relationship of cardiac muscle.
- The curve ascends, then plateaus. Past the plateau, more filling does not mean more output.
- Heart failure depresses the curve and shifts it right, so more filling is needed for the same stroke volume.
- Contractility moves end-systolic volume. Filling moves end-diastolic volume. Both change stroke volume, but by different routes.
Frequently Asked Questions
What is the Frank-Starling equation in one sentence?
The Frank-Starling equation is stroke volume equals end-diastolic volume minus end-systolic volume, and it is paired with ejection fraction equals stroke volume divided by end-diastolic volume.
Why does the Frank-Starling curve flatten at high filling volumes?
The curve flattens because cardiac muscle reaches the sarcomere length at which further stretch no longer improves actin and myosin overlap, so additional filling produces little additional force.
Does a normal ejection fraction mean the heart is working well?
No. Ejection fraction is a ratio, so it can look normal while absolute stroke volume and cardiac output are low, and filling pressures can be elevated even when ejection fraction is preserved [12].
What happens to the Frank-Starling curve in heart failure?
The curve is depressed and shifted to the right, meaning the ventricle produces less stroke volume at any given filling volume and needs a higher filling volume to achieve the same output.
Can end-diastolic pressure be used instead of end-diastolic volume to judge preload?
Only cautiously. The diastolic pressure-volume relationship shifts with vasoactive drugs, pericardial constraint, right ventricular pressure, and filling rate, so pressure and volume are not interchangeable [6].
Do all vertebrates use the Frank-Starling mechanism?
A positive relationship between ventricular distension and ejection force has been found across all vertebrate lineages studied, which suggests the mechanism is broadly conserved [2].
Related Articles
- Generalized Estimating Equations (GEE) in Life Sciences
- Veterinary Ventilator Settings: Volume vs Pressure Control
- How to Calculate the Volume of a Bacterial Colony from Diameter
- Dog Heat Stroke
- What To Do If Dog Heat Stroke
- Subcutaneous Fluid Therapy in Dogs: Indications, Volumes, and Monitoring
- Frank-Starling Law: Cardiac Output Explained
Sources
- Modeling the Frank-Starling Mechanism at the Cardiac Muscle and Ventricle Levels.
- Frank-Starling mechanism and short-term adjustment of cardiac flow.
- Study on left atrial contractile performance--participation of Frank-Starling mechanism.
- Modeling the transient response to volume perturbations in the beating heart by the difference equation method.
- Mechanism of sustained mechanical alternans. Effect of variations in ventricular billing volume.
- Acute hemodynamic interventions shift the diastolic pressure-volume curve in man.
- Non-invasive pressure-volume loop analysis in left ventricular load manipulation.
- Blood pressure threshold confines stroke volume responsiveness to passive leg raising in healthy individuals.
- Regional work of the ventricle: wall tension--area relation.
- Frank-Starling mechanism contributes modestly to ventricular performance during atrial fibrillation.
- Serial Changes in Left Ventricular Ejection Fraction After Transcatheter Aortic Valve Implantation: Associations With Ischemic Heart Disease and Left Ventricular End-Diastolic Diameter.
- Left ventricular end-diastolic pressure in women with ischemia and no obstructive coronary artery disease: The women's ischemia syndrome evaluation - Coronary microvascular dysfunction study (WISE-CVD).