Simple Sequence Repeats: SSR Markers Explained
By Dr. Zubair Khalid, DVM, MS, PhD ·
A simple sequence repeat (SSR) is a stretch of DNA in which a short motif of one to six base pairs is repeated in tandem, such as (CA)12 or (GATA)7. Because the number of repeats at a given locus varies between individuals, SSRs are also called microsatellites, and the flanking DNA that surrounds each repeat is conserved enough to place a PCR primer pair on either side.
SSRs matter because they turn a small, cheap PCR reaction into a genotype. A single pair of primers amplifies one locus, and the length of the product tells you which allele an animal carries. That combination of simplicity and information content is why SSR markers have been the workhorse of parentage verification, linkage mapping, population genetics, and breed assignment in veterinary and agricultural genetics for decades [1][2][3].
What Is a Simple Sequence Repeat?
The term covers any tandemly repeated run of a 1 to 6 nucleotide motif. The motif is called the repeat unit, and the number of times it appears is the repeat number. A locus with the sequence 5'-...(GT)18...-3' has a GT dinucleotide motif repeated 18 times. Change the 18 to 21 and you have a different allele at the same locus.
Repeat units are classified by length:
- Mononucleotide: one base, for example (A)n
- Dinucleotide: two bases, for example (CA)n
- Trinucleotide: three bases, for example (CAG)n
- Tetranucleotide: four bases, for example (GATA)n
- Pentanucleotide and hexanucleotide: five and six bases
Dinucleotide repeats are the most abundant class in many mammalian genomes, while trinucleotide repeats are frequently the most common class in some protozoan genomes. In Giardia duodenalis, a genome-wide survey identified 1,853 SSRs and found that trinucleotide repeats were the most common class, followed by tetranucleotides [4]. That distribution is not universal, which is why repeat-class composition is reported genome by genome rather than assumed.
SSRs sit in both coding and noncoding DNA. When they fall inside a gene, they can sit in a 5' untranslated region, an intron, or an exon. In Giardia, many SSR loci were assemblage-specific, and alongside hypothetical proteins, variant-specific surface proteins accounted for nearly half of the annotated SSR loci [4]. That pattern shows SSRs are not inert filler. They land in functionally meaningful sequence often enough to matter.
How Replication Slippage Generates Length Polymorphism
The polymorphism that makes SSRs useful comes mostly from replication slippage, a polymerase error specific to repetitive DNA.
During DNA replication, the template strand and the newly synthesized strand can transiently separate and reanneal out of register. When the repeat unit is short and repeated many times, the nascent strand can loop out and pair with a repeat copy one unit downstream, or the template strand can loop out and leave a repeat copy unpaired. The polymerase then continues from the misaligned position.
Two outcomes follow:
- If the new strand loops out, the polymerase copies the looped region twice, and the daughter strand gains one repeat unit.
- If the template strand loops out, the polymerase skips a repeat unit, and the daughter strand loses one repeat unit.
The result is a change in repeat number by one or a few units. Because slippage is far more frequent at long, uninterrupted repeats than at unique sequence, SSR loci accumulate length variation at rates orders of magnitude higher than the background point mutation rate. That is the origin of the length polymorphism that defines an SSR marker.
Slippage is also the reason SSRs are unstable. Long repeats expand and contract over generations, and the same mechanism produces the stutter bands that complicate scoring, which is covered below.
Why Flanking Regions Allow Primer Design
Length polymorphism alone is useless without a way to amplify the locus. The conserved DNA immediately flanking the repeat provides that anchor. Primers are designed to anneal to unique sequence outside the repeat, one primer on each side, so the amplicon spans the entire repeat tract.
A typical SSR assay works like this:
- Design forward and reverse primers in the conserved flanking sequence, usually 18 to 25 nucleotides each.
- Label the forward primer with a fluorescent dye, or use a labeled reverse primer.
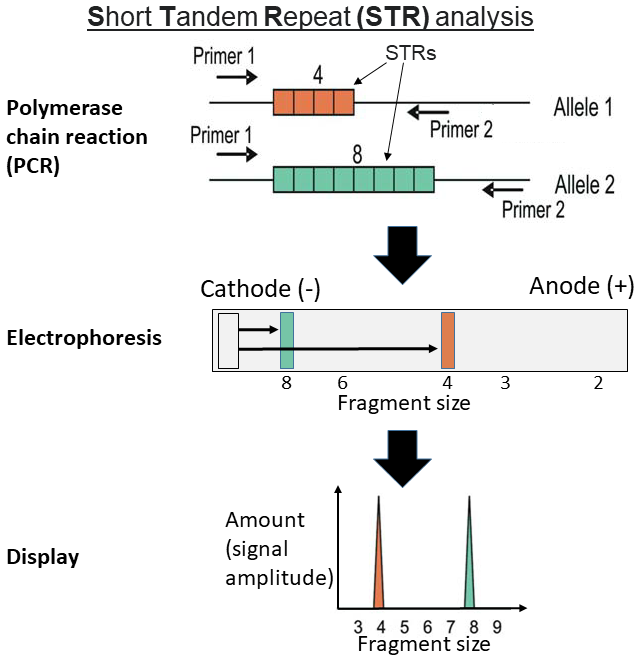
- Amplify genomic DNA by PCR. The amplicon length equals the distance between primer binding sites plus the length of the repeat tract.
- Separate products by capillary electrophoresis or high-resolution melting and read the fragment size in base pairs.
Because the flanking sequence is conserved across individuals of a species, one primer pair works for every sample. Because the repeat tract is variable, the amplicon length differs between alleles. The fragment size in base pairs is the allele call.
SSR Markers Compared With Other Marker Types
The table below places SSRs next to the marker types students most often confuse them with.
| Feature | SSR (microsatellite) | SNP | RFLP | Minisatellite (VNTR) |
|---|---|---|---|---|
| Repeat or variant unit | 1 to 6 bp tandem repeat | Single base substitution | Restriction site change | 10 to 100 bp tandem repeat |
| Typical alleles per locus | Often 2 to 10 or more | 2 (biallelic) | Usually 2 | Often many |
| Codominant | Yes | Yes | Yes | Yes |
| Detection method | PCR plus fragment sizing | Hybridization or sequencing | Digestion plus gel | Southern blot or PCR |
| Throughput | Moderate, multiplexable | Very high | Low | Low to moderate |
| Main diagnostic value | Parentage, diversity, mapping | Genome-wide association, breed assignment | Legacy mapping | Historical identity testing |
The most important practical difference is allele number. A single SSR locus can carry many alleles in a population, so a panel of 10 to 20 loci can deliver high individual discrimination. SNP panels achieve the same power with far more loci but each locus carries less information on its own.
How SSRs Are Genotyped in Practice
_analysis.png)
The workflow is short and cheap compared with sequencing-based methods, which is exactly why it remains widely used.
Step 1: Sample and DNA extraction
Almost any tissue with nucleated cells works. Blood gives the highest DNA yield, but noninvasive samples are increasingly used for wildlife. In a study of the vulnerable Chinese Egret, blood yielded DNA concentrations of 154.0 to 385.5 ng/µL, while fecal samples ranged from 1.25 to 27.5 ng/µL, and the authors noted that low-quality noninvasive samples can produce low amplification success and higher genotyping error [5]. Sample quality is a real variable in SSR work.
Step 2: Multiplex PCR
Several primer pairs, each labeled with a different fluorophore or designed to produce non-overlapping size ranges, are combined in one reaction. Multiplexing is standard. A study of Toxoplasma gondii from Tunisian livestock used a multiplex PCR with 15 microsatellite markers to genotype isolates from sheep and chickens [6].
Step 3: Fragment sizing
Products are separated by capillary electrophoresis, and the software converts migration time into a size in base pairs. High-resolution melting is an alternative. A comparison of genotyping workflows for Moroccan carob populations found that high-resolution melting provided the highest discriminatory resolution among the approaches tested [7].
Step 4: Allele calling and analysis
Each sample is scored as two allele sizes, one per chromosome copy, because SSR alleles are codominant. A heterozygous animal shows two peaks. A homozygous animal shows one. Codominant scoring is what lets SSR data be used for parentage and for Hardy-Weinberg based population analysis [8].
Applications of SSR Markers
SSR panels are applied across four broad domains. The table below compares them with veterinary and agricultural examples.
| Application | What the data answer | Typical panel size | Veterinary or agricultural example |
|---|---|---|---|
| Parentage testing | Is this the sire or dam of this offspring? | 10 to 20 loci, ISAG-recommended | Equine parentage verification using 11 microsatellite loci recommended by ISBC and ISAG [9] |
| Linkage mapping | Which chromosomal region travels with a trait? | 100 to 300 loci across the genome | SSR loci associated with backfat thickness in Qinghai Bamei pigs [10] |
| Population genetics | How much diversity exists and how are populations structured? | 10 to 20 loci | Genetic structure of Lipizzan horse populations using 12 microsatellite markers [8]; KwaZulu-Natal indigenous chicken ecotypes typed at 19 autosomal loci [11] |
| Breed identification | Which breed or line does this animal belong to? | 20 to 30 loci | Discrimination of 49 alfalfa varieties with 23 SSR markers [2]; genome-wide SSR characterization across four miniature pig breeds [3] |
Parentage testing
Parentage panels are the most standardized SSR application in veterinary genetics. The International Society for Animal Genetics (ISAG) maintains recommended marker sets for major domestic species, and the International Stud Book Committee (ISBC) co-recommends the equine panel. A Ukrainian study genotyped Hucul, Thoroughbred, and Ukrainian Saddle Horse populations at 11 microsatellite loci recommended by ISBC and ISAG and confirmed that the marker set supports both parentage verification and monitoring of population processes within breeds [9].
The logic is straightforward. An offspring inherits one allele at each locus from each parent. If a candidate sire shares no allele with the offspring at two or more independent loci, he is excluded. With 10 to 20 polymorphic loci, exclusion probability approaches certainty.
Linkage mapping and marker-assisted selection
SSR loci that sit near a gene of interest can serve as proxies for the trait. In Qinghai Bamei pigs, five SSR loci were tested against backfat thickness, and three of them (V1, V2, and V3) were significantly associated with the trait. The authors proposed the underlying (AC)n and (TG)n repeat loci as candidate markers for marker-assisted selection [10].
Linkage mapping with SSRs is slower than SNP-based mapping because SSR loci are sparse. It remains useful in species without dense SNP arrays and in targeted validation of a candidate region.
Population genetics and conservation
Population geneticists use SSR panels to measure heterozygosity, allelic richness, and differentiation between groups. The Lipizzan horse study genotyped 547 animals at 12 microsatellite markers and reported a mean number of alleles of 5.78, an effective number of alleles of 3.24, and an FST of 0.07, with the lowest diversity in the Bosnia and Herzegovina subpopulation [8]. Those numbers describe within-breed variation and between-population structure.
The same approach applies to wildlife. Red and sika deer in the western Czech Republic were screened with bi-parentally inherited microsatellite markers in a Bayesian framework, and the analysis confirmed interspecific hybridization that could not be reliably detected from phenotype alone [12]. In the KwaZulu-Natal chicken study, 19 autosomal microsatellite loci revealed clear substructuring between indigenous ecotypes and conserved breeds, with observed heterozygosity ranging from 0.61 to 0.70 in the village populations [11].
Breed and variety identification
Breed assignment asks a different question: given an unknown sample, which breed or line does it most resemble? SSR panels answer this when breeds differ in allele frequencies. In alfalfa, 23 SSR markers were screened against 49 varieties, and 21 of them were polymorphic with an average of 5.91 alleles per locus and a mean polymorphic information content (PIC) of 0.66, which the authors described as strong discriminatory efficiency [2].
In pigs, genome-wide SSR characterization across Wuzhishan, Bama, inbred Luchuan, and Zangxiang miniature breeds found that the number and type of SSRs, the distribution of repeat units, and the polymorphic SSRs all varied between breeds, with 2,518 polymorphic SSRs shared across all four [3]. That kind of breed-specific variation is the raw material for breed assignment.
Reading SSR Data: Codominance and Allele Size
Two concepts govern how SSR data are interpreted.
Codominance means both alleles at a locus are visible in a heterozygote. A diploid animal with a 141 bp allele and a 145 bp allele at a dinucleotide locus shows two peaks separated by 4 bp. This is why SSRs can be used for parentage and for direct estimation of heterozygosity. In the Bamei pig study, the V1 locus carried three alleles of 141, 143, and 145 bp, the V2 locus carried 128, 130, and 132 bp alleles, and the V3 locus carried 160 and 162 bp alleles [10]. Alleles are always reported as fragment sizes in base pairs.
Allele size is not the same as repeat number. A 141 bp allele at a dinucleotide locus is 141 bp long, but the number of repeats depends on the distance between the primer binding sites in the flanking sequence. Two laboratories using different primers at the same locus will report different absolute sizes for the same allele. That is why allele bins must be calibrated within a laboratory and why cross-laboratory comparisons require reference samples.
Common Mistakes and Limitations
SSR genotyping has well-known failure modes. Recognizing them prevents bad data.
Stutter bands. During PCR, the polymerase slips on the repeat tract just as it does during replication. This produces a ladder of minor products one repeat unit shorter than the true allele, and sometimes one unit longer. Stutter is most severe at dinucleotide repeats and less severe at tetranucleotide repeats. Analysts set a stutter threshold and treat peaks below it as artifact, but a genuine minor allele can fall below that threshold and be missed.
Null alleles. A null allele is a variant in which the primer binding site is mutated, so the allele fails to amplify. A heterozygous sample carrying one null allele appears homozygous for the other allele. Null alleles inflate apparent homozygosity and can create false exclusions in parentage testing. They are detected as consistent deviations from Hardy-Weinberg expectations across many samples.
Allele dropout in poor-quality samples. Low-template DNA from feces, hair, or degraded tissue can cause one of two alleles to fail to amplify by chance. The Chinese Egret study documented that noninvasive samples can yield low DNA concentrations and higher genotyping error, which is the mechanism behind dropout [5].
Size homoplasy. Two alleles of identical fragment length can differ in internal sequence or repeat structure. Fragment sizing cannot distinguish them. This matters most in population genetics, where homoplasy reduces apparent diversity.
Allele calling across platforms. Different capillary systems and polymer chemistries shift absolute sizes. A comparison of high-resolution melting, conventional PCR, and capillary electrophoresis for carob SSR genotyping found that the three workflows differed in discriminatory resolution, with high-resolution melting giving the highest resolution in that study [7]. Platform choice affects the data.
Multiplex imbalance. When primer pairs are pooled, one locus can dominate the reaction and suppress others. Peak heights must be checked per locus, not per sample.
Contamination. Because SSR primers amplify any sample carrying the target flanking sequence, a contaminating amplicon from a previous reaction produces a spurious allele. Negative controls are mandatory.
Individual cases and clinical or regulatory decisions need a veterinarian or a genetics professional. The assay is simple, but interpretation in a specific animal is not.
Quick Review
- An SSR is a tandem repeat of a 1 to 6 bp motif, also called a microsatellite.
- Length polymorphism arises mainly from replication slippage, which adds or removes repeat units.
- Conserved flanking sequence allows one PCR primer pair to amplify the locus in every individual.
- Alleles are codominant and reported as fragment sizes in base pairs.
- SSRs are used for parentage testing, linkage mapping, population genetics, and breed identification.
- Stutter bands, null alleles, and allele dropout are the main scoring hazards.
- ISAG and ISBC maintain recommended marker panels for major domestic species.
Frequently Asked Questions
What is a simple sequence repeat in simple terms?
A simple sequence repeat is a short DNA motif of one to six bases that is repeated many times in a row at one position in the genome. The number of repeats varies between individuals, which makes the locus useful as a genetic marker.
How do SSRs differ from SNPs?
An SSR varies in the length of a tandem repeat, so a locus can have many alleles. A SNP varies at a single base position, so it has only two alleles. SSRs need fewer loci to identify an individual, while SNPs allow far higher throughput.
Why are SSR alleles called codominant?
Because both alleles are detected in a heterozygote. A heterozygous animal produces two fragment sizes, one from each chromosome copy, so the genotype can be read directly from the peak pattern.
What causes stutter bands in SSR genotyping?
PCR slippage on the repeat tract. The polymerase adds or drops a repeat unit during amplification, creating minor products one unit shorter or longer than the true allele. Stutter is worse at dinucleotide repeats than at tetranucleotide repeats.
What is a null allele in SSR analysis?
A null allele is a version of the locus that fails to amplify because the primer binding site has mutated. A sample carrying one null allele looks homozygous for the other allele, which can cause false exclusions in parentage testing.
Can SSR markers identify an animal's breed?
Yes, if the breeds differ in allele frequencies at the loci tested. Breed assignment works best with 20 to 30 polymorphic loci and a reference panel of known-breed animals, as shown in alfalfa variety discrimination and miniature pig breed characterization [2][3].
Related Articles
- Repeat Expansion Sequencing
- Single Cell Marker Validation
- CRISPR Explained: A Simple Guide to Gene Editing
- Selectable Markers in Vector Design
- Selectable Marker in Plasmid: Function and Applications
- Plant Breeding with Molecular Markers
Sources
- Analysis of Genetic Diversity of Banana Weevils (Cosmopolites sordidus) (Coleoptera: Curculionidae) Using Transcriptome-Derived Simple Sequence Repeat Markers.
- Simple Sequence Repeat-Based Genetic Diversity Analysis of Alfalfa Varieties.
- Genome-Wide Characterization and Comparative Analyses of Simple Sequence Repeats among Four Miniature Pig Breeds.
- Molecular genotyping, diversity studies and high-resolution molecular markers unveiled by microsatellites in Giardia duodenalis
- Noninvasive and nondestructive sampling for avian microsatellite genotyping: a case study on the vulnerable Chinese Egret (Egretta eulophotes)
- First isolation and genotyping of Toxoplasma gondii strains from domestic animals in Tunisia
- Assessing the efficiency of high-resolution melting, conventional PCR, and capillary electrophoresis in SSR marker-based genotyping of carob populations.
- Genetic Diversity and Population Structure in Seven Lipizzan Populations Based on Microsatellite Genotyping.
- Genetic structure of different equine breeds by microsatellite DNA loci
- Three novel simple sequence repeats (SSRs) identified by MALDI-TOF-MS method were associated with backfat in pig.
- Genetic diversity, population structure and ancestral origin of KwaZulu-Natal native chicken ecotypes using microsatellite and mitochondrial DNA markers
- A Microsatellite Genotyping-Based Genetic Study of Interspecific Hybridization between the Red and Sika Deer in the Western Czech Republic