How to Validate Restriction Enzyme Digestion by Gel Electrophoresis: Interpreting Band Patterns
By Dr. Zubair Khalid, DVM, MS, PhD ·
Key Takeaways
- Restriction enzyme digestion is validated by agarose gel electrophoresis, which separates DNA fragments by size under an electric field, allowing comparison of observed band patterns to predicted fragment lengths to confirm digestion completeness and accuracy.
- Critical controls for validation include undigested DNA to assess conformational states (supercoiled, nicked, linear), single-enzyme digests to verify individual enzyme activity, and a no-enzyme control to detect nuclease contamination.
- Interpretation focuses on band sizes relative to a molecular weight ladder, the number of bands, and their relative intensities, which should correspond to the molar ratios of DNA fragments.
- Common pitfalls include partial digestion (presence of intermediate-sized fragments), star activity (non-specific cleavage at non-canonical sites producing numerous small fragments), and DNA degradation (smearing across the gel).
- Agarose gel concentration is crucial for resolution, with higher percentages (1.5-2.0%) optimal for small fragments (<2 kb) and lower percentages (0.7-1.0%) for larger fragments (>2 kb).
- Documentation of gel images, including labeled lanes, ladder sizes, and digestion conditions, is essential for reproducibility and troubleshooting, alongside careful consideration of biosafety protocols for DNA stains like ethidium bromide.
Restriction enzyme digestion validation by gel electrophoresis is the process of separating DNA fragments by size through an agarose gel matrix under an electric field, then comparing the observed band pattern against the predicted fragment sizes to confirm that digestion has occurred as expected. This method is essential for verifying plasmid construction, confirming insert release, detecting partial or failed digestion, and assessing DNA quality before downstream applications such as cloning, sequencing, or labeling. By analyzing band positions, intensities, and the presence or absence of expected fragments, researchers can determine whether a restriction digest is complete, partial, or compromised by star activity or sample contamination.
At a Glance
| Aspect | Key Information |
|---|---|
| Purpose | Confirm restriction digestion completeness and accuracy |
| Principle | DNA fragments separate by size in agarose gel under electrophoresis |
| Key Materials | Agarose, TAE or TBE buffer, DNA stain (e.g., ethidium bromide, SYBR Safe), molecular weight ladder |
| Critical Controls | Undigested DNA, single-enzyme digests, no-enzyme control |
| Interpretation Focus | Band sizes, number of bands, relative intensities, presence of uncut or partially cut DNA |
| Common Pitfalls | Partial digestion, star activity, DNA degradation, gel artifacts |
| Documentation | Gel image with labeled lanes, ladder sizes, and digestion conditions |
Scientific Principle of Restriction Digestion Analysis
Restriction endonucleases recognize specific palindromic DNA sequences, typically 4–8 base pairs in length, and cleave both strands at defined positions within or near that recognition site. When a purified DNA molecule, such as a plasmid, PCR product, or genomic DNA, is incubated with a restriction enzyme under appropriate buffer and temperature conditions, the enzyme generates a predictable set of linear fragments. The number and size of these fragments depend on the number and positions of recognition sites within the DNA molecule.
Agarose gel electrophoresis separates these fragments based on their molecular weight. DNA, being negatively charged at neutral pH, migrates toward the positive electrode when an electric field is applied. The agarose matrix acts as a molecular sieve: smaller fragments move more quickly through the pores, while larger fragments are retarded. After electrophoresis, the DNA is visualized by staining with a fluorescent dye that intercalates between DNA bases, such as ethidium bromide or SYBR Safe. The resulting band pattern is compared to a molecular weight ladder (a mixture of DNA fragments of known sizes) to estimate fragment lengths.
The relationship between fragment size and migration distance is logarithmic under standard conditions. For linear double-stranded DNA, a plot of log(size) versus migration distance yields a straight line over a useful range, typically from 0.5 kb to 10 kb for standard 0.8–1.5% agarose gels. This relationship allows researchers to estimate fragment sizes by comparing band positions to the ladder, though precise sizing requires careful gel preparation and running conditions.
Materials and Instrumentation Choices
Agarose Concentration Selection
The choice of agarose concentration is critical for resolving fragments of different size ranges. A 0.7% agarose gel provides good separation for fragments between 0.8 kb and 10 kb, while 1.0% agarose is optimal for fragments between 0.5 kb and 7 kb. For smaller fragments (0.1–2 kb), 1.5–2.0% agarose improves resolution. For very large fragments (>10 kb), 0.5–0.6% agarose may be necessary, though such gels are fragile and require careful handling.
The gel percentage should be chosen based on the expected fragment sizes from the restriction digest. If the digest produces fragments spanning a wide size range, a compromise concentration (typically 0.8–1.0%) is often used. Alternatively, two separate gels at different concentrations can be run to resolve both large and small fragments.
Buffer Systems: TAE vs. TBE
Two common electrophoresis buffers are Tris-acetate-EDTA (TAE) and Tris-borate-EDTA (TBE). TAE has lower buffering capacity and is preferred for DNA recovery applications because it does not interfere with downstream enzymatic reactions. However, TAE gels may overheat during extended runs at high voltage. TBE has higher buffering capacity and provides sharper band resolution, especially for fragments smaller than 1 kb. For routine restriction digest analysis, either buffer is acceptable, but consistency within a laboratory is important for reproducible migration patterns.
DNA Stains
Ethidium bromide (EtBr) is the traditional stain for agarose gels, typically added to the gel and running buffer at 0.5 μg/mL. It is a potent mutagen and must be handled with appropriate personal protective equipment and disposed of according to institutional hazardous waste guidelines. Safer alternatives include SYBR Safe, SYBR Gold, and GelRed, which have lower toxicity and can be detected with standard UV transilluminators or blue-light systems. Post-electrophoresis staining with these dyes often provides better sensitivity than pre-cast staining.
Molecular Weight Ladders
A DNA ladder with fragments spanning the expected size range of the digest products is essential for size estimation. Common choices include 1 kb ladders (covering 0.5–10 kb), 100 bp ladders (for smaller fragments), and lambda DNA/HindIII digests (for larger fragments). The ladder should be loaded in at least one lane per gel, ideally flanking the sample lanes to account for any gel distortion.
Critical Controls for Digestion Validation
Proper controls distinguish between successful digestion, partial digestion, and experimental artifacts. The following controls should be included in every gel analysis:
Undigested DNA Control
Loading an aliquot of the same DNA sample that was not exposed to restriction enzyme reveals the migration pattern of uncut DNA. Supercoiled plasmid DNA migrates faster than its linear form of the same size, while nicked circular (open circular) DNA migrates more slowly. Comparing the undigested control to the digested sample immediately shows whether the enzyme has altered the DNA conformation.
Single-Enzyme Digests
When performing a double digest, each enzyme should also be tested individually in separate reactions. This control confirms that each enzyme is active under the buffer conditions used and reveals the fragment pattern expected from each single digest. If the double digest produces a pattern that is not the sum of the two single digests, it may indicate buffer incompatibility, star activity, or DNA degradation.
No-Enzyme Control
A reaction containing all components except the restriction enzyme serves as a negative control. This control detects any nuclease contamination in the buffer, water, or DNA sample that could produce spurious bands. If the no-enzyme control shows degradation, the digestion results are unreliable.
Molecular Weight Ladder
At least one lane of DNA ladder should be included per gel. For precise size estimation, load the ladder in two lanes (one on each side of the sample lanes) to account for "smiling" effects where the gel runs faster at the edges.
Conceptual Workflow for Gel Analysis
Step 1: Prepare the Agarose Gel
Weigh the appropriate amount of agarose powder and add it to the measured volume of 1× TAE or TBE buffer in a flask. Heat the mixture in a microwave or on a hot plate until the agarose is completely dissolved and the solution is clear. Allow the solution to cool to approximately 55–60°C (comfortable to touch but still warm), then add DNA stain if using a pre-cast staining method. Pour the gel into a casting tray with the comb inserted and allow it to solidify at room temperature for 20–30 minutes.
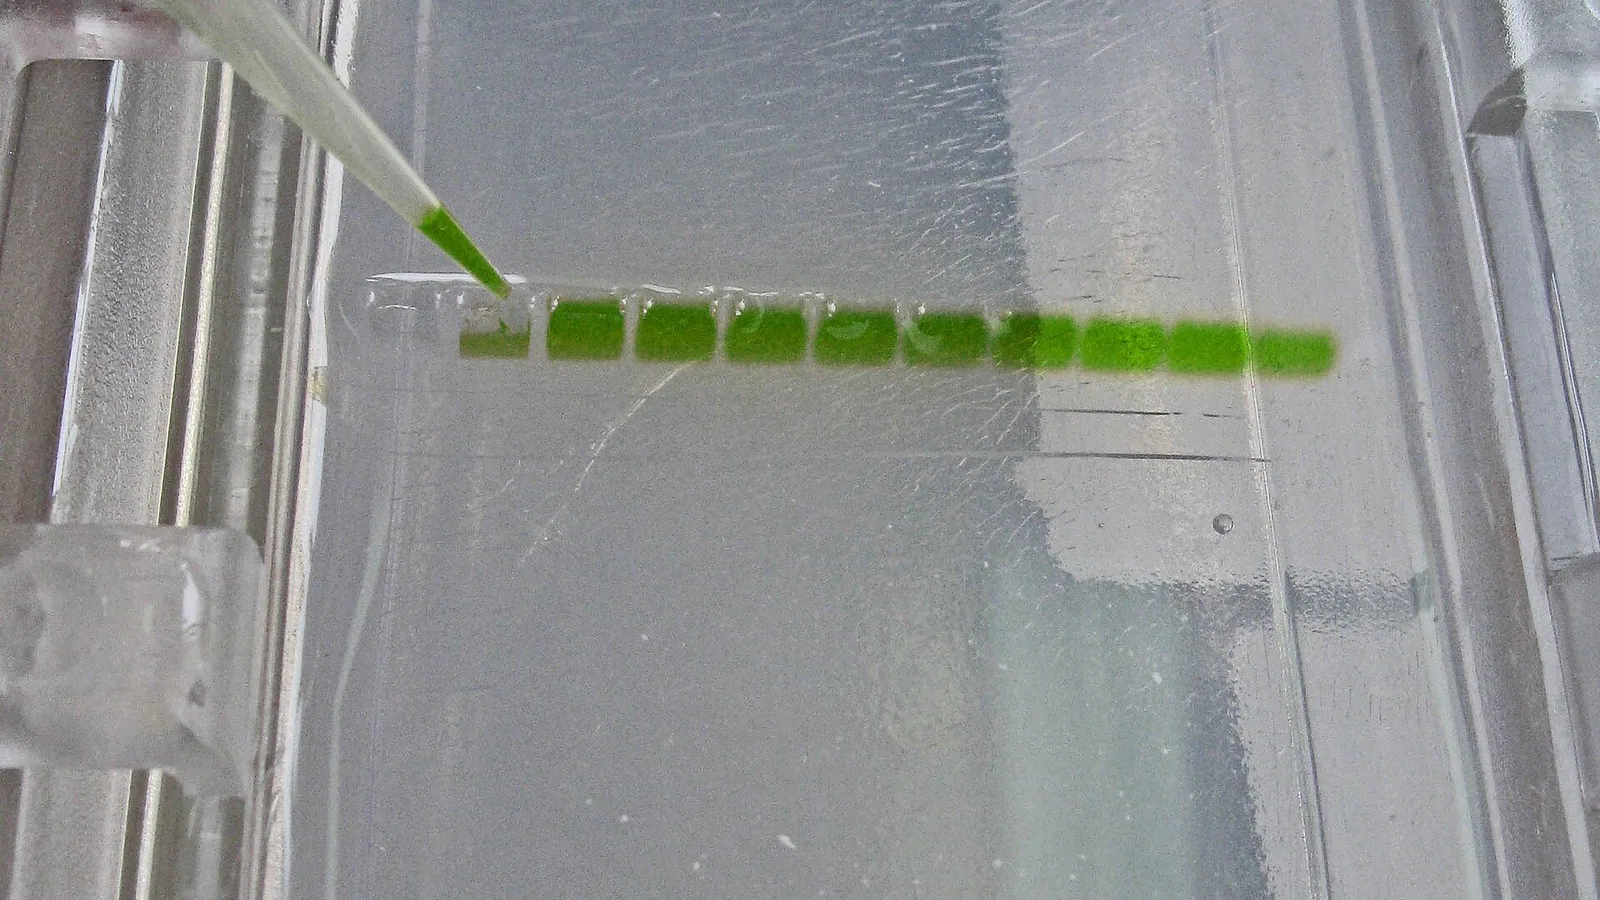
Step 2: Load Samples
Mix each DNA sample with loading dye (typically 6× dye containing glycerol, EDTA, and tracking dyes such as bromophenol blue and xylene cyanol). The dye serves several purposes: it increases sample density so the DNA sinks into the well, it provides visible tracking of migration progress, and the EDTA chelates magnesium ions to stop any residual enzyme activity. Load 5–10 μL of each sample per well, depending on well size and DNA concentration.
Step 3: Electrophoresis
Place the gel in the electrophoresis tank filled with 1× running buffer. Connect the power supply and run at 5–10 V/cm (measured as the distance between electrodes) until the tracking dye has migrated an appropriate distance. For a standard 10 cm gel, this typically takes 45–90 minutes at 80–120 V. The bromophenol blue dye migrates at approximately 300–500 bp in a 1% agarose gel, while xylene cyanol migrates at approximately 4–5 kb.
Step 4: Visualize and Document
After electrophoresis, transfer the gel to a transilluminator. For UV-transparent gels, use a UV transilluminator at 302 nm or 365 nm. For blue-light compatible stains, use a blue-light transilluminator. Capture an image with a gel documentation system, ensuring proper exposure to visualize both faint and intense bands. Include a ruler or scale bar in the image for reference.
Quality Checks During Gel Analysis
Assessing DNA Integrity
Before interpreting restriction patterns, evaluate the overall quality of the DNA in each lane. Smearing across the lane indicates degradation, which may result from nuclease contamination, repeated freeze-thaw cycles, or improper storage. Degraded DNA will not produce clean restriction patterns and should not be used for validation.
Checking for Complete Digestion
Complete digestion is indicated by the absence of the undigested DNA band (supercoiled or nicked circular) and the presence of only the expected linear fragments. For plasmid DNA, complete linearization with a single cutter produces a single band at the expected size. For multiple cutters, all predicted fragments should be visible, and their relative intensities should correspond to their sizes (larger fragments stain more intensely because they bind more dye molecules).
Evaluating Band Sharpness
Well-resolved bands should appear as sharp, discrete lines. Fuzzy or diffuse bands may indicate incomplete digestion, excessive DNA loading, or electrophoresis at too high a voltage. If bands are consistently fuzzy across all lanes, the problem is likely with the gel or running conditions rather than the digestion itself.
Interpreting Restriction Digestion Band Patterns
Complete Digestion
A complete digestion produces all predicted fragments at the expected sizes. For a plasmid with two restriction sites, the digest should yield two bands whose sizes sum to the plasmid length. For example, a 5 kb plasmid cut with two enzymes that produce fragments of 2 kb and 3 kb should show exactly those two bands, with the 3 kb band appearing approximately 1.5 times more intense than the 2 kb band due to the greater amount of DNA.
Partial Digestion
Partial digestion occurs when the restriction enzyme fails to cleave all recognition sites in every DNA molecule. This results in additional bands corresponding to intermediate fragments that contain uncleaved sites. For example, if a plasmid has two EcoRI sites, complete digestion produces two fragments. Partial digestion may produce three bands: the two complete fragments plus a larger fragment representing the uncut plasmid or a fragment spanning both sites.
Partial digestion is often caused by insufficient enzyme, short incubation time, inhibitors in the DNA preparation, or suboptimal buffer conditions. It can be distinguished from complete digestion by the presence of bands that do not correspond to any predicted fragment and by the persistence of a band at the position of undigested DNA.
Star Activity
Star activity refers to the relaxation of restriction enzyme specificity under non-optimal conditions, leading to cleavage at sequences similar but not identical to the canonical recognition site. This produces additional unexpected bands that are typically smaller than the predicted fragments. Star activity is promoted by high glycerol concentrations (>5%), low ionic strength buffers, high pH, the presence of organic solvents, or excessive enzyme concentration.
Star activity can be distinguished from partial digestion by the pattern of extra bands: star activity produces many small fragments, while partial digestion produces larger intermediate fragments. If star activity is suspected, repeat the digestion with fresh buffer, reduce enzyme concentration, and ensure glycerol is below 5% of the reaction volume.
No Digestion
If the digested sample appears identical to the undigested control, the enzyme may be inactive, the recognition site may be absent or methylated, or the reaction conditions may be incorrect. Check the enzyme expiration date, verify the buffer composition, and confirm that the DNA contains the expected restriction site by reviewing the sequence.
Troubleshooting Common Gel Interpretation Issues
| Observation | Likely Cause | Discriminating Check |
|---|---|---|
| No bands visible in any lane | Stain not added or UV transilluminator off | Check stain concentration and UV light function |
| Only ladder visible, no sample bands | DNA not loaded or degraded | Check pipetting; run undigested DNA control |
| Smearing across all lanes | DNA degradation or excessive voltage | Reduce voltage; check DNA integrity on separate gel |
| Extra bands not matching predictions | Partial digestion or star activity | Compare to single-enzyme controls; check glycerol concentration |
| Bands running at unexpected sizes | Gel percentage mismatch or buffer issues | Verify gel concentration; use fresh buffer |
| Faint bands despite adequate DNA | Poor staining or UV exposure | Restain gel; use longer UV exposure |
| Bands appear curved (smiling) | Gel overheating or uneven buffer level | Reduce voltage; ensure buffer covers gel evenly |
| Undigested DNA band persists | Incomplete digestion or inactive enzyme | Increase enzyme amount or incubation time; check enzyme activity |
Limitations of Gel-Based Validation
Size Resolution Limits
Standard agarose gels cannot resolve fragments that differ by less than 5–10% in size. Fragments smaller than 100 bp may not be visible on standard gels, and fragments larger than 20 kb may not enter the gel or may resolve poorly. For precise sizing of small fragments, polyacrylamide gel electrophoresis or capillary electrophoresis is required.
Quantitative Limitations
Band intensity provides only a rough estimate of DNA quantity. While larger fragments appear brighter, the relationship between band intensity and DNA amount is not strictly linear across a wide range. For accurate quantification, use spectrophotometry or fluorometric methods.
Inability to Detect Sequence Changes
Gel electrophoresis detects size differences but cannot identify sequence changes such as point mutations, small insertions or deletions, or methylation status unless these alter restriction sites. A digest that produces the correct band pattern does not guarantee that the DNA sequence is correct.
Artifacts from DNA Conformation
Supercoiled plasmid DNA migrates anomalously fast, while nicked circular DNA migrates slowly. Linear DNA migrates at an intermediate rate. These conformational differences can complicate interpretation if the DNA is not fully linearized. Always include an undigested control to distinguish between supercoiled, linear, and nicked forms.
Documentation Best Practices
Proper documentation of gel results is essential for reproducibility and publication. Each gel image should include:
- A label indicating the gel percentage, buffer type, and stain used
- Lane numbers or sample names written directly on the image
- The DNA ladder with sizes marked on the image
- The date of the experiment
- The electrophoresis conditions (voltage, time, buffer)
- Any observations about band quality or anomalies
Maintain a laboratory notebook or electronic record that cross-references the gel image with the digestion reaction conditions, including enzyme names, amounts, buffer composition, incubation time and temperature, and DNA concentration. This documentation allows troubleshooting if results are unexpected and provides evidence for publication or regulatory review.
Biosafety Considerations
Restriction digestion and gel electrophoresis of DNA from BSL-1 organisms or recombinant plasmids fall under routine molecular biology practices. According to the CDC and NIH Biosafety in Microbiological and Biomedical Laboratories (BMBL) 6th Edition, standard microbiological practices apply, including hand washing after handling samples, decontamination of work surfaces, and proper waste disposal [<a href="#ref-1">1</a>].
For work involving recombinant or synthetic nucleic acid molecules, researchers must follow the NIH Guidelines for Research Involving Recombinant or Synthetic Nucleic Acid Molecules, which require institutional biosafety committee oversight for certain experiments [<a href="#ref-2">2</a>]. Most routine restriction digestion and gel analysis of non-pathogenic plasmids falls under exempt or minimal risk categories, but researchers should verify their specific constructs with their institutional biosafety office.
Ethidium bromide is a mutagen and should be handled with gloves. Waste ethidium bromide gels and buffer should be collected separately and disposed of according to institutional hazardous waste protocols. Alternative stains such as SYBR Safe are less hazardous and may be preferred for teaching laboratories.
Frequently Asked Questions
How can I distinguish between partial digestion and star activity on a gel?
Partial digestion produces additional bands that are larger than the smallest predicted fragment, representing intermediates where some but not all restriction sites were cut. Star activity produces many small, unexpected fragments because the enzyme cuts at non-canonical sites. To distinguish them, compare the pattern to single-enzyme controls. Partial digestion often shows a band at the position of undigested DNA, while star activity typically does not. If star activity is suspected, repeat the digestion with lower enzyme concentration and ensure glycerol is below 5%.
Why does my undigested plasmid control show multiple bands?
Undigested plasmid DNA typically exists in three conformations: supercoiled (fastest migrating), linear (intermediate), and nicked circular or open circular (slowest migrating). The relative proportions depend on the DNA preparation method and storage conditions. If you see more than three bands, the DNA may be degraded or contaminated with genomic DNA or RNA. Treating the sample with RNase A can remove RNA contamination, and a clean plasmid preparation should show predominantly supercoiled DNA with a minor nicked circular fraction.
Can I use the same gel to analyze digests with very different fragment sizes?
For digests producing fragments spanning a wide size range (e.g., 200 bp to 10 kb), a single gel percentage may not resolve all fragments optimally. A 1% agarose gel provides reasonable separation across this range, but very small fragments (<300 bp) may be faint or run off the gel, while very large fragments (>8 kb) may not separate well. Consider running two separate gels at different percentages (e.g., 0.8% for large fragments and 1.5% for small fragments) or using a gradient gel. Alternatively, load more DNA to visualize faint small fragments and run the gel for a shorter time to retain large fragments.
How do I estimate fragment sizes accurately from a gel image?
Use image analysis software that allows you to measure migration distances and generate a standard curve from the DNA ladder. Plot the log of the ladder fragment sizes against their migration distances, then use the resulting equation to calculate the sizes of unknown bands. For best accuracy, load the ladder in multiple lanes and use the ladder closest to your sample lane. Manual estimation by visual comparison to the ladder is acceptable for routine checks but not for precise size determination required for cloning or publication.
Related Clinical & Scientific Guides
- Loop-Mediated Isothermal Amplification (LAMP) Assay for Rapid Detection of African Swine Fever Virus in Oral Fluids
- How to Calculate the Concentration of Protein Using the Lowry Assay
- DNA Extraction from Saliva: Non-Invasive Sampling and Protocols
- Restriction Enzyme Digestion: Protocol and Troubleshooting
References and Further Reading
[1] CDC and NIH. Biosafety in Microbiological and Biomedical Laboratories (BMBL), 6th Edition. U.S. Department of Health and Human Services, 2020. Available at: https://www.cdc.gov/labs/bmbl/index.html. *Authoritative guidelines for biosafety practices in molecular biology laboratories.* [2] National Institutes of Health. NIH Guidelines for Research Involving Recombinant or Synthetic Nucleic Acid Molecules. Available at: https://osp.od.nih.gov/policies/biosafety-and-biosecurity-policy/nih-guidelines-for-research-involving-recombinant-or-synthetic-nucleic-acid-molecules/. *Regulatory framework for recombinant DNA research including restriction enzyme work.* [3] Barton X, Fontaine JB, Tobe SS, Oskam CL. Harnessing 50 years of tick population genetics: Choosing the right molecular tool for contemporary research. 2025. PubMed ID: 40899772. *Provides context on molecular tools including restriction enzyme-based methods for population genetics studies.* [4] Trus P, Chang CY. Multidomain DNA-Protein Mining Reveals Polymorphic Variations in RhlB Enhancing Monorhamnolipid Biosynthesis. 2026. PubMed ID: 41996192. *Demonstrates restriction enzyme-based cloning and validation in a synthetic biology context.* [5] National Center for Biotechnology Information. NCBI Bookshelf: Molecular Biology and Laboratory Methods. Available at: https://www.ncbi.nlm.nih.gov/books/. *Comprehensive reference collection for molecular biology techniques and protocols.*Related Articles
- How to Interpret a Restriction Enzyme Digestion Gel: Band Patterns, Partial Digestion, and Star Activity
- How to Troubleshoot Restriction Enzyme Digestion: No Digestion, Partial Digestion, and Star Activity
- Restriction Enzyme Buffer Compatibility Chart and Selection Guide
- Restriction Digestion of Plasmid DNA: Protocol, Troubleshooting, and Quality Checks
- How to Design a Restriction Enzyme Cloning Experiment: From Fragment to Ligation
- How to Perform a Restriction Enzyme Double Digest: Protocol and Buffer Compatibility