Polyacrylamide Gel Electrophoresis vs Agarose Gel Electrophoresis: Key Differences
By Dr. Zubair Khalid, DVM, MS, PhD ·
Key Takeaways
- Agarose gel electrophoresis utilizes a polysaccharide matrix with large, variable pores (50-200 nm) optimized for separating nucleic acids from 100 bp to over 20 kb, offering moderate resolution suitable for routine DNA/RNA size analysis and restriction mapping.
- Polyacrylamide gel electrophoresis (PAGE) employs a crosslinked polyacrylamide matrix with small, tunable pores (5-100 nm), enabling high-resolution separation of proteins (5-250 kDa) and smaller nucleic acid fragments (10-500 bp), with single-base resolution achievable for DNA.
- PAGE preparation involves chemical polymerization requiring initiators (APS/TEMED) and careful handling due to acrylamide monomer's neurotoxicity, whereas agarose gel preparation is simpler, involving heat dissolution of a non-toxic powder.
- Agarose gels are cost-effective and rapid for general DNA/RNA analysis, while PAGE is essential for applications demanding fine molecular discrimination, such as protein molecular weight determination, DNA sequencing, and SNP analysis.
- Detection methods differ significantly: agarose gels commonly use intercalating dyes like ethidium bromide or SYBR Safe for nucleic acids, while PAGE employs stains like Coomassie Blue or silver stain for proteins, or can be followed by Western blotting.
- Key differences in resolution and optimal size range dictate method selection: agarose excels at separating larger nucleic acid fragments, while PAGE provides superior resolution for smaller nucleic acids and proteins.
Polyacrylamide gel electrophoresis (PAGE) and agarose gel electrophoresis are two foundational separation techniques in molecular biology that differ fundamentally in their gel matrix composition, pore size, resolving power, and optimal applications. Agarose gels, composed of linear polysaccharide polymers extracted from seaweed, form large pores ideal for separating nucleic acids ranging from approximately 100 base pairs to over 20 kilobases, with resolution sufficient for routine DNA fragment analysis, genotyping, and plasmid screening. Polyacrylamide gels, formed by crosslinking acrylamide monomers, create much smaller, tunable pores that enable high-resolution separation of proteins (typically 5–250 kDa) and smaller nucleic acid fragments (10–500 base pairs), with single-base resolution achievable under denaturing conditions. The choice between these methods depends primarily on the target molecule type, size range, and required resolution: agarose is preferred for rapid, cost-effective DNA and RNA analysis, while PAGE is essential for protein characterization, sequencing gels, and applications demanding fine molecular discrimination.
At a Glance
| Feature | Agarose Gel Electrophoresis | Polyacrylamide Gel Electrophoresis (PAGE) |
|---|---|---|
| Matrix composition | Linear polysaccharide (agarose) | Crosslinked polyacrylamide |
| Pore size | Large (50–200 nm, variable with agarose concentration) | Small (5–100 nm, tunable with %T and %C) |
| Resolution | Moderate (10–50 bp for DNA) | High (1 bp for DNA; 1–2 kDa for proteins) |
| Optimal size range (DNA) | 100 bp – 20+ kb | 10–500 bp |
| Optimal size range (proteins) | Not suitable | 5–250 kDa (depending on %T) |
| Separation principle | Sieving by molecular size | Sieving by molecular size (native or denaturing) |
| Gel preparation | Simple, heat-dissolve and pour | Requires polymerization (TEMED/APS) |
| Toxicity | Low (non-toxic powder) | Moderate (acrylamide monomer is neurotoxic) |
| Post-separation detection | Ethidium bromide, SYBR stains, UV shadowing | Coomassie Blue, silver stain, Western blot |
| Typical run time | 30–90 minutes | 1–4 hours |
| Cost per gel | Low | Moderate |
| Key applications | DNA/RNA size analysis, restriction mapping, PCR verification | Protein MW determination, DNA sequencing, SNP analysis |
Scientific Principles of Gel Matrix Formation
Agarose Gel Structure
Agarose is a linear polysaccharide composed of alternating D-galactose and 3,6-anhydro-L-galactopyranose units. When heated in buffer above its melting temperature (approximately 85–95°C) and cooled, agarose forms a three-dimensional network through hydrogen bonding between adjacent polymer chains. The pore size of this network is inversely proportional to the agarose concentration: higher percentage gels (e.g., 2–3% agarose) have smaller pores suitable for separating smaller DNA fragments, while lower percentage gels (0.5–0.8%) accommodate larger fragments. Typical agarose gels used for nucleic acid analysis range from 0.5% to 3% (w/v), producing effective pore diameters of approximately 50–200 nm [<a href="#ref-1">1</a>]. This large pore size allows DNA molecules, which are negatively charged and relatively rigid, to migrate through the matrix with minimal resistance, with separation based primarily on molecular weight.
Polyacrylamide Gel Structure
Polyacrylamide gels are formed by the chemical polymerization of acrylamide monomers (CH₂=CH-CONH₂) crosslinked with N,N′-methylenebisacrylamide (bis-acrylamide). The polymerization reaction is initiated by ammonium persulfate (APS) and catalyzed by N,N,N′,N′-tetramethylethylenediamine (TEMED), generating free radicals that create long polymer chains with crosslinks. The pore size is determined by two parameters: total acrylamide concentration (%T, typically 3–30%) and crosslinker concentration (%C, typically 2–5% of total monomer). Higher %T produces smaller pores, while %C affects the uniformity of the matrix. For protein separation, typical %T values range from 7.5% to 15% for resolving gels, with 4–5% stacking gels. For nucleic acid sequencing, 6–8% denaturing polyacrylamide gels are standard. The pore sizes in polyacrylamide gels (approximately 5–100 nm) are substantially smaller than those in agarose gels, enabling the high-resolution separation of smaller molecules [<a href="#ref-2">2</a>].
Key Difference in Separation Mechanism
Both techniques separate molecules based on size, but the underlying physics differs. In agarose gels, DNA migrates through a relatively open network where larger molecules experience greater frictional resistance, leading to size-dependent mobility. In polyacrylamide gels, the smaller pores create a molecular sieving effect where molecules must deform to pass through the matrix, with smaller molecules migrating faster. For proteins in SDS-PAGE, the sodium dodecyl sulfate (SDS) denatures proteins and imparts a uniform negative charge-to-mass ratio, so separation depends almost entirely on molecular weight [<a href="#ref-2">2</a>]. Native PAGE separates proteins based on both size and native charge.
Materials and Instrumentation Choices
Agarose Gel Electrophoresis Components
Agarose powder is available in various grades: standard (for routine DNA analysis), low-melting-point (for DNA recovery), and high-resolution (for fine fragment discrimination). The choice depends on the application. For most teaching and research applications, standard molecular biology grade agarose is sufficient.
Electrophoresis buffer options include TAE (Tris-acetate-EDTA) and TBE (Tris-borate-EDTA). TAE provides faster migration but lower buffering capacity, making it suitable for short runs. TBE offers higher buffering capacity and better resolution for longer runs or higher voltage applications. The buffer choice affects DNA migration and band sharpness.
DNA stains include ethidium bromide (intercalating, UV-visible, mutagenic), SYBR Safe (less toxic, visible with blue light), and GelRed (high sensitivity, low toxicity). Each requires different visualization equipment.
Power supplies should provide constant voltage (typically 1–10 V/cm for agarose) or constant current. Most standard power supplies (100–300 V, 50–500 mA) suffice.
Gel documentation systems include UV transilluminators (254 nm or 302 nm) with camera systems, or blue light transilluminators for safer stains.
Polyacrylamide Gel Electrophoresis Components
Acrylamide/bis-acrylamide solutions are typically purchased as pre-mixed stock solutions (e.g., 30% acrylamide/0.8% bis-acrylamide for protein gels, or 19:1 ratio for nucleic acid gels). Acrylamide monomer is a neurotoxin and must be handled with appropriate PPE and ventilation.
Polymerization initiators: APS (10% w/v, freshly prepared or stored at 4°C for up to one week) and TEMED (used at 0.05–0.1% v/v). The ratio of APS to TEMED controls polymerization speed.
SDS (for denaturing protein PAGE) is added to both gel and running buffer at 0.1% w/v. SDS binds proteins at approximately 1.4 g SDS per gram protein, imparting uniform negative charge.
Running buffers: Tris-glycine-SDS (for Laemmli SDS-PAGE), Tris-acetate-SDS (for higher molecular weight proteins), or Tris-borate-EDTA-urea (for denaturing nucleic acid gels).
Gel casting apparatus: Mini-gel systems (8 × 10 cm) are standard for rapid analysis; larger formats (16 × 20 cm) provide better resolution for complex samples.
Power supplies for PAGE typically operate at constant current (10–30 mA per gel) or constant voltage (100–200 V). Higher voltages generate heat, which can cause band distortion.
Controls and Standards
Size Markers
Both techniques require molecular weight or size standards run alongside samples. For agarose gels, DNA ladders (e.g., 100 bp ladder, 1 kb ladder) provide reference bands at known sizes. For protein PAGE, pre-stained protein markers (10–250 kDa) allow visual monitoring of migration and size estimation. The choice of marker should match the expected size range of samples. Include at least one lane of marker per gel, ideally on both sides for large gels.
Positive and Negative Controls
Positive controls are samples known to contain the target molecule at a detectable concentration. For DNA analysis, this might be a purified plasmid or PCR product of known size. For protein analysis, a purified protein or cell lysate with well-characterized bands serves this purpose.
Negative controls (no-template controls for PCR, or buffer-only lanes) confirm that observed bands are not artifacts from reagents or contamination. In nucleic acid electrophoresis, a water-only lane processed through the same workflow identifies contamination in reagents.
Loading Controls
For quantitative comparisons, loading controls normalize for variations in sample loading. In protein PAGE, housekeeping proteins (e.g., β-actin, GAPDH) or total protein stains serve this function. For nucleic acid gels, equal loading can be verified by staining total nucleic acid or by including a known amount of an exogenous control.
Conceptual Workflow
Agarose Gel Electrophoresis Workflow
- Prepare gel: Weigh appropriate amount of agarose powder (e.g., 1 g for 1% gel in 100 mL buffer). Add to buffer in a flask. Heat in microwave or on hot plate until agarose dissolves completely (solution becomes clear). Cool to approximately 55–60°C before adding stain if using heat-sensitive dyes.
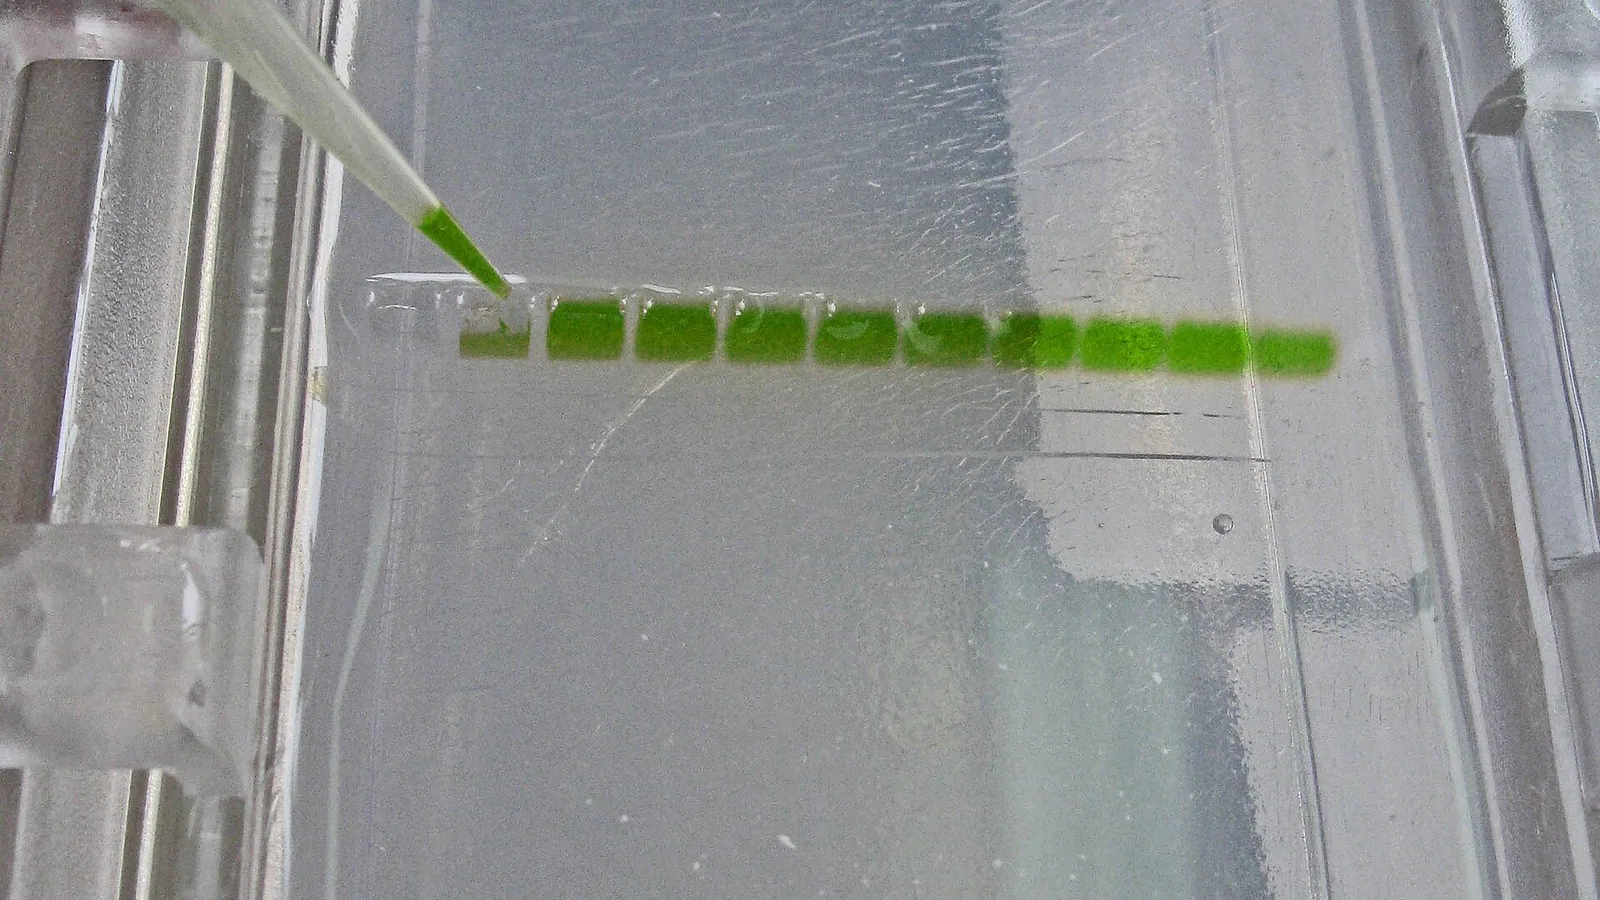
- Cast gel: Seal gel tray ends, place comb at appropriate position, pour molten agarose. Allow to solidify at room temperature (20–30 minutes for standard gels). Remove comb and place gel in electrophoresis tank with buffer covering the gel by 1–2 mm.
- Prepare samples: Mix DNA samples with loading dye (containing glycerol or Ficoll for density, and tracking dyes like bromophenol blue and xylene cyanol). Typical loading volume is 5–20 µL per well.
- Load and run: Load samples and markers into wells. Apply voltage (typically 5–10 V/cm distance between electrodes). Run until tracking dyes reach appropriate position (bromophenol blue migrates with ~300 bp DNA in 1% agarose).
- Visualize: Stain gel (if not pre-stained) with ethidium bromide (0.5 µg/mL for 15–30 minutes) or SYBR Safe (according to manufacturer). Destain in water if needed. Image under UV or blue light.
Polyacrylamide Gel Electrophoresis Workflow
- Assemble casting apparatus: Clean glass plates thoroughly with detergent and ethanol. Assemble with spacers of appropriate thickness (0.75–1.5 mm for protein gels; 0.4 mm for sequencing gels).
- Prepare resolving gel: Mix acrylamide/bis solution, buffer (e.g., 1.5 M Tris-HCl pH 8.8 for SDS-PAGE), SDS (if denaturing), water, APS, and TEMED. Pour between plates, leaving space for stacking gel. Overlay with water or isopropanol to create flat interface. Allow to polymerize (30–60 minutes).
- Prepare stacking gel: After resolving gel polymerizes, remove overlay. Mix stacking gel components (lower acrylamide concentration, e.g., 4–5%, with 0.5 M Tris-HCl pH 6.8). Pour on top of resolving gel, insert comb. Allow to polymerize (20–30 minutes).
- Prepare samples: For SDS-PAGE, mix protein samples with Laemmli buffer (containing SDS, β-mercaptoethanol or DTT, glycerol, bromophenol blue). Heat at 95°C for 5 minutes to denature. Cool before loading.
- Load and run: Remove comb, assemble gel in electrophoresis tank with running buffer. Load samples (10–30 µL per well for mini-gels). Apply constant current (20–30 mA per gel) or constant voltage (150–200 V). Run until dye front reaches bottom.
- Stain and visualize: Remove gel from plates. Stain with Coomassie Brilliant Blue R-250 (0.1% in 40% methanol, 10% acetic acid) for 1 hour, destain overnight. For higher sensitivity, use silver staining or transfer for Western blotting.
Quality Checks
Pre-Run Checks
- Gel uniformity: Inspect for bubbles, uneven polymerization, or cracks. Bubbles in polyacrylamide gels cause distorted bands.
- Buffer integrity: Ensure buffer covers gel completely and is fresh (old buffer may have incorrect pH or conductivity).
- Sample integrity: Check that samples are not degraded (e.g., DNA smearing indicates nuclease contamination; protein degradation shows as multiple low-MW bands).
- Power supply function: Verify voltage and current settings before starting run.
During-Run Monitoring
- Tracking dye migration: Observe dye front position. In agarose gels, bromophenol blue migrates at approximately 300 bp in 1% agarose; xylene cyanol at approximately 4 kb. In SDS-PAGE, bromophenol blue runs at the dye front.
- Current consistency: Current should remain stable. Sudden drops indicate buffer depletion or gel damage.
- Temperature control: Excessive heat (gel feels warm) can cause band distortion or gel melting (agarose). Use lower voltage or cooling if needed.
Post-Run Quality Assessment
- Marker resolution: All marker bands should be visible and well-separated. Missing or smeared bands indicate problems.
- Band sharpness: Bands should be discrete and sharp. Smearing suggests overloading, degradation, or improper running conditions.
- Background staining: Low background indicates proper destaining (Coomassie) or appropriate stain concentration (ethidium bromide).
- Reproducibility: Duplicate samples should show identical band patterns.
Result Interpretation
Size Determination
For both techniques, the distance migrated by each band is measured from the well bottom to the band center. A standard curve is constructed by plotting log molecular weight (for proteins) or log base pairs (for DNA) versus migration distance (Rf value). The Rf is calculated as the distance migrated by the band divided by the distance migrated by the dye front. For agarose gels, a semi-log plot of size versus migration distance typically yields a linear relationship over a limited range. For SDS-PAGE, the relationship between log MW and Rf is linear within the resolving range of the gel percentage.
Band Pattern Analysis
- Single bands indicate homogeneous samples (purified proteins, single PCR products).
- Multiple bands suggest sample complexity (protein mixtures, multiple DNA fragments).
- Smears indicate degradation, overloading, or heterogeneous samples.
- Missing bands may result from insufficient loading, degradation, or failed amplification.
- Extra bands could indicate contamination, non-specific amplification, or post-translational modifications (proteins).
Quantitative Analysis
Densitometry can estimate relative quantities by measuring band intensity. For DNA gels, intensity correlates with DNA amount within a limited range (typically 1–100 ng per band for ethidium bromide). For protein gels, Coomassie staining is linear over approximately 0.1–20 µg per band. Absolute quantification requires standard curves with known concentrations.
Troubleshooting
| Observation | Likely Cause | Discriminating Check |
|---|---|---|
| No bands visible | Failed polymerization (PAGE) | Check APS/TEMED freshness; gel should be firm |
| Insufficient sample loading | Repeat with 2–5× more sample | |
| Stain not working | Test stain on known positive control | |
| Smearing (DNA) | Nuclease contamination | Run fresh sample with EDTA; check water quality |
| Overloaded gel | Reduce sample amount 2–5× | |
| Too high voltage | Reduce voltage; check buffer concentration | |
| Smearing (protein) | Protease activity | Add protease inhibitors; keep samples on ice |
| Insufficient denaturation | Increase heating time/temperature; check reducing agent | |
| Overloaded gel | Reduce protein amount (10–30 µg per lane typical) | |
| Bands too close together | Wrong gel percentage | Increase %T for smaller molecules; decrease for larger |
| Insufficient run time | Continue run until dye front reaches bottom | |
| Buffer problems | Check pH and concentration; use fresh buffer | |
| Bent or smiling bands | Uneven temperature | Reduce voltage; use cooling |
| Gel not fully polymerized | Allow longer polymerization time | |
| Buffer leakage | Check seals and clamps | |
| High background | Overstaining | Reduce staining time or concentration |
| Insufficient destaining | Destain longer with fresh solution | |
| Contaminated reagents | Prepare fresh solutions | |
| Bubbles in gel | Too rapid polymerization | Reduce TEMED or APS concentration |
| Pouring technique | Pour slowly; tap plate to release bubbles | |
| DNA bands faint or absent | UV damage | Use lower UV intensity; minimize exposure |
| Stain not intercalating | Check buffer pH; use fresh stain | |
| DNA degraded | Run on fresh gel with intact control |
Limitations and Considerations
Agarose Gel Limitations
- Resolution: Cannot resolve DNA fragments differing by fewer than 10–50 base pairs, depending on gel concentration and run conditions.
- Protein separation: Not suitable for protein analysis due to large pore size and lack of denaturing capability.
- Heat sensitivity: Low melting point (approximately 65°C) limits use with high voltage or prolonged runs.
- Quantitative accuracy: Densitometry is semi-quantitative; precise quantification requires other methods like qPCR or spectrophotometry.
Polyacrylamide Gel Limitations
- Toxicity: Acrylamide monomer is a neurotoxin and potential carcinogen. Requires careful handling, PPE, and proper waste disposal.
- Preparation complexity: Requires precise mixing and polymerization timing; inconsistent results if not standardized.
- Size range: Limited to molecules below approximately 500 kDa (proteins) or 500 bp (DNA) for standard gels.
- Fragility: Polyacrylamide gels are mechanically weak and easily torn during handling.
- Time: Longer preparation and run times compared to agarose gels.
General Limitations
- Size estimation accuracy: Typically ±5–10% for both methods; precise sizing requires sequencing or mass spectrometry.
- Sample requirements: Both methods require sufficient sample concentration (typically 1–100 ng per band for detection).
- Buffer effects: Running buffer composition and pH significantly affect migration; must be consistent between runs.
Documentation and Record Keeping
Essential Documentation Elements
- Gel composition: Agarose percentage or %T/%C for polyacrylamide, buffer type, additives (SDS, urea, etc.)
- Sample information: Source, concentration, preparation method, loading volume
- Running conditions: Voltage, current, time, temperature
- Marker information: Type, size range, loading amount
- Staining method: Stain type, concentration, incubation time
- Imaging parameters: Exposure time, filter settings, image file name
- Results: Band positions, sizes, intensities, any anomalies
Best Practices
- Label gels with date, experiment name, and orientation (e.g., lane numbers).
- Save original images in uncompressed formats (TIFF preferred) with metadata.
- Maintain laboratory notebooks with detailed protocols and observations.
- Archive gel images with associated sample information in electronic laboratory notebooks.
- Document troubleshooting steps and resolutions for future reference.
Biosafety Considerations
General Laboratory Safety
Both techniques are considered low-risk (BSL-1) when working with non-pathogenic organisms and purified nucleic acids or proteins. Standard microbiological practices apply: wear lab coats, gloves, and eye protection; wash hands after handling samples; disinfect work surfaces before and after use [<a href="#ref-3">3</a>].
Chemical Hazards
Acrylamide monomer is a neurotoxin and should be handled in a fume hood when weighing or preparing solutions. Pre-made solutions reduce exposure risk. Gloves (nitrile) and lab coats are mandatory. Spills should be polymerized (by adding APS and TEMED) before disposal as solid waste.
Ethidium bromide is a mutagen and should be handled with gloves. Solutions should be decontaminated (e.g., activated charcoal filtration or chemical degradation) before disposal. Alternative stains (SYBR Safe, GelRed) have lower toxicity profiles.
SDS is a respiratory and skin irritant; avoid inhalation of powder.
Biological Safety
When working with biological samples (cell lysates, tissue extracts, microbial cultures), follow institutional biosafety guidelines. For teaching laboratories, use only BSL-1 organisms (e.g., E. coli K-12 strains) and non-infectious samples [<a href="#ref-3">3</a>]. For recombinant DNA work, follow NIH Guidelines for Research Involving Recombinant or Synthetic Nucleic Acid Molecules [<a href="#ref-4">4</a>].
Waste Disposal
- Agarose gels: Can be disposed as solid waste after decontamination (if containing ethidium bromide, treat as hazardous waste).
- Polyacrylamide gels: Dispose as solid chemical waste; do not incinerate (acrylamide may release toxic fumes).
- Staining solutions: Collect and dispose according to institutional hazardous waste protocols.
- Contaminated materials: Autoclave before disposal if biological contamination is suspected.
Frequently Asked Questions
1. Can I use agarose gels for protein separation?
Agarose gels are generally not suitable for protein separation because their large pore size provides insufficient sieving for most proteins (5–250 kDa). Proteins would migrate rapidly without adequate size discrimination. However, very high molecular weight proteins (>500 kDa) or protein complexes can sometimes be resolved on low-percentage agarose gels (0.5–1%) under native conditions. For routine protein analysis, polyacrylamide gels are the standard choice.
2. Why do my DNA bands appear as a smear instead of discrete bands?
DNA smearing typically results from one of three causes: (1) nuclease contamination degrading the DNA during sample preparation or electrophoresis, (2) overloading the gel with too much DNA (more than 100 ng per band for ethidium bromide detection), or (3) running the gel at too high voltage, causing excessive heating and diffusion. Check sample integrity on a fresh gel with reduced loading and lower voltage. Use fresh buffer and ensure all solutions contain EDTA to inhibit nucleases.
3. What gel percentage should I use for separating 500 bp and 600 bp DNA fragments?
For separating fragments differing by 100 bp in the 500–600 bp range, a 2–3% agarose gel provides adequate resolution. Alternatively, a 6–8% polyacrylamide gel offers superior resolution (single-base discrimination) but requires more preparation time. For agarose, use a high-resolution grade agarose and run at low voltage (3–5 V/cm) for optimal separation. Include appropriate size markers to confirm resolution.
4. How do I choose between native and denaturing PAGE for protein analysis?
Choose denaturing SDS-PAGE when you need to determine protein molecular weight, analyze subunit composition, or separate proteins based solely on size. SDS denatures proteins and masks native charge differences. Choose native PAGE when you need to preserve protein native structure, enzyme activity, or protein-protein interactions. Native PAGE separates based on both size and charge, so molecular weight estimation is less accurate. For most routine protein analysis, SDS-PAGE is the standard method.
Related Clinical & Scientific Guides
- Loop-Mediated Isothermal Amplification (LAMP) Assay for Rapid Detection of African Swine Fever Virus in Oral Fluids
- How to Calculate the Concentration of Protein Using the Lowry Assay
- DNA Extraction from Saliva: Non-Invasive Sampling and Protocols
References and Further Reading
[1] **Methods for Determining the High Molecular Weight of Hyaluronic Acid: A Review** – López-Cánovas AE, Victoria-Sanes M, Martínez-Hernández GB, López-Gómez A. (2025). *PubMed*. Discusses agarose gel electrophoresis as one of three primary methods for molecular weight determination of high molecular weight biopolymers, including gel matrix optimization and calibration strategies. [https://pubmed.ncbi.nlm.nih.gov/41470963/](https://pubmed.ncbi.nlm.nih.gov/41470963/) [2] **Homology Analysis of *Polistes dominula* and *Vespula* spp. Venoms: A Comparative In Vitro and In Silico Study** – Morales M, Jordá Marín A, Cases B, et al. (2026). *PubMed*. Illustrates SDS-PAGE application for protein profiling of venom extracts, demonstrating high-resolution separation of allergenic proteins (phospholipase, hyaluronidase) with subsequent LC-MS/MS identification. [https://pubmed.ncbi.nlm.nih.gov/42043054/](https://pubmed.ncbi.nlm.nih.gov/42043054/) [3] **Biosafety in Microbiological and Biomedical Laboratories (BMBL), 6th Edition** – CDC and NIH. (2020). *U.S. Department of Health and Human Services*. Authoritative guidelines for risk assessment, containment, and safe laboratory practices applicable to gel electrophoresis procedures. [https://www.cdc.gov/labs/bmbl/index.html](https://www.cdc.gov/labs/bmbl/index.html) [4] **NIH Guidelines for Research Involving Recombinant or Synthetic Nucleic Acid Molecules** – National Institutes of Health. *NIH Office of Science Policy*. Framework for biosafety considerations when analyzing recombinant DNA by gel electrophoresis. [https://osp.od.nih.gov/policies/biosafety-and-biosecurity-policy/nih-guidelines-for-research-involving-recombinant-or-synthetic-nucleic-acid-molecules/](https://osp.od.nih.gov/policies/biosafety-and-biosecurity-policy/nih-guidelines-for-research-involving-recombinant-or-synthetic-nucleic-acid-molecules/) [5] ***Rehmannia glutinosa* nanovesicles protect cardiomyoblasts from oxidative injury** – Fan H, Zhao S, Di Y, et al. (2026). *PubMed*. Demonstrates use of agarose gel electrophoresis for nucleic acid analysis in plant-derived nanovesicle characterization, alongside Coomassie staining for protein analysis. [https://pubmed.ncbi.nlm.nih.gov/42148289/](https://pubmed.ncbi.nlm.nih.gov/42148289/) [6] **NCBI Bookshelf: Molecular Biology and Laboratory Methods** – National Center for Biotechnology Information. Comprehensive collection of authoritative methods references for molecular biology techniques including gel electrophoresis. [https://www.ncbi.nlm.nih.gov/books/](https://www.ncbi.nlm.nih.gov/books/)Related Articles
- Agarose Gel Electrophoresis of DNA: Principles and Protocol
- Native Polyacrylamide Gel Electrophoresis: Principles and Applications
- RNA Gel Electrophoresis: Denaturing Agarose Gel Protocol for RNA Integrity Check
- Contamination Controls in Agarose Gel Electrophoresis: Sources, Prevention, and Detection
- Gel Electrophoresis Buffer Systems: TAE vs TBE for DNA Separation
- How to Calculate the Resolution of Gel Electrophoresis