How to Set Up a Water Testing QC Schedule
By Dr. Zubair Khalid, DVM, MS, PhD ·
By the end of this article you will be able to build a complete quality control (QC) schedule for a water microbiology laboratory. That schedule will cover media sterility and performance checks, daily analytical controls, equipment verification, sample holding time limits, and an external proficiency testing (PT) calendar. You will also have a fill-in template, a worked control chart calculation, and a troubleshooting table for the QC failures that show up most often at the bench.
To build the schedule you need on hand:
- Your current method documents (membrane filtration, enzyme substrate, or most probable number, abbreviated MPN), ideally aligned with APHA Standard Methods procedures, which are the analytical backbone of many drinking water programs [1]
- A list of every instrument that touches a sample or a culture (autoclave, incubators, water baths, balances, pipettes, biosafety cabinet)
- Certified reference cultures, for example E. coli ATCC 25922 as a positive control and a non-target organism such as Enterobacter spp. for selectivity checks
- A logbook or a laboratory information management system (LIMS) where every QC result lands with a date, a lot number, an analyst, and an acceptance decision
- Enrollment in an external quality assessment (EQA) program. EQA providers accredited to ISO/IEC 17043 send blinded samples of unknown concentration so you can compare your results against peer laboratories. Proficiency Testing Canada and the Canadian Microbiological Proficiency Testing program, both accredited to ISO/IEC 17043, run drinking water challenges twice per year, which is a reasonable baseline frequency for any water lab [2]
Why a Written QC Schedule Matters
Water results drive public health decisions. A boil water advisory, a school closure, or a treatment plant adjustment can all trace back to a single laboratory number, so the number has to be defensible. Large surveillance programs show why rigor at the bench matters. In a nationwide review of drinking water compliance in Bhutan covering more than 35,000 samples across 20 districts, only 52.8 percent of urban samples met the microbial standard of 0 CFU per 100 mL, and residual chlorine compliance was critically low at 11.9 percent, leading the authors to call for standardized testing methodology and audited quality systems [3]. Routine testing in schools in Belize found coliforms in samples from 66 percent of schools tested, findings that the authors tied directly to the value of routine monitoring for triggering timely public health responses [4].
Those numbers are only as good as the QC behind them. A well-designed schedule is the practical core of microbiology quality control because it converts broad quality management intent into dated, assigned, verifiable tasks. The same logic underlies modern wastewater and environmental surveillance frameworks, which integrate quality management system (QMS) principles across sample collection, laboratory analysis, data interpretation, and reporting to ensure reliability and cross-site comparability [5].
Step 1: Define Scope, Methods, and Parameters
Before assigning any frequency, list what you test and how. A typical drinking water or environmental water microbiology panel includes:
- E. coli and total coliforms by membrane filtration or enzyme substrate method
- Fecal enterococci
- Heterotrophic plate count (HPC)
- Somatic coliphages as an operational parameter. Directive (EU) 2020/2184 added somatic coliphage testing of raw water to monitor treatment effectiveness, and the International Organization for Standardization publishes the method as ISO 10705-2. In one Polish assessment, somatic coliphages appeared in 89 percent of surface water intake samples but in none of the treated water samples, demonstrating how a QC-relevant operational parameter behaves when treatment is working [6]
Write the scope down with the exact method reference, the reporting unit (CFU per 100 mL, MPN per 100 mL, or plaque-forming units per 100 mL), and the decision limit that triggers action. A sanitary survey approach, walking the treatment train from intake through each sampling point station to distribution, helps you decide which parameters belong at which sites, which is the model used in the Perak, Malaysia drinking water assessment built on APHA testing procedures [1].
Step 2: Build the QC Event Inventory
A water testing QC schedule microbiology format has four layers. Enumerate every event in each layer before you assign dates.
- Media and reagent QC. Every batch and lot of media, buffered dilution water, and reagent gets a sterility check and a performance check before use.
- Analytical run QC. Every batch of samples gets a positive control, a negative control, and a filtration blank.
- Equipment QC. Incubators, autoclaves, baths, balances, and pipettes each get verification on a defined cycle.
- External QC. Proficiency testing on a fixed calendar, typically twice yearly for drinking water microbiology [2].
Step 3: Assign Frequencies and Acceptance Criteria
This table is the skeleton of your schedule. Adapt frequencies to your accreditation body and method standard, but never let a batch of media reach the bench unverified.
| QC event | Frequency | Acceptance criterion (typical) | Record kept |
|---|---|---|---|
| Media sterility check (incubate 2 to 5 percent of batch, or at least 2 units) | Every media batch | No growth after full incubation | Media batch log |
| Media performance (positive and negative control strains) | Every media batch | Expected growth, colony morphology, and selectivity reactions | Media batch log |
| Buffered water sterility | Every lot | No growth | Reagent log |
| Filtration blank per run | Every filtration run | 0 CFU on target media | Run record |
| Positive control per run | Every analytical run | Growth within lab-established recovery range | Run record and control chart |
| Incubator temperature mapping | Daily working check, full mapping at installation and annually | Within method tolerance, for example 35 ± 0.5 °C or 44.5 ± 0.5 °C | Equipment log |
| Autoclave cycle verification | Every cycle (physical), weekly or per load (biological with Geobacillus stearothermophilus spore strips) | Spore strips show no growth at 121 °C, 15 min reference cycle | Sterilization log |
| Balance check with certified weights | Daily before use | Within manufacturer tolerance | Equipment log |
| Pipette or dispenser calibration | Quarterly gravimetric | Within manufacturer specification | Calibration record |
| Biosafety cabinet certification | Annually and after relocation | Meets certification standard | Certificate on file |
| Proficiency testing | Twice per year is a workable baseline for drinking water [2] | Results within assessment limits of the EQA provider | PT report and investigation file |
| QC schedule review | Annually, and after any method change | Documented review and signature | Management review record |
Step 4: Media and Reagent QC With a Worked Example
Media QC is where most water labs either shine or quietly fail. Every batch gets three checks.
Sterility. Incubate a defined fraction of the batch, commonly 2 to 5 percent with a minimum of two plates or tubes, under the same conditions samples will see. Any growth fails the whole batch.
pH. Measure pH of a representative unit at room temperature. Agar media drift by roughly 0.2 to 0.3 units between formulation pH and the set agar, so compare against the method specification, not the bottle label.
Performance. Inoculate your positive control strain and a negative or selectivity strain. For a chromogenic coliform agar, E. coli ATCC 25922 must produce the expected target colony color and Enterobacter spp. must show the expected non-target reaction, which mirrors the paired organism design used in drinking water proficiency challenges [2].
A media batch log entry looks like this:
MEDIA BATCH LOG
Batch ID: CCA-2026-014
Medium: Chromogenic coliform agar, 90 mm plates
Prepared: 2026-03-04   Analyst: J.R.   Lot of dehydrated base: LT-8842

Sterility check: 3 plates incubated 24 h at 36 ± 1 C
  Result: 0/3 plates with growth ............... PASS

pH check: 7.2 measured at 25 C
  Specification: 7.1 to 7.3 .................... PASS

Performance check:
  E. coli ATCC 25922   growth: yes   color: dark blue-violet ... PASS
  Enterobacter spp. (in-house strain)  color: pale/non-target ... PASS

Decision: BATCH RELEASED for sample testing     Signed: J.R.  Date: 2026-03-05
If any check fails, quarantine the batch, label it FAILED, and investigate. Never re-work a failed sterility check by re-incubating longer.
Step 5: Analytical Run Controls
Every batch of water samples carries its own controls.
- Filtration blank. Filter 100 mL of sterile buffered water through a fresh membrane before sample filtration. Any target colony means contamination somewhere in the filtration train, and the run is invalid.
- Positive control. A culture of the target organism processed through the full method. Track recovery over time on a control chart (Step 8).
- Negative or selectivity control. A non-target organism, such as an Enterobacter strain, to confirm the medium and confirmatory steps exclude organisms correctly.
- Duplicate or split samples. A defined percentage of routine samples, for example 5 to 10 percent, analyzed in duplicate to monitor repeatability.
For molecular additions to the panel, such as viability PCR for detecting live Legionella in building water, the same discipline applies. A recently described photoactivation-free viability PCR reagent selectively crosslinks DNA from non-viable cells so it cannot amplify, and its optimization parameters included reagent concentration, amplicon length, and workflow format, which are exactly the variables your molecular QC schedule must lock down and monitor [7].
Step 6: Holding Time QC
Sample integrity is a QC parameter, not a convenience. Fecal indicator bacteria change concentration in the bottle, and the rate of change depends on water type, temperature, and handling. In a controlled trial with river water and post-irrigation canal water held from 0 to 216 hours, canal water samples kept E. coli and fecal coliform concentrations similar to baseline for at least 72 hours under controlled cold storage near 4 °C, at least 48 hours under changing cold-to-ambient conditions, and at least 30 hours under controlled ambient conditions near 21 °C, while river water samples were less stable [8].
Build these rules into your schedule:
- Transport on ice or in a cooler validated to hold samples near 4 °C.
- Record collection time and analysis time on every chain of custody entry. Holding time violations are among the most common and most avoidable QC failures.
- Set your internal working target at 8 hours from collection to analysis, the standard working expectation for microbiological water samples, with a documented absolute ceiling consistent with your method standard. If field logistics make that impossible for a site, validate and document a longer limit for that matrix rather than guessing.
Step 7: The External Proficiency Testing Calendar
Internal QC proves your method is behaving. Proficiency testing proves your laboratory gets the right answer relative to the outside world. Participation in EQA is a necessary risk management resource for environmental microbiology laboratories, and programs accredited to ISO/IEC 17043 have run drinking water PT challenges twice per year since 1996, with each challenge consisting of four samples containing unknown concentrations of E. coli and Enterobacter spp. A cross-sectional study of 150 Canadian rural and metropolitan laboratories assessed participant accuracy based on the testing method used and accreditation status, which is the same comparison your laboratory will face when your PT report arrives [2].
Schedule PT like this:
- Choose an ISO/IEC 17043-accredited provider whose challenges cover your full scope.
- Book both challenge rounds at the start of the year, with the samples routed through your normal sample reception, so PT exercises the real workflow including holding time handling.
- Treat PT samples as routine samples run by the analyst who would normally handle them. Running PT with your best analyst on your best day defeats the purpose.
- Log results, compare against assigned values, and open a corrective action file for any unsatisfactory result.
A practical annual PT calendar entry:
ANNUAL QC CALENDAR (excerpt)

Month    Event
Jan      Review previous year PT reports, closeout of any corrective actions
Feb      Equipment calibration certificates due (balance, pipettes)
Mar      PT Round 1 (2-sample shipment expected)
Apr      PT Round 1 results review at staff meeting
Jun      Incubator annual temperature mapping and uniformity study
Aug      PT Round 2
Sep      PT Round 2 results review
Oct      Internal audit of media batch logs and run records
Nov      Management review of QC schedule, update frequencies
Dec      Trend review of all control charts, next-year calendar issued
Step 8: Control Charts and Worked Calculation
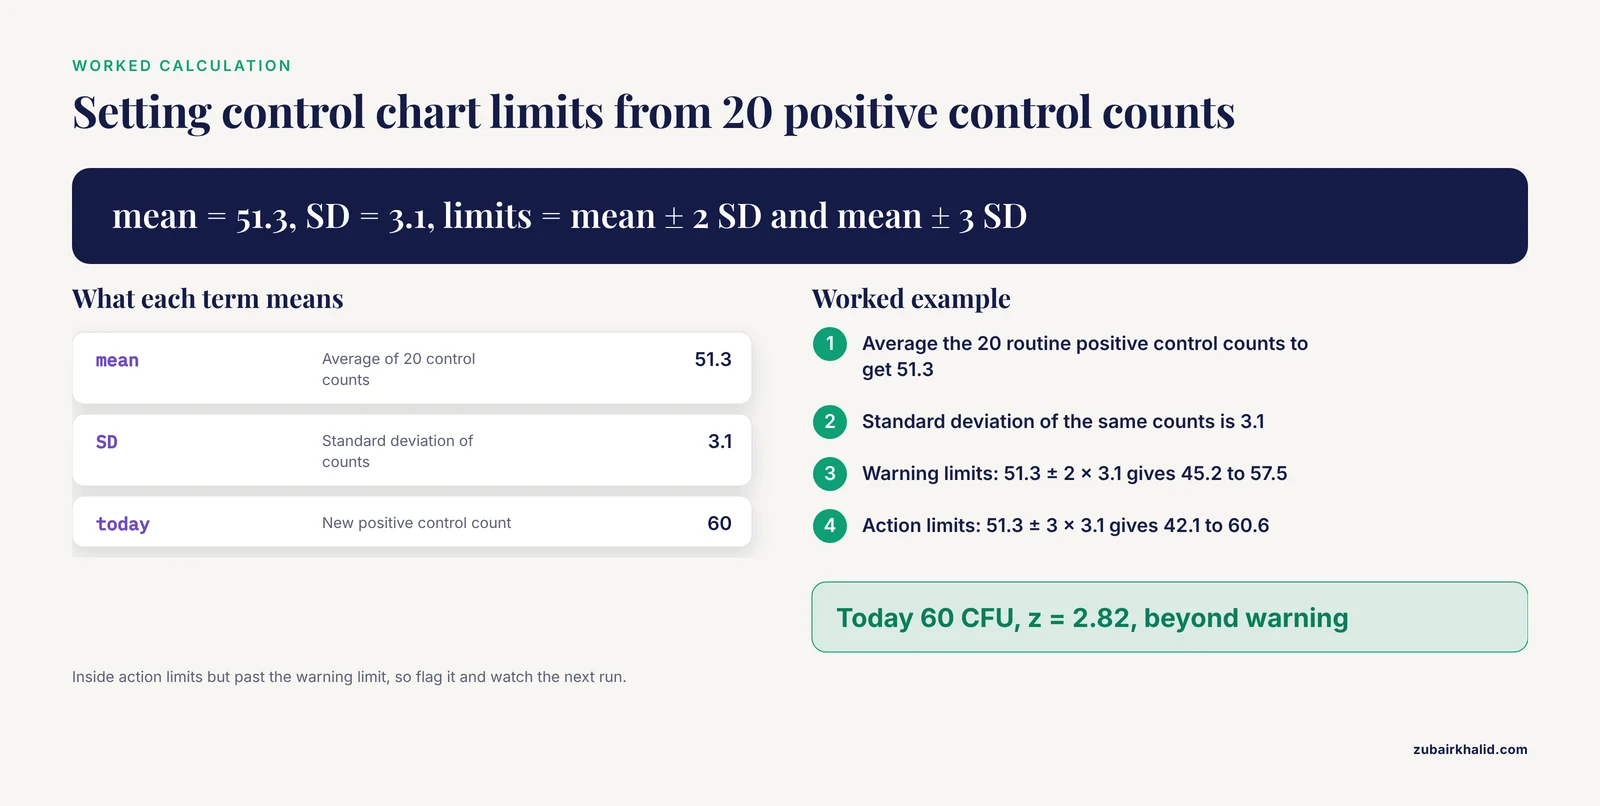
A control chart turns a stream of QC results into a decision. For each controlled quantity, for example positive control recovery on membrane filtration, collect at least 20 results under routine conditions, compute the mean and standard deviation, and set the center line, warning limits at plus or minus 2 standard deviations, and action limits at plus or minus 3 standard deviations.
Here is a worked calculation in Python for a positive control count series in CFU per plate:
# Positive control recovery, E. coli ATCC 25922, CFU per membrane
counts = [52, 48, 55, 51, 49, 53, 47, 50, 54, 52,
          46, 51, 58, 49, 53, 50, 47, 52, 55, 50]

import statistics
mean = statistics.mean(counts)
sd = statistics.stdev(counts)

print(f"mean  = {mean:.1f}")
print(f"SD    = {sd:.1f}")
print(f"warning limits = {mean - 2*sd:.1f} to {mean + 2*sd:.1f}")
print(f"action limits  = {mean - 3*sd:.1f} to {mean + 3*sd:.1f}")

# Today's new QC result
today = 60
z = (today - mean) / sd
print(f"today = {today}, z = {z:.2f}")
Expected output:
mean  = 51.3
SD    = 3.1
warning limits = 45.2 to 57.5
action limits  = 42.1 to 60.6
today = 60, z = 2.82
Today's result of 60 CFU falls inside the action limits but beyond the upper warning limit. The correct response is not to reject the run on one point but to flag it, check the control culture passage and media lot, and watch the next run. Two consecutive results beyond warning limits, or any single result beyond action limits, stops the run.
Plot the chart itself in the LIMS or on the wall. A chart nobody looks at is a record, not a control.
Step 9: Documentation, Data Integrity, and Review
Every QC event produces a record that must contain the date, the lot or instrument identifier, the analyst, the result, the acceptance criterion, and a signature or electronic equivalent. If your monitoring system allows missing or unreviewed data, your QC conclusions inherit that weakness. Missing data is a recognized threat to the reliability of water monitoring programs, and structured handling approaches, including systematic imputation validated against measured values, have been shown to materially improve the accuracy of downstream water quality analysis in large environmental datasets [9].
Close the loop with scheduled review:
- Weekly. Supervisor reviews run records and blanks from the prior week.
- Monthly. Review control charts, equipment logs, and media batch logs for overdue events.
- Quarterly. Review holding time compliance and any corrective actions still open.
- Annually. A management review of the whole schedule, updating frequencies where failures cluster. Modern quality frameworks for environmental and wastewater surveillance explicitly position the laboratory workflow inside a unified, quality-managed operational architecture spanning collection, analysis, interpretation, and reporting [5].
Water Testing QC Schedule Template
Copy this template and replace the bracketed fields. It is deliberately terse so it fits on one page at the bench.
WATER MICROBIOLOGY QC SCHEDULE - [LAB NAME] - Version [x] - Effective [date]

1. MEDIA QC
   For every batch of [medium name]:
     - Sterility: incubate [n] units, [conditions] -> 0 growth required
     - pH at 25 C: [range] required
     - Performance: [positive strain] and [negative strain], [criteria]
   Responsible: [title]   Record: form [ID]

2. RUN QC
   Every filtration run: 1 filtration blank (0 CFU required)
   Every run: positive control [strain] within control chart limits
   Every confirmatory step: negative selectivity control [organism]
   Duplicates: [percent] of routine samples per week
   Responsible: [title]   Record: form [ID]

3. EQUIPMENT QC
   Incubator [ID]: daily min/max temp, tolerance [range]
   Autoclave [ID]: every cycle physical check, [frequency] spore strip
   Balance [ID]: daily check weight [value], tolerance [range]
   Pipettes: quarterly gravimetric calibration
   BSC: annual certification
   Responsible: [title]   Record: form [ID]

4. SAMPLE INTEGRITY
   Transport temp: [range], cooler validation every [interval]
   Holding time target: 8 h from collection to analysis
   Violations: log, investigate, and report affected results

5. PROFICIENCY TESTING
   Provider: [name], ISO/IEC 17043 accredited
   Rounds per year: [3]
   Analyst: rotate through routine roster
   Unsatisfactory result: root cause analysis within [n] days

6. REVIEW
   Weekly: run record review     Monthly: charts and logs
   Quarterly: open CAPA list     Annual: schedule revision
This single page, filled in with your specifics, is the water testing QC schedule microbiology template most assessors expect to see during an audit, backed by the filled-in records it points to.
Common Mistakes and Limitations
- New media reaches the bench before QC finishes. Sterility and performance checks take the same incubation time as a sample run. Plan batches ahead of demand or maintain a released-batch buffer stock.
- The filtration blank is skipped when the bench is busy. The blank is the only thing that catches contaminated filtration apparatus mid-run. An unblanked run cannot be defended if results are questioned.
- Positive controls are run only when something goes wrong. A control run after a failure tells you nothing about the failing run. Controls ride with every run.
- Holding time is measured from arrival at the lab. The clock starts at collection. Record both times, and remember that stability is matrix dependent, with river water generally less stable than eutrophic canal water under the same cold storage [8].
- PT is treated as a test of the analyst rather than of the system. Route proficiency samples through the normal chain. The evidence from large PT programs is that accuracy varies with testing method and accreditation status across laboratories, so the system, not just the person, is being assessed [2].
- Failed QC results are recorded but never trended. A single failed blank is an event. Three in a month is a system problem. Trend everything.
- Frequencies are copied from another laboratory without justification. Frequencies must match your method standard, your accreditation requirements, and your own failure history, which is why the annual review step exists. Risk-based management, applied to the whole water safety cycle rather than to the lab in isolation, is the direction modern surveillance guidance recommends [3].
- Limitation. Individual method standards, accreditation bodies, and jurisdictions specify exact tolerances, incubation conditions, and holding time ceilings that may differ from the typical values shown here. Confirm every acceptance criterion against the edition of the method standard your laboratory is accredited to, and consult your quality manager or accreditation body for anything ambiguous.
Frequently Asked Questions
How often should I run positive and negative controls in water microbiology?
Run a positive control and a negative selectivity control with every analytical run, and repeat performance testing whenever a new media batch or a new control culture lot enters use.
What goes into a water testing QC schedule template?
Five blocks: media and reagent QC, per-run analytical controls, equipment verification with dates, sample holding time rules, and the proficiency testing calendar, each with a named responsible person and a record form.
How do I choose a proficiency testing provider?
Choose a provider accredited to ISO/IEC 17043 whose drinking water challenges cover your full scope of accredited methods, then book both annual rounds in advance and route the samples through your normal workflow [2].
What acceptance criteria should I use for media QC?
Sterility means no growth on the checked units, pH must fall within the method specification at 25 °C, and performance means the positive control shows expected growth and target reactions while the negative strain is correctly excluded or shows the expected non-target reaction.
How long can I hold water samples before analysis?
Use 8 hours from collection as the working target, keep samples near 4 °C, and know your matrix, because controlled trials show fecal indicator stability can extend to roughly 72 hours under cold storage in some waters while other waters are less stable [8].
What do I do when a QC result fails?
Stop reporting results from the affected run, quarantine affected media or samples, document the failure, perform a root cause analysis, apply corrective action, and re-run with passing QC before results leave the laboratory.
Do I need proficiency testing if I already run internal QC?
Yes, because internal QC shows your method is internally consistent while proficiency testing shows your answers match peer laboratories, and external quality assessment is recognized as a necessary risk management resource for environmental microbiology laboratories [2].
How do I control-chart microbiology QC data?
Collect at least 20 routine results for the controlled quantity, calculate the mean and standard deviation, set warning limits at plus or minus 2 standard deviations and action limits at plus or minus 3, plot every new result against those limits, and respond to two consecutive warning limit breaches or any action limit breach.
Sources
- From tap to table: An assessment of drinking water quality in Perak, Malaysia.
- Improving drinking water quality through proficiency testing-the impact of testing method and accreditation status on Escherichia coli detection by Canadian environmental testing laboratories.
- Drinking water quality surveillance in Bhutan: trend and compliance (2017-2024).
- Assessment of Water Quality among Handwashing and Drinking Water Stations in Schools in Belize, 2022.
- Toward a quality-managed operational architecture for wastewater surveillance of zoonotic and emerging pathogens.
- Assessment of occurrence of somatic coliphages in drinking water in Poland.
- A photoactivation-free viability PCR reagent for rapid, culture-independent detection of live bacteria.
- Evaluation of fecal indicator bacteria concentration in different water sources, storage treatments, and holding times.
- Enhancing water quality prediction for fluctuating missing data scenarios: A dynamic Bayesian network-based processing system to monitor cyanobacteria proliferation.