Building a Proficiency Testing Schedule for Your Microbiology Lab
By Dr. Zubair Khalid, DVM, MS, PhD ·
By the end of this guide you will be able to build a complete 12-month proficiency testing (PT) calendar for a clinical microbiology laboratory. You will map every assay on your menu to a PT mechanism, set event dates with named owners, write grading rules before samples arrive, and have a remediation pathway ready for the event that goes badly. You will also have a reusable scheduling template you can regenerate each year in minutes.
Four things should be on hand before you start:
- Your current test menu, with the method used for each assay.
- Your accreditation and licensure requirements, which set the minimum event frequency for regulated analytes.
- The PT catalog of your provider, for example the College of American Pathologists (CAP) Surveys program, so you can match enrollment deadlines.
- A spreadsheet, or Python with pandas installed, for the template in this article.
Proficiency testing, also called external quality assessment (EQA), is the periodic analysis of samples whose true content is known to the sender but hidden from the analyst, run through the laboratory's normal workflow and graded against peer laboratories or a reference standard. Scheduling it well matters because PT is the only routine check that exercises the entire process, from specimen handling to the final report, with an outside referee. Accreditation criteria treat it that way. A review of whole-genome sequencing (WGS) implementation in diagnostic microbiology notes that laboratories must adhere to national and international accreditation criteria, and that quality control (QC) for sequencing includes proficiency testing [1].
What Proficiency Testing Is and Where It Fits in Laboratory Quality Management
Three related terms define the quality structure of a microbiology laboratory:
- Quality control (QC) is internal material run alongside patient specimens in every run or batch. It catches drift in real time, but only within the conditions of that run.
- Proficiency testing (PT) is the periodic, blinded, external check described above. It samples performance across operators, reagent lots, and reporting steps.
- A laboratory quality management system (QMS) is the documented framework of policies, procedures, records, and reviews that holds both of these, plus training, document control, and corrective action, in one structure.
PT is one layer of microbiology quality control that internal controls cannot replace, for two reasons. First, much of microbiology is interpretation. A Gram stain quantitation, a colony morphology read, a matrix-assisted laser desorption ionization time-of-flight (MALDI-TOF) identification confirmation, and an antimicrobial susceptibility category call all involve judgment. Internal QC material travels with the instrument, while PT travels through the analyst. Second, PT detects systematic errors that persist across runs, such as a systematic misreading of a susceptibility table, which a daily control can pass while patients are still affected.
The effect of structured PT plus accreditation requirements is measurable. In flow cytometry minimal residual disease (MRD) testing, the measurement of tiny numbers of leftover leukemia or myeloma cells after treatment, heterogeneity across laboratories was documented in 2014. Accreditation checklist items then began requiring documentation of the sensitivity determination method and inclusion of the lower limit of detection (LLOD), the lowest amount of target a method reliably detects, in final reports. A follow-up survey distributed through CAP's FL3 PT survey to 548 subscribed laboratories found that participation in the accreditation program was associated with decreased variability [2].
PT also belongs on the same dashboard as the other performance measures a laboratory already tracks. A regional centralized malaria diagnostic service in Calgary monitored PT results continuously alongside preanalytic and analytic turnaround times, test accuracy, and clinical relevance, and its expert microscopists matched polymerase chain reaction (PCR) at identifying the Plasmodium species even though PCR was more sensitive at detecting the parasite's presence [3]. That is the point of PT in microbiology. It grades the human and the instrument together.
How to Schedule Proficiency Testing in a Microbiology Lab: The Seven-Step Process
This section walks through the seven steps of building the schedule. Each step produces an artifact that goes into the QMS file: a mapped inventory, a frequency table, panel specifications, a grading key, event records, remediation reports, and the calendar itself.
Step 1. Inventory the Test Menu and Map Every Assay to a PT Mechanism
List every assay your laboratory reports, grouped by bench: bacteriology culture and identification, antimicrobial susceptibility testing (AST), mycology, mycobacteriology including acid-fast bacillus (AFB) smears, parasitology including malaria smears, virology antigen and nucleic acid amplification tests (NAAT), molecular panels, and any sequencing or genotyping service. For each assay, record the method and the dominant error mode. An error mode is the way the assay fails in practice: a wrong species call, a wrong susceptible or resistant category, a missed low-positive smear, or an incomplete genome assembly.
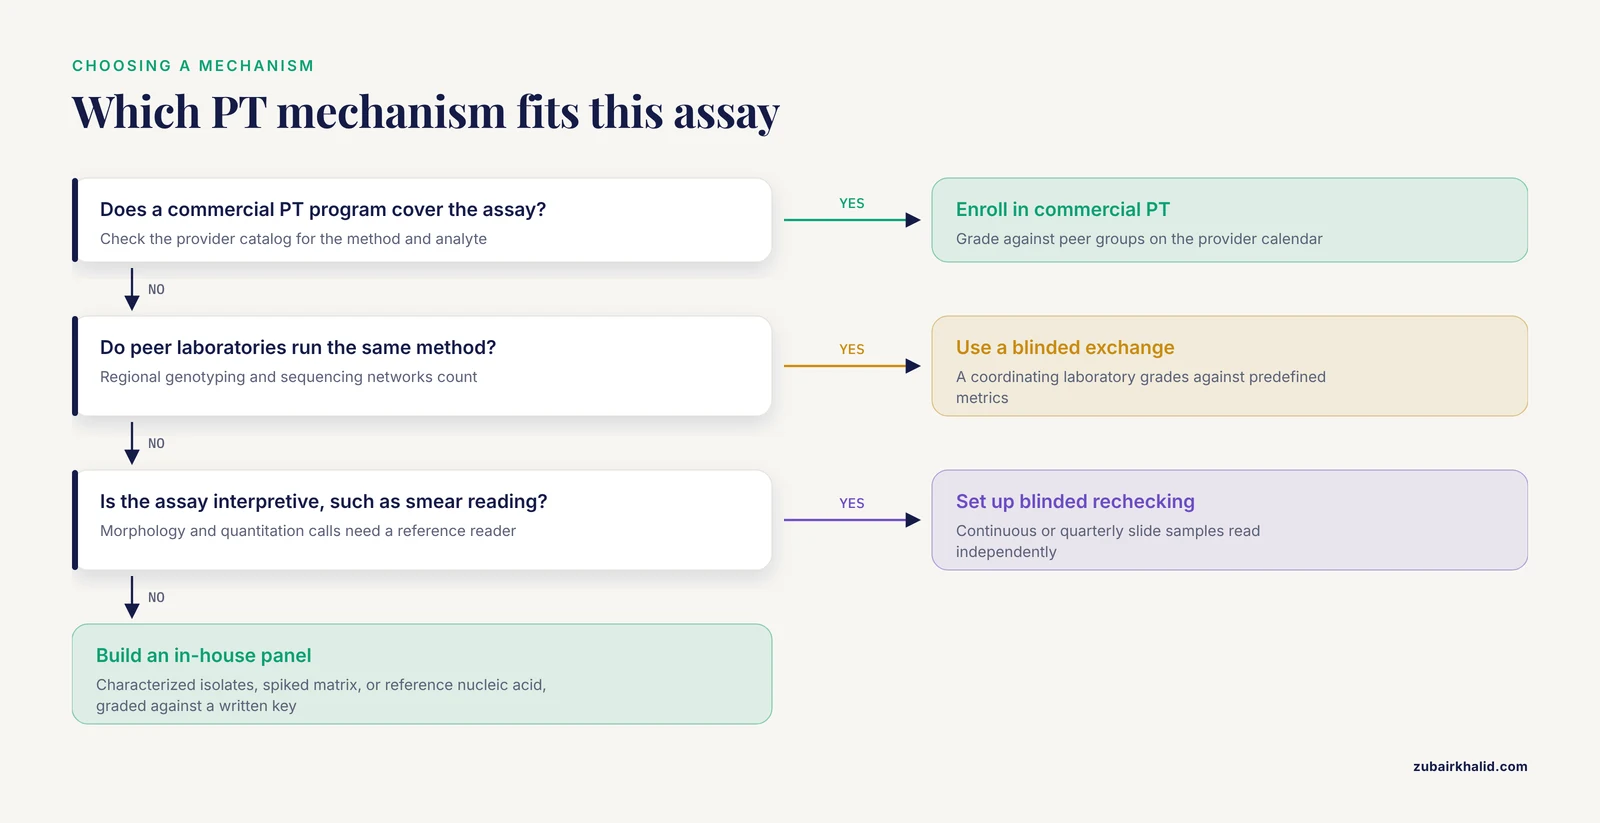
Then assign each assay to one of five mechanisms.
| Mechanism | Best suited for | Typical cadence | Who grades |
|---|---|---|---|
| Commercial interlaboratory PT | Regulated and moderate to high volume assays with an available survey | Three events per year for regulated analytes under CLIA | The provider, against peer groups |
| In-house prepared panel | Assays with no commercial program, such as special cultures, platelet bacterial screening, or genotyping | One to two events per year | Your laboratory, against a written key |
| Blinded recheck | Smear microscopy and morphology | Continuous or quarterly slide samples | A reference reader or senior microscopist |
| Blinded interlaboratory exchange | WGS and regional genotyping networks | One to two events per year | The coordinating laboratory, against predefined metrics |
| Retrospective blinded audit | Rare send-out methods with no peers | Annual | Your laboratory, against original validated results |
Two examples show what the mapping looks like in practice. Commercial programs exist at scale for molecular analytes: the CAP molecular oncology PT program processed 6,897 total responses across 35 samples interrogating 13 variants plus wild-type sequences for the BRAF, EGFR, and KRAS genes, and graded performance by assay method [4]. Where no commercial program covers an assay, networks build their own. Japan's external quality assessment program for HIV-1 drug-resistance testing distributed a panel built from in vitro transcribed RNA to 11 laboratories [5], and a public health network covering one New Zealand and 14 Australian laboratories built a SARS-CoV-2 WGS proficiency testing program from characterized isolates [6].
For each mapping, write down the mechanism, the provider or source of material, the planned cadence, and the owner. That record is the input to the scheduling template later in this article.
Step 2. Set Frequencies and Anchor Dates
In the United States, the Clinical Laboratory Improvement Amendments (CLIA) set the regulatory baseline: regulated analytes are tested in three events per year, with five samples per event, and each event is graded against the pass rate set for that analyte, 80 percent for most. Non-regulated assays follow a risk-based cadence, at least annually, and more often when the assay is new, high volume, or high consequence. Network programs such as the SARS-CoV-2 WGS proficiency testing program ran annual rounds, in 2021 and 2022, and used the repeat rounds to tighten assessment [6].
Three scheduling rules keep the calendar realistic:
- Anchor commercial events to the provider's mailing calendar. Providers set ship dates and result return deadlines, and enrollment closes months before the ship date. Enroll as soon as catalogs open.
- Spread in-house events across quarters. Four quarterly events beat one annual marathon, because a failure found in March still leaves nine months to fix and re-verify.
- Protect lead time. In-house panels need four to eight weeks between preparation and testing for stability work, and every event needs a named owner and a deputy before the date is fixed.
Avoid scheduling events during known leave peaks, and rotate analysts across events so that every technologist who performs the assay is assessed at least once per year.
Frequency alone does not carry the quality load between events. In the Mexican national tuberculosis network, PT for AFB microscopy ran alongside a rechecking system in which routine slides were re-read independently, and laboratories whose work was rechecked scored better on PT (P = 0.002) [7]. Pair each PT event with continuous blinded rechecking wherever the assay is interpretive.
Step 3. Build In-House Panels Where Commercial PT Does Not Exist
When no commercial program covers an assay, your laboratory becomes the panel manufacturer. Three sources of material work:
- Characterized isolates from your own collection, with documented passage history and confirmed identity by a reference method.
- Spiked matrices, for example a platelet unit or a negative culture broth inoculated with a defined concentration of organism.
- Reference nucleic acid, such as in vitro transcribed RNA (trRNA), RNA copied from a template in the laboratory so that sequence content and variant proportions are known exactly.
The Japanese HIV genotyping EQA shows the power of the third option. The organizers used trRNA carrying the HIV gag-pol sequence to build a panel of three single-variant and three mixed samples, which let them test consensus calling and minor variant detection at defined proportions [5]. That design found a real blind spot: three participating laboratories failed to detect variants that made up one-half of a sample, and all three used a common primer with four internal mismatches to the minor variant [5]. Internal QC with a single positive control would never have surfaced that failure.
The platelet bacterial screening program at Canadian Blood Services shows the second option done rigorously. The organizers spiked apheresis platelet preparations, platelets collected directly from a donor, with Staphylococcus epidermidis, Pseudomonas aeruginosa, and Streptococcus pneumoniae at 10 and 100 colony-forming units (CFU) per mL, stored the units at 2 to 8 degrees Celsius (36 to 46 degrees Fahrenheit) to mirror real storage, and inoculated BacT/ALERT culture bottles with 4 or 6 mL on days 7 through 10, the interval between panel preparation and testing at the participating centers [8]. At implementation, each center received four panel members, including positives and negatives [8]. One organism failed validation: S. pneumoniae did not grow consistently and was excluded [8]. That exclusion is the lesson. An organism that behaves differently in the panel matrix than in routine work will grade unfairly, so pilot every panel member before it counts.
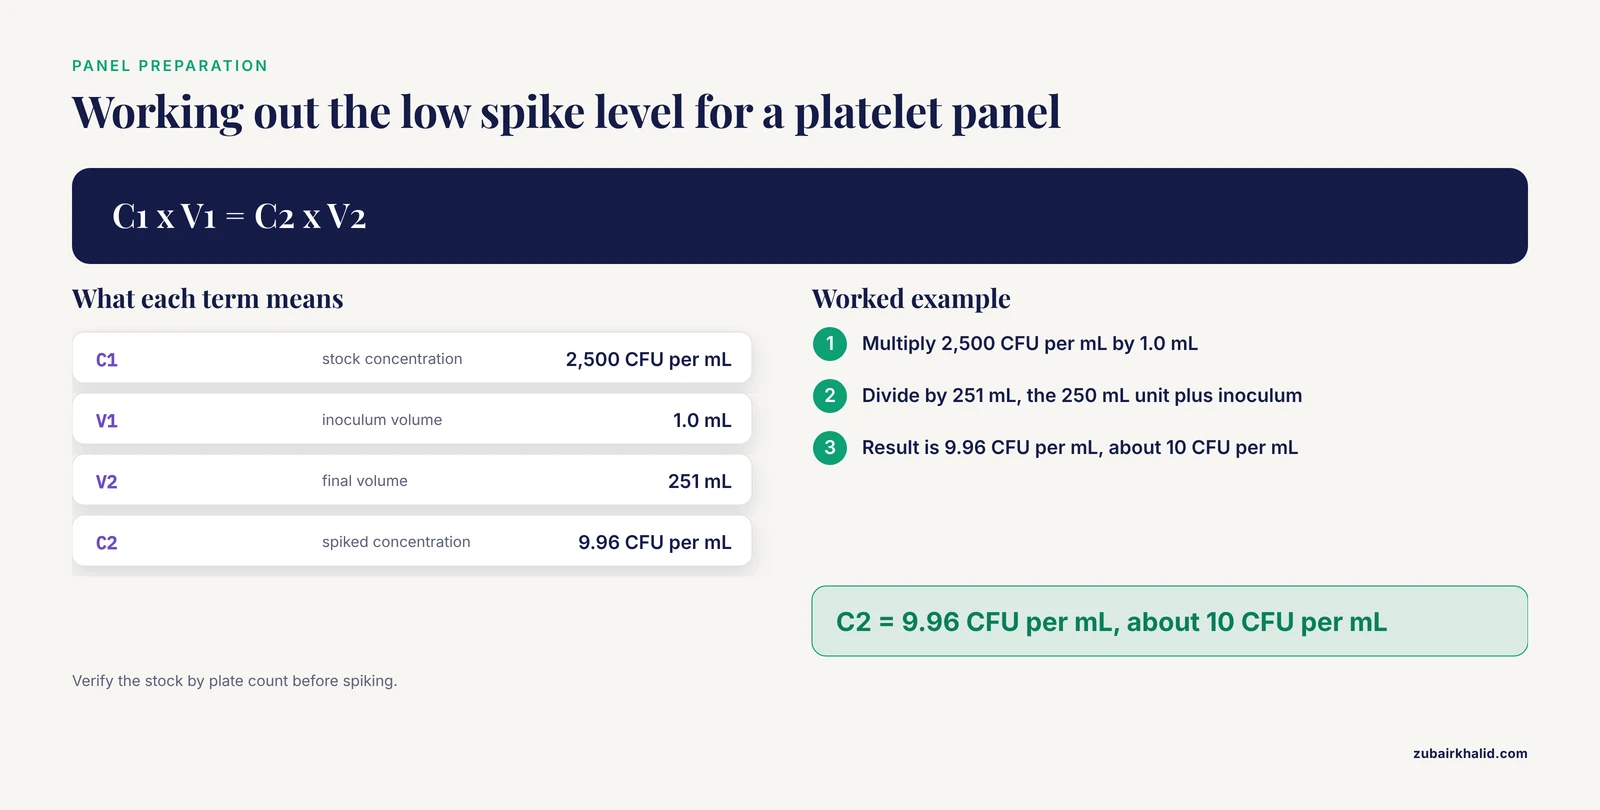
Work the spike calculation before you order cultures:
Goal: one panel member near 10 CFU per mL, the low spike level
used in published platelet screening PT
C1 x V1 = C2 x V2
C1 = 2,500 CFU per mL (adjusted overnight suspension, verified by plate count)
V1 = 1.0 mL inoculum
V2 = 251 mL (250 mL platelet unit plus 1 mL inoculum)
C2 = (2,500 x 1.0) / 251 = 9.96 CFU per mL, about 10 CFU per mL
Panel composition follows four rules:
- Include negatives. A panel of positives only rewards over-calling.
- Include near-threshold positives. In the Mexican AFB program, the number of low-positive slides carrying 1 to 9 AFB per 100 fields was a main factor affecting results [7]. Easy positives do not discriminate.
- Include one challenge per common error mode for the method.
- Document everything: organism identity, passage, spike level, storage conditions, stability data, and acceptance criteria for the panel itself.
Step 4. Define Metrics and Grading Before the Event
Write the grading key before samples arrive, and give every analyst a copy. The key states what counts as correct for each challenge, how partial or equivocal results grade, and the pass threshold.
The SARS-CoV-2 WGS program shows why this matters. Organizers graded participants on three metrics: genome coverage, the proportion of the reference genome recovered with adequate read depth and quality, Pango lineage assignment, the standard nomenclature system that places a SARS-CoV-2 genome in its phylogenetic lineage, and sequence quality [6]. The program refined those metrics between its 2021 and 2022 rounds. When organizers regraded the 2021 results with the stricter 2022 metrics, more participants would have failed every survey sample, and the per-sample fail rate was significantly higher in 2021 than in 2022 [6]. Metrics define the pass rate. Set them deliberately, announce any change before the next event, and expect scores to drop when you tighten them.
Grading should also account for method differences, or the panel will penalize legitimate diversity. In the CAP molecular oncology program, performance was compared across commercial kits and laboratory-developed tests (LDTs), assays designed and implemented by a single laboratory. Twenty-three of 26 reported commercial kits achieved greater than 95 percent accuracy, and LDTs with no kit specified demonstrated 96.8 percent or greater accuracy across the three analytes (96.8 percent for BRAF, 97.5 percent for EGFR, 97.0 percent for KRAS) [4]. Well-designed PT benchmarks methods without unfairly failing any single platform.
For quantitative or low-level analytes, document how sensitivity is determined and report the LLOD, because accreditation surveys now ask for it [2].
Example metrics by method family:
| Method family | Example challenge | Example metric |
|---|---|---|
| Culture and organism identification | Pure or mixed cultures on a routine matrix | Genus and species agreement with the key |
| Antimicrobial susceptibility | Isolates with defined minimum inhibitory concentrations (MIC) | Category agreement with the key |
| AFB and parasite smear reading | Stained slides with known organism counts | Quantitation within one grade, correct species call |
| Molecular amplification (NAAT) | Extracted material or simulated swabs at defined levels | Detected or not detected, correct genotype |
| Sequencing and genotyping | Isolates or reference nucleic acid | Genome coverage, lineage or genotype concordance, quality metrics |
Step 5. Run the Event Like a Patient Specimen
The event is valid only if the samples travel the same path as routine work:
- Handle PT samples with the same preanalytic process as patient specimens, same storage, same processing, same turnaround window.
- Let the normal operator rotation apply. Do not pull the most senior technologist onto the event, and do not let one person run every challenge if several analysts normally perform the method.
- Keep the samples blinded. Strip provider labels, assign internal codes, and log chain of custody from receipt to disposal.
- Do not refer PT material to another laboratory, do not discuss results with peers before submission, and do not repeat a challenge until it gives the expected answer. In regulated settings, referral and special handling are prohibited and treated as fraud.
- Record who performed each step. The record is what turns a score into a training insight.
The schedule built below gives each event a prep_start date and an event_start date. Prep_start is when the owner begins panel preparation or confirms the provider shipment arrived. Event_start is when testing begins.
Step 6. Grade, Investigate, and Remediate
Score against the written key the same day results close.
In-house AFB smear panel: 10 slides, each graded against the reference reading
Technologist A: 8 of 10 slides read correctly
Score = 8 / 10 x 100 = 80 percent
Program threshold: 80 percent
Outcome: pass at the boundary, confirm the boundary rule in your written plan before the event
A passing score is not the end of the event. Review every challenge, including the ones answered correctly by luck, and log near-misses.
When an event fails, work a fixed sequence:
- Classify the failure: preanalytic, analytic, interpretive, or clerical.
- Find the root cause with the analysts involved, and check whether routine patient results were affected during the failure window.
- Apply corrective and preventive action (CAPA), the documented pair of a fix for the cause and a check that prevents recurrence.
- Retest with a new panel to confirm the fix.
PT plus remediation works, and the Mexican AFB program quantified it. Of 430 technicians evaluated with a 10-slide panel, 196 (46 percent) scored below the 80 percent threshold and received intensive training. Mean scores rose from 65 percent to 90 percent (P < 0.0001), and at retesting two years later the mean was 83 percent [7]. The program also showed that PT reflects real-world performance: PT scores were associated with the estimated sensitivity of the microscopist's laboratory (P = 0.01) [7]. A PT failure is a patient-safety signal, not a paperwork event.
Step 7. Feed Results Back Into the Quality Management System
Every event generates a record that belongs in the QMS: date, panel composition, analysts, scores, failures, root cause, CAPA, and retest results. Trend scores across years, and use repeat events to confirm that remediation held, the way the Mexican program retested its microscopists two years after the original round [7].
Review PT performance in management review alongside the other quality indicators, the way the Calgary malaria service tracked PT results continuously next to turnaround times and accuracy [3]. When a new method enters the menu, such as bacterial WGS, extend the PT schedule to cover it, and keep the established method running in parallel until the new one is verified, maintaining backwards compatibility during the transition [1].
The calendar itself is a controlled document. Version it, review it annually, and regenerate it from the template below each year.
The 12-Month Schedule: Format, Template, and Worked Example
This is the working format. The template is a CSV of the test menu, and a short script expands it into a dated schedule.
Save the test menu as test_menu.csv:
assay_id,assay_name,pt_mechanism,events_per_year,months,lead_weeks,assigned_staff
M001,Blood culture organism ID,Commercial,3,2|6|10,6,J. Rivera
M002,Sputum AFB smear,In-house,4,1|4|7|10,4,A. Chen
M003,Gonorrhea and chlamydia NAAT,Commercial,3,3|7|11,6,P. Okafor
M004,SARS-CoV-2 whole genome sequencing,Exchange,2,4|10,8,L. Grant
M005,Platelet bacterial screening,In-house,2,5|11,6,J. Rivera
M006,HIV-1 genotyping,Exchange,1,9,8,L. Grant
Each column is a parameter you control:
- assay_id, a stable identifier used in the QMS.
- assay_name, the reported test name.
- pt_mechanism, one of the five mechanisms from Step 1.
- events_per_year, the planned cadence from Step 2.
- months, the event months separated by a pipe character.
- lead_weeks, weeks between preparation start and the event.
- assigned_staff, the owner named in Step 1.
Then run:
import pandas as pd
from datetime import date, timedelta

YEAR = 2026
menu = pd.read_csv("test_menu.csv")
menu["months"] = menu["months"].astype(str).str.split("|")

rows = []
for _, r in menu.iterrows():
    for m in r["months"]:
        event_start = date(YEAR, int(m), 1)
        prep_start = event_start - timedelta(weeks=int(r["lead_weeks"]))
        rows.append({
            "assay_id": r["assay_id"],
            "assay": r["assay_name"],
            "mechanism": r["pt_mechanism"],
            "event_month": int(m),
            "prep_start": prep_start.isoformat(),
            "event_start": event_start.isoformat(),
            "owner": r["assigned_staff"],
        })

schedule = pd.DataFrame(rows).sort_values(["event_month", "assay_id"])
schedule.to_csv("pt_schedule_2026.csv", index=False)
print(schedule.head(8).to_string(index=False))
Expected output:
assay_id                            assay  mechanism  event_month  prep_start event_start      owner
    M002              Sputum AFB smear   In-house            1  2025-12-04  2026-01-01    A. Chen
    M001     Blood culture organism ID Commercial            2  2025-12-21  2026-02-01  J. Rivera
    M003   Gonorrhea and chlamydia NAAT Commercial            3  2026-01-18  2026-03-01   P. Okafor
    M002              Sputum AFB smear   In-house            4  2026-03-04  2026-04-01    A. Chen
    M004 SARS-CoV-2 whole genome sequencing   Exchange            4  2026-02-04  2026-04-01   L. Grant
    M005     Platelet bacterial screening   In-house            5  2026-03-20  2026-05-01  J. Rivera
    M001     Blood culture organism ID Commercial            6  2026-04-20  2026-06-01  J. Rivera
    M002              Sputum AFB smear   In-house            7  2026-06-03  2026-07-01    A. Chen
Note that the January and February preparation dates fall in December 2025. A January event is prepared in the previous year, so finalize the next year's plan during the current year's budget cycle.
Check the result two ways before circulating it:
coverage = (schedule.groupby("assay_id")["event_month"]
            .agg(events="count",
                 months=lambda s: "|".join(str(x) for x in sorted(s))))
print(coverage.to_string())

print()
print(schedule.groupby("event_month").size().to_string())
Expected output:
          events     months
assay_id
M001           3    2|6|10
M002           4  1|4|7|10
M003           3    3|7|11
M004           2      4|10
M005           2      5|11
M006           1        9
event_month
1     1
2     1
3     1
4     2
5     1
6     1
7     2
9     1
10    3
11    2
dtype: int64
The first table confirms every assay carries the planned number of events. The second shows the monthly load. Months 8 and 12 carry no events by design, which leaves room for holidays and for moving a crowded event. Month 10 carries three events. If staffing is thin that month, change M004's months field from 4|10 to 4|8 and rerun, which shifts the second sequencing event to August.
Common errors and their fixes:
- An empty months cell makes pandas read the column as floats, and the script stops with
ValueError: invalid literal for int() with base 10: 'nan'. Fix by dropping incomplete rows before the split:menu = menu.dropna(subset=["months"]). - An empty lead_weeks cell stops the script with
ValueError: cannot convert float NaN to integer. Fix withmenu["lead_weeks"] = menu["lead_weeks"].fillna(4). - A month number above 12 stops with
ValueError: month must be in 1..12. Validate the months field before building dates.
Sign-off checklist before the schedule goes live: every assay mapped, frequencies meet your accreditation minimum, owners and deputies named, provider enrollment deadlines loaded, and the file versioned in the QMS.
Common Mistakes and Limitations
Scheduling from the provider catalog instead of the test menu. The catalog tells you what is available, the menu tells you what is required. Build the inventory first, then shop.
Letting one senior technologist own every event. If the same person runs all PT, the program measures one person, not the laboratory. Rotate analysts across events.
Special handling of PT samples. Pre-identifying samples, clustering them on a quiet afternoon with extra controls, or repeating a challenge until it passes invalidates the event. In regulated settings it is treated as fraud.
Choosing metrics after seeing results. The SARS-CoV-2 WGS program showed that metric choice alone changes who passes [6]. Write the key first.
Skipping the pilot for in-house panels. The platelet screening program excluded S. pneumoniae because it grew inconsistently in the panel matrix [8]. Unpiloted panel members grade unfairly and destroy analyst trust in the program.
Panels made only of easy positives. Low-positive slides were a main driver of results in the Mexican AFB program [7]. A panel without near-threshold challenges cannot detect sensitivity loss.
Treating PT as a substitute for routine QC. PT is a periodic external check. Daily internal controls, calibration, and maintenance remain the first line of microbiology quality control.
No remediation loop. The measured gains in the Mexican program came from training delivered after scoring, not from scoring itself [7]. A failure without CAPA is a wasted event.
Limitations to state openly in your quality manual:
- PT is a snapshot. Three to four events per year sample performance thinly, which is why interpretive assays also need continuous blinded rechecking [7].
- Panel matrices differ from patient specimens. A spiked platelet unit is not a patient sample, and organism behavior can differ, which is why stability work and piloting matter [8].
- Small panels carry wide uncertainty. A 10-slide panel can pass a marginal reader and fail a competent one on a bad day. Treat single-event scores as signals, not verdicts.
- Commercial panels may not match your exact method or reportable range, and peer-group grading can disadvantage laboratories at the edge of a method's range.
- For emerging methods such as WGS, PT programs are still maturing and metrics vary between programs [1], [6]. Compare your results against the metrics your program defined, not against another program's pass rate.
Frequently Asked Questions
How often should a microbiology laboratory schedule proficiency testing?
At minimum, regulated analytes require three proficiency testing events per year under CLIA, with five samples per event. Every other assay needs at least one event annually, and high-risk or newly validated methods deserve more frequent checks. Pair interpretive assays with continuous blinded rechecking between events.
What is the difference between proficiency testing and quality control?
Quality control is internal material run with each batch to catch drift in real time. Proficiency testing is a periodic, blinded, external check of the entire process, from handling to reporting, graded against peers or a reference standard. A laboratory needs both.
What should I do when no commercial PT program exists for an assay?
Build an in-house panel from characterized isolates, spiked matrices, or reference nucleic acid, pilot every panel member for stability, and grade against a written key. A blinded interlaboratory exchange or a retrospective audit of prior results also works.
Can technologists identify PT samples before testing them?
No. PT samples must be handled exactly like patient specimens by the staff who normally perform the method under normal conditions. Pre-identification, extra controls, or repeated testing until a challenge passes invalidates the event and is treated as fraud in regulated settings.
Who should perform PT events in the laboratory?
Everyone who normally performs the assay, rotated across events so each analyst is assessed at least once per year. Concentrating events on the most senior technologist measures one person, not the laboratory.
What happens after a failed PT event?
Classify the failure, find the root cause, check whether patient results were affected, apply corrective and preventive action, and retest with a new panel to confirm the fix. Document the full sequence in the quality management system.
How many samples should an in-house PT panel contain?
Enough to cover the common error modes of the method, typically a handful of members including negatives and near-threshold positives. The exact size is set by the written plan, and every member must pass a stability pilot before it counts.
How far in advance should PT events be scheduled?
Enroll in commercial programs as soon as catalogs open, because providers close enrollment months before shipping. Give in-house panels four to eight weeks of lead time for preparation and stability checks, and name an owner and a deputy before the date is fixed.
Sources
- Practical issues in implementing whole-genome-sequencing in routine diagnostic microbiology.
- Participation in the College of American Pathologists Laboratory Accreditation Program Decreases Variability in B-Lymphoblastic Leukemia and Plasma Cell Myeloma Flow Cytometric Minimal Residual Disease Testing: A Follow-up Survey.
- A regional centralized microbiology service in Calgary for the rapid diagnosis of malaria.
- Performance Comparison of Different Analytic Methods in Proficiency Testing for Mutations in the BRAF, EGFR, and KRAS Genes: A Study of the College of American Pathologists Molecular Oncology Committee.
- Japanese external quality assessment program to standardize HIV-1 drug-resistance testing (JEQS2010 program) using in vitro transcribed RNA as reference material.
- Continued improvement in the development of the SARS-CoV-2 whole genome sequencing proficiency testing program.
- Implementation of proficiency testing in conjunction with a rechecking system for external quality assurance in tuberculosis laboratories in Mexico.
- Implementation of a proficiency testing programme for bacterial screening in platelet preparations in Canada.