How to Implement a Data Review Process for Microbiology QC Results
By Dr. Zubair Khalid, DVM, MS, PhD ·
A data review process for microbiology quality control (QC) turns individual control results into a documented chain of decisions. It stops analytical failures before wrong results reach clinicians, gives accreditors the evidence they ask for, and builds the longitudinal record you need to separate a bad reagent lot from a drifting instrument or a real shift in local susceptibility. Use it in any clinical or public health microbiology laboratory that reports cultures, antimicrobial susceptibility testing (AST), antigen or antibody assays, or molecular results.
Building the process from a standing start takes most laboratories 4 to 6 weeks of elapsed time, most of it spent writing the QC plan and validating control ranges. The recurring hands-on cost is small by comparison. Plan on 15 to 30 minutes per bench per day for first-line review, about 1 hour per week for trend review, and 2 to 3 hours per month for the summarized management review once the system is live. The steps below take you from writing the QC plan through the annual audit of the review process itself.
What the Process Achieves and Why Microbiology Needs Its Own Version
Quality control in microbiology spans three kinds of evidence. Quantitative controls produce numbers you can chart, such as minimum inhibitory concentration (MIC) values and zone diameters for reference strains. Qualitative controls produce expected positive and negative outcomes for stains, antigen tests, and molecular assays. Process controls confirm that the workflow itself is sound, through media sterility checks, extraction controls, and incubator temperature records. A review process has to cover all three, because a laboratory can pass every charted control and still ship wrong answers if the process layer is broken.
Single-run rules catch gross failures. They are weak at detecting slow drift. The clearest demonstration comes from two independent health systems that mined several years of AST and QC records and uncovered a subtle systematic shift in daptomycin susceptibility testing between 2022 and 2025. The shift lowered measured susceptibility rates by 5 to 22 percent for certain organism-drug combinations, most notably Enterococcus faecium, and it moved prescribing away from daptomycin. Routine QC processes did not detect it. The shift became apparent only when reviewers examined patient data alongside control data, which is why patient data surveillance belongs inside the QC review rather than beside it [1].
Quality management standards expect this kind of planned, documented review. The ISO 15189 framework that underpins most laboratory accreditation programs treats internal and external quality assurance as paired components with defined data management and traceability obligations, and practical protocols built to that framework bundle troubleshooting guidance and data management directly with the analytical procedures [2]. The output of a well-run review is a decision trail: every control result accounted for, every failure explained, every affected patient result assessed, and every month summarized for someone with authority to act.
Key Terms You Will Use
- Quality control (QC): the checks that prove an assay performed as expected at the time of use.
- Internal quality control (IQC): QC material run by your own laboratory, with your own method, on your own schedule.
- External quality assessment (EQA), also called proficiency testing (PT): unknown specimens from an outside program that challenge your method against a reference answer.
- Control material and lot: the organism, reagent, or manufactured control you run, identified by manufacturer lot number and expiration date.
- Levey-Jennings chart: a run chart of control results against the control mean, with lines at 1, 2, and 3 standard deviations (SD).
- Westgard multirule QC: a named set of decision rules applied to Levey-Jennings plots to distinguish random error from systematic error.
- Coefficient of variation (CV): the SD expressed as a percentage of the mean, the number that tells you whether a quantitative control is tight enough to be useful.
- Autoverification: software rules that accept, flag, or block results without human touch.
- Corrective and preventive action (CAPA): the documented investigation and fix that follows an out-of-control event.
- Laboratory information system (LIS) and middleware: the software that captures results and can apply QC rules before anyone looks at them.
- Key performance indicator (KPI): a summarized number, such as QC failure rate per assay, used to manage the program.
Roles and Documents to Put in Place First
Three documents anchor the process. The QC plan states, for every assay on the menu, which control runs, how often, against which acceptance criteria, and who reviews. The SOPs describe how to run the controls and what to do when they fail. The review record captures who looked at the data, when, and what they decided.
One named person owns each review tier. First-line review belongs to a designated, competency-assessed reviewer, usually a senior technologist on the bench. Escalation runs to the supervisor, then the laboratory director. Rotating the first-line role is acceptable if every candidate holds a current competency record, because unassessed reviewers are a common failure point. Quality management frameworks across laboratory disciplines make structured competency assessment a core personnel requirement for exactly this reason [3].
Context matters as much as the numbers. A cross-sectional study of government comprehensive specialized hospitals in Northwest Ethiopia identified workflow organization, equipment reliability and maintenance, service continuity, and power stability as technical determinants of laboratory quality, with quality management, adherence to standard operating procedures (SOPs), and documentation as administrative determinants [4]. Build the weekly review so it reads maintenance logs, temperature records, and staffing disruptions alongside the control charts, because those factors explain many apparent analytical failures.
Materials, Tools, and Records
| Item | Typical use | Working condition or preparation | Safety note |
|---|---|---|---|
| Reference QC strains, such as Escherichia coli ATCC 25922, Staphylococcus aureus ATCC 25923, Pseudomonas aeruginosa ATCC 27853, Enterococcus faecalis ATCC 29212, and Streptococcus pneumoniae ATCC 49619 | Quantitative AST QC, media and stain verification | Maintain a stock culture, prepare working aliquots, and standardize the inoculum to a 0.5 McFarland suspension (approximately 1 × 10⁸ CFU/mL) before inoculation | Opportunistic pathogens. Reconstitute and aliquot in a biosafety cabinet using biosafety level 2 (BSL-2) practices |
| Commercial qualitative controls for molecular and antigen assays | Positive and negative run controls | Run with each batch or at the frequency stated in the manufacturer insert, store per the insert | Human-source material may be infectious. Use universal precautions |
| Media lots | Sterility and growth performance checks | Incubate a sample of every new lot uninoculated and with control organisms before release | Minimal hazard, standard precautions |
| Levey-Jennings charts with a defined rule set | Quantitative QC interpretation | Plot every result against the control mean with limits at 2 SD and 3 SD | None |
| LIS or middleware QC module | Real-time capture and first-line flagging | Configure rules before go-live and validate the flags on historical data | Restrict write access to authorized staff |
| QC review log | Daily and weekly sign-off | One line per review with date, reviewer, assays covered, and disposition | None |
| Corrective action forms | Out-of-control workups | Record the problem, investigation, fix, and patient impact decision | None |
| EQA/PT specimens | External accuracy check | Test exactly as patient specimens and submit through the program portal by the stated deadline | Handle per the program instructions |
Control material stability deserves its own note. Aliquot liquid controls to avoid repeated freeze-thaw cycles, label every aliquot with lot and expiration, and retire a lot at its expiration date even if it still performs, because expired control material invalidates every result run alongside it.
The Data Review Process for Microbiology QC, Step by Step
Step 1. Write the QC plan before any data exist. For every assay, specify the control material, the run frequency (every run, every day of use, every new lot, or every new operator for high-risk molecular assays), the acceptance criteria, and the reviewer. Separate quantitative controls, which get charted limits, from qualitative controls, which get an expected result. State in advance what happens to patient results when a control fails. The reason for this step is simple: review without predeclared criteria becomes post-hoc rationalization, and an inspector will ask to see the plan, not your intentions. Record lot numbers and expiration dates in the plan so every control result can be traced to the exact material that produced it.
Step 2. Establish baseline statistics for every quantitative control. Run each new control at least 20 times across multiple days and, where possible, multiple operators before you rely on it. Calculate the mean, the SD, and the CV. Set warning limits at the mean plus or minus 2 SD and action limits at plus or minus 3 SD, then verify those limits against the manufacturer range rather than adopting the manufacturer range blindly. The reason is that limits calculated from your own data reflect your instruments, reagents, and staff. A control whose SD is wide relative to the clinical decision point, such as a 2-fold MIC dilution step, has almost no power to detect a real shift, so a wide SD is itself a finding that demands a better control or a better method.
Step 3. Capture results at the bench in real time. Enter every control result into the LIS, middleware, or a controlled record at the time of the run, with the control lot, reagent lot, operator, and instrument. The reason is that retrospective transcription breaks the link between a control result and the material it tested, and transcription is where silent errors enter. Design the capture form with structured fields rather than free text, because structured fields make later retrieval, aggregation, and auditing possible.
Step 4. Validate first-line automated screening before you trust it. Configure the QC module to flag rule violations automatically, for example any result beyond 3 SD. Then test the rule set against historical data with known outcomes and measure how often it fires when it should and when it should not. The reason is that automated detection methods can outperform manual review, but their accuracy and generalizability must be validated against a reference standard before a laboratory depends on them, a principle established in validation work on automated adverse event detection from health record data [5]. An unvalidated rule set either floods reviewers with false alarms, which trains them to ignore flags, or stays silent during real failures, which is worse.
Step 5. Document a daily first-line review. A named reviewer examines every control result from the previous 24 hours, confirms that every flag carries a disposition, verifies that all required controls ran, notes any lot changes, and signs the review log. The reason is accountability. A review that nobody signs is a review that did not happen as far as an accreditation surveyor is concerned. Keep the daily review short and complete rather than long and occasional.
Step 6. Hold a weekly trend review. Look at Levey-Jennings plots across weeks rather than days, compare lots side by side, and read the instrument state-of-health indicators: temperature logs, calibration records, maintenance completion, and error logs. The reason is that daily review sees failures while trend review sees drift, and drift quietly corrupts results while every individual control still passes. Quality assurance work in the air sensor field reaches the same conclusion from a different direction, recommending active management of the condition and state of health of deployed instruments together with documentation of hardware and data handling so data quality can be judged in context [6].
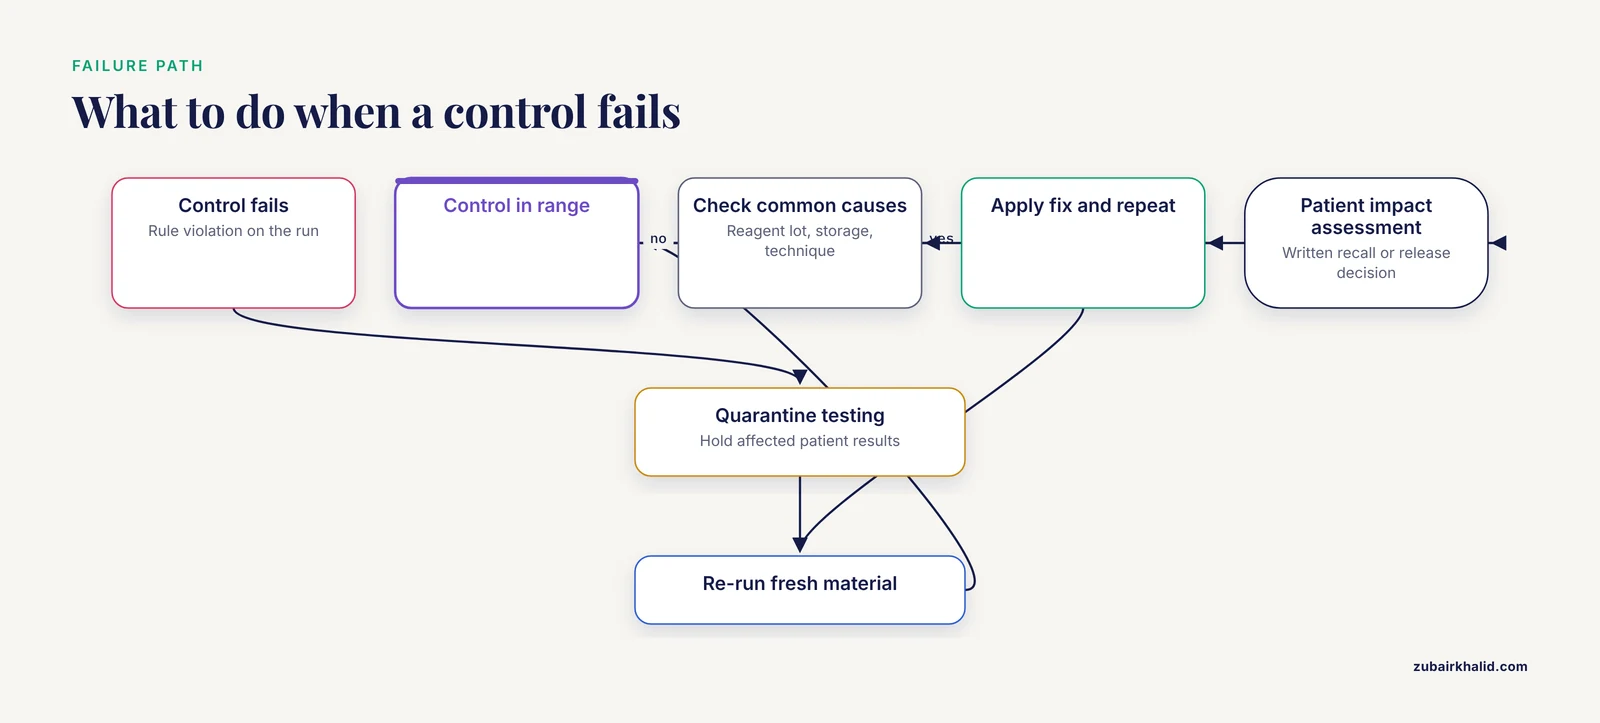
Step 7. Work up every out-of-control event as a case. Follow a fixed sequence: stop or quarantine affected testing, re-run the control with fresh material, inspect reagent lot, storage conditions, instrument status, and operator technique, apply the fix, repeat the control, and document everything. Categorize the source of error as technical (instrument or reagent) versus procedural (operator or SOP), because the category determines the corrective action and reveals patterns across events. A frozen section quality assurance program built exactly this categorization into its software so that error sources could be tracked, documented, and communicated to clinical teams, and the same taxonomy transfers directly to microbiology QC failures [7]. Close every workup with a patient impact assessment: list the patient results produced since the last acceptable control and decide, in writing, whether any of them require recall or annotation.
Step 8. Integrate patient data surveillance into the QC review. At defined intervals, review aggregate patient data next to the control data: the proportion of isolates susceptible for each organism-drug pair, the appearance of unusual phenotypes, and shifts in biotype or colony morphology frequencies. The reason is that control materials sample only a narrow slice of what your assay will see. Manufacturers and standards organizations publish QC criteria for AST, but traditional QC metrics in isolation proved insufficient in the documented daptomycin case, where a subtle testing shift lowered measured susceptibility rates by 5 to 22 percent for certain organisms, most notably Enterococcus faecium, and surfaced only through systematic review of patient data [1]. You do not need a research program to do this. A monthly table of susceptibility percentages per organism-drug pair, reviewed with the same seriousness as the control charts, catches most systematic shifts.
Step 9. Review EQA and proficiency results deliberately. Treat every EQA challenge as a test of the whole process, not just the assay. Investigate every discordance with a root cause analysis, document the outcome, and feed it into training. The reason is that EQA exposes systematic bias that internal controls can miss, because the challenge material passes through your entire workflow. A tiered external quality program for COVID-19 antigen rapid diagnostic tests in Cambodia distributed 290 QC specimens and 60 EQA specimens across a reference laboratory and four facility-based laboratories, with preimplementation training, translated documentation, and results submitted through a structured electronic portal. The reference tier achieved 100 percent concordance while some facility-based laboratories did not, which is the expected pattern and the reason lower-tier sites need the most training support [8].
Step 10. Summarize monthly and prioritize corrective work with explicit weights. Build a one-page monthly pack: QC failure counts by assay, reject and repeat rates, EQA status, open CAPAs, and the susceptibility surveillance table from Step 8. Then rank the corrective work with a declared scoring rule rather than by whoever argues loudest. A primary care quality improvement program offers a workable template: a Delphi panel of 65 physicians validated 17 key performance indicators, a retrospective audit of 450 records measured performance against them, and the Analytic Hierarchy Process prioritized interventions with weights of 50 percent clinical impact, 30 percent feasibility, and 20 percent urgency [9]. The specific weights matter less than having weights, because declared weights make the ranking auditable.
Step 11. Audit the review process itself every year. Check whether reviews happened on time, whether every flag carries a disposition, whether CAPAs closed, and whether the QC plan still matches the current test menu. Update the SOPs and re-assess reviewer competency. The reason is that the review process is itself a process under your laboratory quality management system, and it decays without maintenance. Data management recommendations developed for high-volume genomic laboratory work make the same point, calling for documented storage, retention, reporting, validation, and QC practices that remain feasible for staff to sustain over years rather than weeks [10].
Controls, Expected Results, and How to Read Your Charts
An in-control quantitative assay produces a specific visual signature on the Levey-Jennings plot. Most points fall within 2 SD of the mean, roughly 1 point in 20 lands beyond 2 SD by chance alone, and points scatter without runs or drift. The Westgard multirule set turns that signature into decisions:
- 1-2s: a single result beyond 2 SD. Warning only. Inspect the other control and the run, do not reject on this rule alone.
- 1-3s: a single result beyond 3 SD. Reject the run. This signals random error or a large systematic shift.
- 2-2s: two consecutive results beyond 2 SD on the same side of the mean. Reject. This signals systematic error.
- R-4s: one control beyond plus 2 SD and another beyond minus 2 SD in the same run. Reject. The range is too wide, which points to random error.
- 4-1s: four consecutive results beyond 1 SD on the same side. Reject. An early sign of systematic drift.
- 10x: ten consecutive results on one side of the mean. Reject. A small but persistent shift.
Random error patterns (1-3s, R-4s) usually trace to technique, pipetting, mixing, or transient instrument faults. Systematic patterns (2-2s, 4-1s, 10x) usually trace to reagent deterioration, calibration problems, lot changes, or instrument drift. Reading the pattern before opening the troubleshooting tree saves hours.
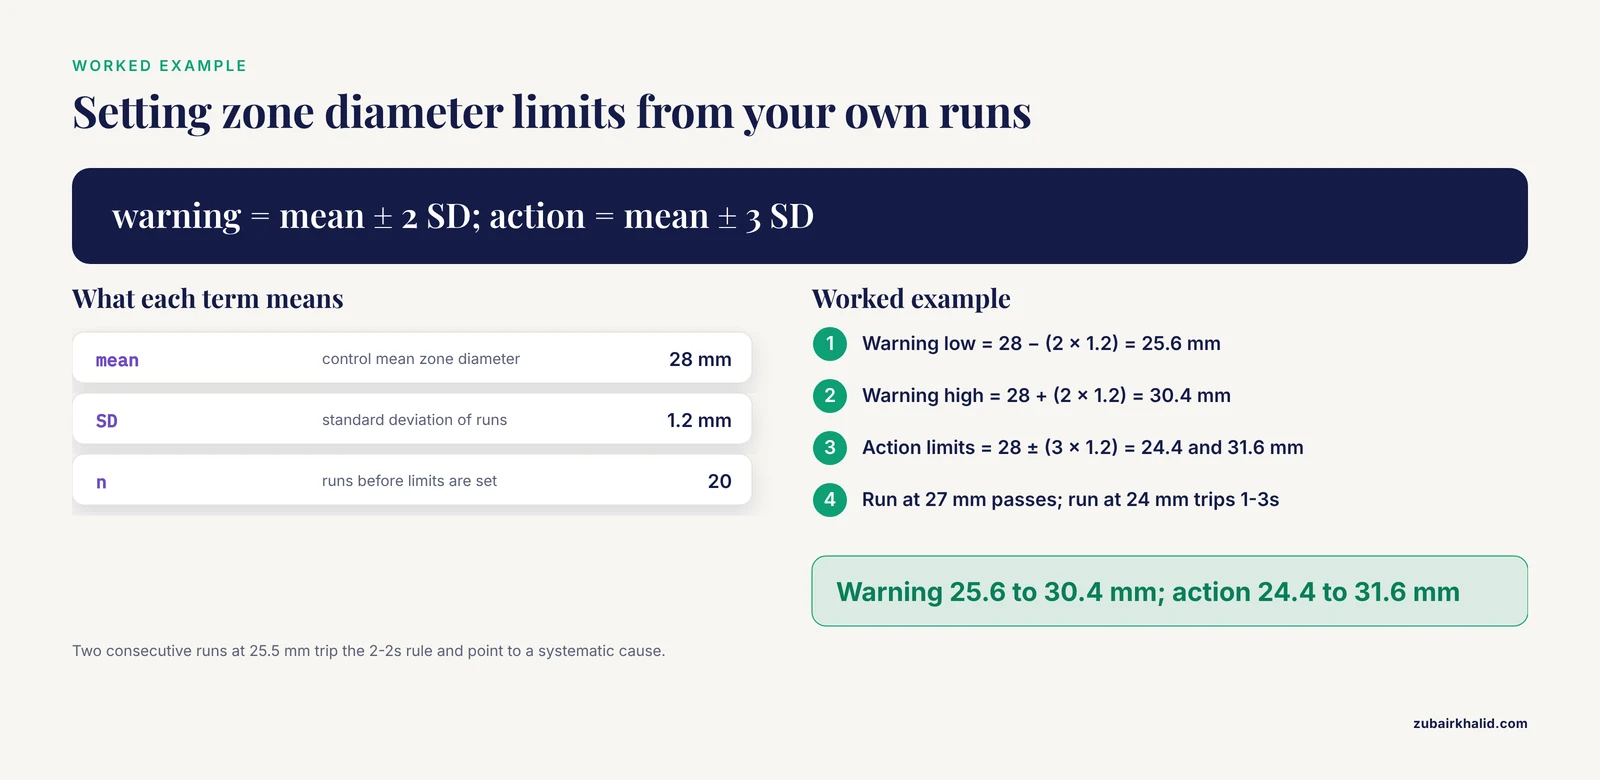
A worked example shows the arithmetic. Suppose 20 runs of your E. coli ATCC 25922 control against a standard panel give a mean zone diameter of 28 mm with an SD of 1.2 mm. Warning limits sit at 25.6 and 30.4 mm, action limits at 24.4 and 31.6 mm. A run at 27 mm passes. A run at 24 mm trips the 1-3s rule and rejects the run. Two consecutive runs at 25.5 mm trip the 2-2s rule, and you should start looking for a systematic cause before the third run confirms it.
Qualitative controls read differently. A positive control must be positive, a negative control must be negative, and a gray zone is a failed run, not a judgment call. For molecular assays, the extraction control confirms the nucleic acid recovery step and the no-template control (NTC) monitors contamination. Any failure invalidates the run regardless of how the patient specimens look.
Certain events trigger intensified review regardless of the calendar: a new control or reagent lot, a new instrument or a repaired one, a new operator, a maintenance event, an EQA discordance, or any unexplained change in the surveillance table. After each trigger, tighten the review interval until the assay has demonstrated stability again.
Lot changes are the highest-risk routine event in QC. Run the new lot in parallel with the current lot for several days before switching, compare the means, and investigate any difference beyond the combined uncertainty before you trust the new lot alone.
The expected output of the review process is a record in which every control result has a disposition, every failure has a documented cause and a patient impact decision, and every month ends with a summary someone in management has actually read.
Troubleshooting a QC Data Review Program
| Symptom | Likely cause | Fix |
|---|---|---|
| Control fails on the first run of a new lot, then passes | Inadequate lot verification or lot-specific bias | Repeat parallel testing against the old lot, recompute limits from new-lot data, check storage and shipping temperature |
| Gradual drift over weeks on one instrument | Aging component, calibration decay, temperature drift | Pull maintenance and calibration logs, schedule preventive service, review state-of-health indicators weekly |
| One control organism fails while others pass | Contaminated or degraded control stock, lost phenotype | Replace the aliquot from stock, check storage conditions, reverify the working culture |
| Scattered random 1-3s failures across days | Operator technique, pipetting, mixing | Observe technique directly, retrain, update the competency record |
| QC passes but the EQA result is discordant | Systematic bias invisible to the internal control matrix | Full root cause analysis, compare the method against the reference method, document CAPA and retrain |
| Review sign-offs lag days or weeks behind | No protected time, unclear ownership | Assign named reviewers, block recurring calendar time, move review into the LIS dashboard |
| Autoverification flags an unmanageable share of results | Rules too tight or never validated | Revalidate the rule set on historical data, retune thresholds, escalate unresolved flags |
| Susceptibility percentages shift after an AST panel or card lot change | Lot-induced bias in the testing system | Verify the new lot with challenge organisms, monitor patient data for the affected organism-drug pairs |
| Records cannot show who reviewed what, and when | Free-text documentation, uncontrolled forms | Move to structured electronic records with version control and audit trails |
Two patterns in that table deserve emphasis. Lot changes appear twice because they are the single most common trigger of otherwise mysterious QC failures. The EQA discordance row is the expensive one, because a discordant EQA result can invalidate months of patient results if the root cause turns out to be a systematic bias.
Variations by Assay Type and Laboratory Size
Paper-based small laboratories. The logic survives without software. Use a bound logbook with preprinted control charts, a weekly supervisor review with initials, and a monthly summary page. The risks to manage are transcription and retrieval, so number every page and keep the QC plan with the charts.
Multi-site networks. Centralize QC data so one team can see every site at once. A regional laboratory network in Shenzhen deployed an integrated informatics platform in August 2023 across 5 district hospitals, 1 central laboratory, and 4 community health stations, centralizing QC data processing while separating routine operational workflows from documentation, analytics, and approval functions [11]. The design lesson travels: keep the operational capture layer and the review-and-approval layer distinct, because reviewers need an analytical view that the bench does not.
Molecular assays. Add the NTC, the positive amplification control, and the extraction control to every run, and review contamination patterns across runs. A single carryover event can invalidate a whole day of results, so the review must look across runs, not just within them.
Rapid and point-of-care (POC) tests. The review frequency can be lighter but the logic is identical. Controls run at the manufacturer-stated frequency, results are documented, a named reviewer checks the record, and EQA participation continues even for near-patient testing.
High-volume or automated workflows. Where volume makes manual review impossible, use layered QC. A semi-automated end-to-end QC system built for large-scale medical image annotation uses a data assignment module, a protocol QC module that enforces standardized guidelines through structured validation, and an annotation QC module running checks from format validation through multi-annotator consistency, with expert adjudication as the final layer [12]. The architecture maps cleanly onto laboratory data review: mechanical checks first, statistical checks second, expert adjudication last.
Genomic and whole-genome sequencing outputs. Laboratories that report sequence-based results need a review tier for the genomic data itself, including read quality, lineage assignment, and interpretation of resistance mutations, before results feed clinical or public health decisions. Jurisdictions running routine whole-genome sequencing for tuberculosis control describe exactly this layer, with defined approaches to genomic data interpretation feeding drug resistance calls and transmission assessment [13].
AST at scale. Pair the control charts with the patient data surveillance table from Step 8, because the control strains sample a narrow slice of the organism population your laboratory actually reports on.
Records, Retention, and Data Integrity
Define retention in the QC plan before go-live, set to meet your accreditation program and any applicable regulation, and record where each record type lives. A record you cannot produce on request does not count as retained. Plan the storage medium so records stay retrievable and readable for the full period, with backup and a documented recovery path for electronic systems.
Electronic QC records need controls that paper never needed. Access restriction, audit trails, and version control are the baseline. Platforms that unify laboratory information management and quality management functions under a risk-based computer software assurance framework aligned with 21 CFR Part 11 and ISO/IEC 17025 demonstrate the pattern at scale, with one pilot deployment logging 1,456 QC checkpoints and 43 documented deviation-handling episodes across 187 laboratory requests [14]. You do not need that infrastructure to start, but whatever system you use should answer three questions for any historical control result: who entered it, what material and instrument produced it, and who reviewed it.
Version control applies to documents as much as data. Every SOP revision, form change, and QC plan amendment needs an identifier, a date, and a traceable note of what changed and why. When large regulatory diagnostic datasets were restructured after the fact, inconsistent naming conventions, unstable document identifiers, poor versioning, and untraceable amendments were the documented obstacles that made the data hard to use [15]. Design your records so none of those failure modes can occur.
Traceability closes the loop. Every control result should link to the control lot, reagent lot, instrument, operator, and review disposition, so that a single failed control can be traced forward to the patient results it puts in doubt and backward to the material that caused the doubt.
Common Mistakes and Limitations
Reviewing only failures, never trends. A reviewer who opens the record only when a rule fires will miss every slow drift, and slow drift is the failure mode that does the most damage before anyone notices. The daptomycin testing shift described above is the case study.
Treating QC as a checkbox. Signing the log without looking at the chart converts a quality system into a liability record. If the daily review takes less than a minute, the reviewer is probably not looking at the plots.
Skipping the patient impact assessment after a failure. The corrective action is not complete until someone has listed the patient results produced since the last acceptable control and made a written recall decision. Skipping this step is the difference between a quality event and a patient safety event.
Adopting manufacturer acceptance ranges without local verification. Manufacturer ranges are a starting point. Limits that do not reflect your own method performance will either reject good runs or pass bad ones.
Deploying unvalidated autoverification. Rules that were never tested against historical data will misfire in ways you discover from clinicians rather than from the QC record.
Diffuse review responsibility. When everyone owns the review, nobody does. Name the reviewer, record the competency, and escalate on a defined path.
Ignoring lot changes as a review trigger. Every lot change should force a documented comparison before the new lot enters service.
Keeping QC data in silos. Paper logs, spreadsheets, and LIS records that never meet make cross-site and cross-time trends invisible, which is the problem centralized QC platforms exist to solve.
Writing free-text documentation. Free text cannot be aggregated, audited, or versioned reliably, and it hides the trail an investigator needs after an adverse event.
Reviewing numbers without context. Maintenance backlogs, temperature excursions, staffing gaps, and power interruptions explain many apparent analytical failures, so the weekly review reads the operational logs alongside the charts.
The review process also has hard limits. It cannot rescue an assay that was never validated, staff who were never trained, or a pre-analytic pipeline that mishandles specimens before they reach the bench. It cannot substitute for judgment on individual patient results, which still requires clinical correlation by the treating clinician. And the process itself decays, which is why the annual audit in Step 11 exists. Budget for it.
Safety Notes
Reference strains used for QC are opportunistic pathogens. Reconstitute lyophilized stocks and prepare working aliquots inside a certified biosafety cabinet using BSL-2 work practices, and never prepare inoculum suspensions on an open bench. Commercial control materials derived from human sources are treated as potentially infectious regardless of screening claims, so apply universal precautions including gloves and face protection when handling them. Some control reagents contain chemical preservatives that are toxic or reactive, so read the safety data sheet before first use and store incompatible chemicals separately. Sharps used in QC setup go into puncture-resistant containers at the point of use.
Frequently Asked Questions
How often should microbiology QC data be reviewed?
Daily first-line review is the minimum, with a weekly trend review, a monthly summarized management review, and an annual audit of the process itself. EQA follows the external program's schedule. Anything less than daily first-line review lets failures accumulate before anyone sees them.
Who should be the designated QC reviewer?
A named, competency-assessed staff member, typically a senior technologist, with a defined escalation path to the supervisor and laboratory director. Diffuse responsibility is the most common reason reviews silently stop happening.
What is the difference between internal QC and external quality assessment?
Internal QC uses your own control material on your own schedule to check day-to-day performance. EQA sends unknown specimens from an outside program through your workflow and compares your answer to a reference, which checks accuracy against other laboratories and exposes bias your own controls cannot see.
Can autoverification replace human QC review?
No. Autoverification handles first-line screening with validated rules, and it catches only the violations you programmed. Human review supplies context, trend interpretation, and dispositions for flags, and it is the layer that catches what nobody thought to program.
What should I do first when a control fails at the start of a shift?
Hold or quarantine the affected testing, then re-run the control with fresh material. Check the common causes first: reagent lot and expiration, storage temperature, and operator technique. Document the event and complete the patient impact assessment for results since the last acceptable control before releasing anything.
How long should QC records be retained?
As long as your accreditation program and applicable regulation require, defined in the QC plan before go-live. Plan the storage medium so records stay retrievable and readable for the full period, because an unreadable record is a missing record at survey time.
How do I set acceptance limits for a new lot of control material?
Run the new control at least 20 times over multiple days, calculate the mean, SD, and CV, and set limits from your own data. Verify against the manufacturer range and run the new lot in parallel with the old lot for several days before switching.
Do rapid point-of-care tests need the same data review process?
The logic is the same and the documentation can be lighter. Controls run at the manufacturer-stated frequency, results are recorded, a named reviewer checks the record, and EQA participation continues. What changes is the volume, not the principle.
Sources
- Leveraging patient data to detect systematic shifts in daptomycin susceptibility testing associated with reduced prescribing.
- Integrated laboratory protocol for the diagnosis of Sexually Transmitted Infections (STIs): Standardized pre-analytical procedures, rapid screening, hemagglutination, and ELISA methods for use in resource-limited settings.
- Quality Control in Assisted Reproduction Centers.
- Determinants of quality laboratory service provision amongst government comprehensive specialized hospitals in Northwest Ethiopia.
- Accuracy and generalizability of using automated methods for identifying adverse events from electronic health record data: a validation study protocol.
- Air Quality Sensor Experts Convene: Current Quality Assurance Considerations for Credible Data.
- Software solution for integration of frozen section quality assurance into daily practice.
- Piloting an external quality assurance program (QAP) for COVID-19 antigen rapid diagnostic tests (Ag-RDTs): findings and lessons learned from Cambodia.
- From Consensus Through Prioritization: A Delphi Method, Clinical Audit, and Analytic Hierarchy Process Framework for Quality Improvement in Primary Diabetes Care.
- Recommendations for HLA Genotyping Data Standards and Clinical Laboratory Staffing Considerations.
- Development and Implementation of an Internal Quality Control and External Quality Assessment Information System for a Regional Medical Laboratory Center: Pilot Design and Implementation Study.
- Semi-automated end-to-end quality control system for annotation data based on automated Cobb angle measurement.
- Whole genome sequencing for Mycobacterium tuberculosis in public health responses: a review of current practice and enablers in select low-incidence jurisdictions.
- A cloud-enabled LIMS-QMS platform with large language model-assisted standard operating procedure generation for GLP/GMP-aligned theranostics laboratory operations.
- Challenges in Structuring SARS-CoV-2 Emergency Use Authorization Diagnostics Data: Leveraging Findable, Accessible, Interoperable, and Reusable Principles for the Next Era of Diagnostic Data Transparency.