Why Does My Workflow Fail on the Cluster but Not Locally?
By Dr. Zubair Khalid, DVM, MS, PhD ·

Your pipeline almost certainly did not break because the cluster is hostile. It broke because the cluster is a different computer on every run. Locally you have one Python, one PATH, no memory enforcement, and a dataset that fits in RAM. On the cluster, your job lands on a node you did not choose, runs under a scheduler that kills anything exceeding the memory or time you requested, and starts from a shell that never sourced your environment.
When a workflow fails on the cluster but not locally, the difference is the environment, not the code. The most common cause is a software mismatch, a tool or version that exists on your laptop but not in the job's shell. The first thing to check is not the pipeline's final summary line. Check the task level stderr, the exit code, and the scheduler's accounting record.
A bioinformatics workflow manager such as Nextflow or Snakemake exists to manage exactly this gap. It stages files, submits each step as a scheduler job, tracks dependencies, and resumes after failure. The fixes in this article use those features rather than hand written scripts. Examples use Slurm, the job scheduler on most university clusters in the United States, and the same patterns transfer to SGE, PBS, and LSF.
Start Here: Read the Real Error and the Exit Code
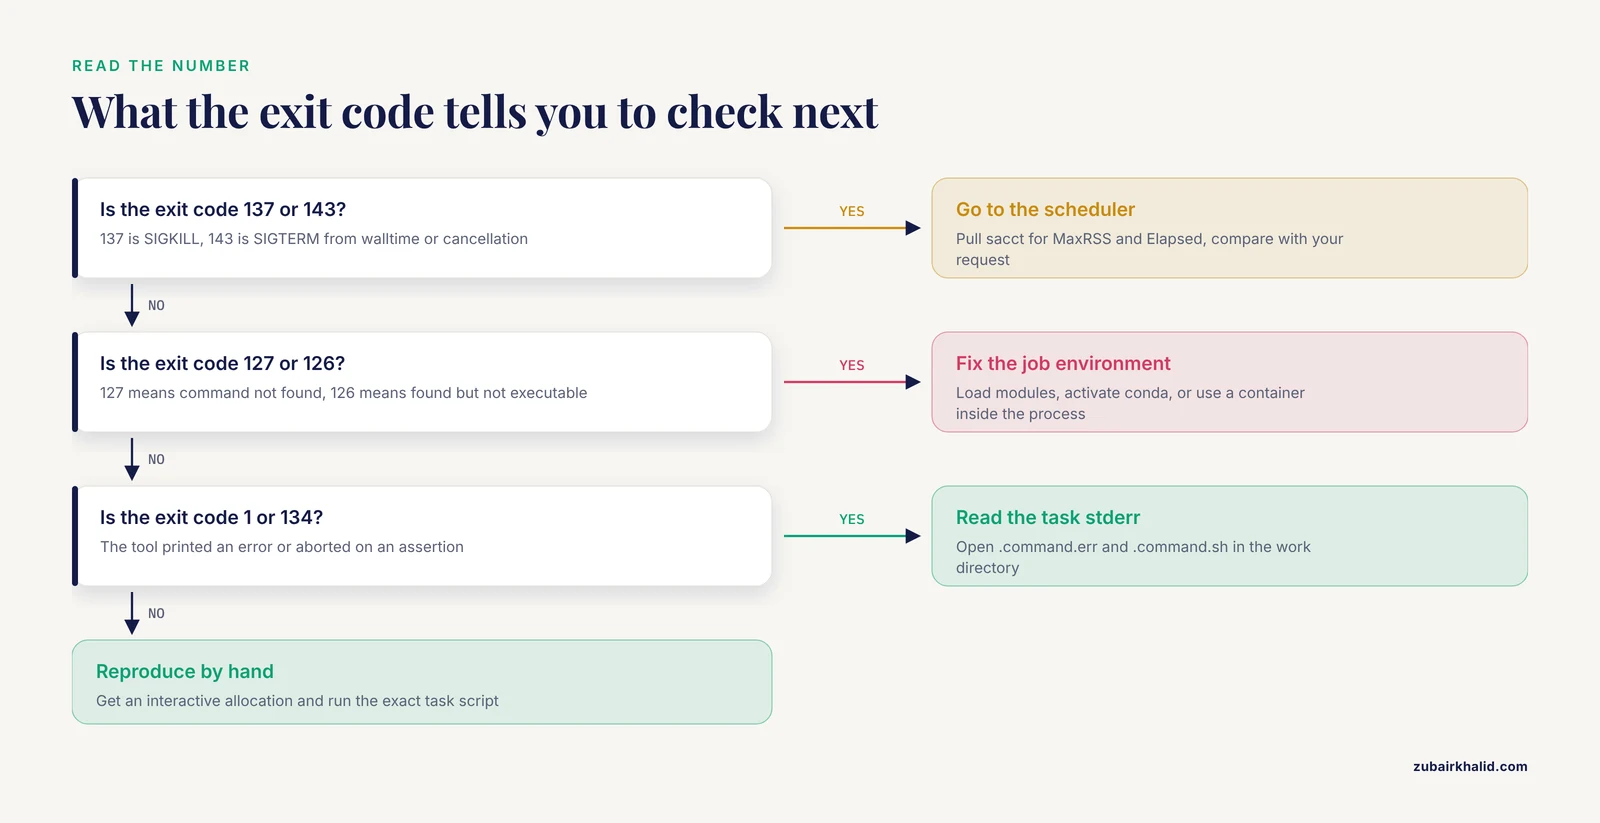
The last line of a failed run is a summary, not a diagnosis. The cause sits in the task's stderr, the exit code, and the scheduler record. Jobs run on compute nodes, not on the login node you ssh into, and each writes its own logs.
Where the evidence lives:
- Nextflow prints the work directory of the failed task, a path like
/scratch/yourname/nf-work/ab/1a2b3c. Inside it, read.command.sh(the exact script that ran),.command.err(stderr),.command.out(stdout), and.exitcode. The full run log is.nextflow.login the launch directory, andnextflow loglists past runs. - Snakemake writes timestamps and errors under
.snakemake/log/, and the error message names the failing job's log file. - The scheduler writes each job's stdout and stderr to files such as
slurm-123456.out, depending on site convention.
A process killed by a signal exits with 128 plus the signal number. The values below cover most cluster failures.
| Exit code | Signal | Usual meaning on a cluster |
|---|---|---|
| 0 | none | success, but verify results anyway (see silent failures below) |
| 1 | none | the tool printed an error, read stderr |
| 126 | none | command found but not executable (permissions or a noexec mount) |
| 127 | none | command not found, usually a missing module or PATH entry |
| 134 | SIGABRT (6) | abort, often a failed assertion or memory error in compiled tools |
| 137 | SIGKILL (9) | killed by the out of memory killer or cancelled by an administrator |
| 139 | SIGSEGV (11) | segfault, wrong binary for the CPU or memory corruption |
| 143 | SIGTERM (15) | walltime limit reached or the job was cancelled |
Slurm's accounting tool turns a job id into facts. MaxRSS is the maximum resident set size, the peak RAM the job actually used.
sacct -j 123456 -o JobID%20,State,ExitCode,MaxRSS,Elapsed -P
scontrol show job 123456
Compare MaxRSS with the memory you requested, and Elapsed with the time limit. On sites with cgroup enforcement, the State column often says OUT_OF_MEMORY directly. A State of TIMEOUT means the job hit its walltime, the maximum run time the scheduler granted.
Troubleshooting Table: Symptom to Fix
Find your symptom, confirm the cause with the listed check, then apply the fix. The sections after the table explain each mechanism in depth.
| Symptom | Likely cause | How to confirm | Fix |
|---|---|---|---|
command not found for a tool that works on your laptop | Module not loaded or conda env not active in the job shell | Inside the job, run which samtools and module list | Load modules or activate the env inside the process script, or switch to containers |
ModuleNotFoundError or wrong package behavior | Different Python or R environment on the cluster | Compare python -V and conda list output, local versus job | Pin the environment with a container or a conda lockfile |
| Exit code 137, job dies partway | Out of memory, request too low | sacct MaxRSS versus requested memory | Raise the memory directive for that process, add retry scaling |
| Exit code 143, or State TIMEOUT | Walltime exceeded | sacct Elapsed versus TimeLimit | Raise the time directive, checkpoint long steps |
| Tasks run on the login node and support staff complain | Executor not configured (Nextflow) or no profile (Snakemake) | squeue -u $USER shows nothing while the pipeline runs | Set executor = 'slurm' in a Nextflow profile, or add a Slurm profile for Snakemake |
| Missing input files, or paths that exist only locally | Relative paths, wrong working directory, data not on shared storage | Print pwd and ls the path inside the job | Pass absolute paths as params, stage inputs through the workflow manager |
| Missing output files reported seconds after jobs succeed | Shared filesystem latency | The file appears moments later | Raise latency-wait and retries in the Snakemake profile |
No space left on device | Quota exceeded or full scratch | df -h, du -sh work/, quota -s | Clean old work dirs, write to scratch, request a quota increase |
| Java errors when launching Nextflow | Old default Java module | java -version | Load a newer Java module before launching |
| Docker errors or image pull failures | Docker not permitted, registry unreachable from compute nodes | Try apptainer pull docker://ubuntu:22.04 on a compute node | Use Apptainer with singularity.enabled = true and a shared cache directory |
| Conda env build fails or hangs | No internet on compute nodes, slow solver on the login node | Run the env build by hand and watch where it stops | Prebuild envs with mamba on the login node, or use containers |
| Results differ between local and cluster with no errors | Version, reference, locale, or thread differences | Diff tool versions, md5sum references, set LC_ALL=C and retest | Pin versions and references, set LC_ALL=C in scripts |
$'\r': command not found | Windows line endings (CRLF) | file script.sh reports CRLF | Run dos2unix, add eol rules to .gitattributes |
| Random crashes or extreme slowdown under load | Thread oversubscription, BLAS or OpenMP spawning all node cores | Watch CPU use inside the job with top | Set OMP_NUM_THREADS and OPENBLAS_NUM_THREADS to the allocated core count |
Two terms used throughout: the executor is the component of a workflow manager that submits tasks to a system, and the work directory is where the manager keeps each task's files and logs.
Why a Workflow Fails on the Cluster but Not Locally
The causes below are ordered by how often they explain a local pass and a cluster failure. Each section gives the mechanism first, then the fix.
1. A Different Software Environment
A scheduled job does not inherit the shell you configured. The scheduler starts each task in a fresh, non-interactive shell on a compute node. Two consequences follow. First, modules you loaded by hand on the login node do not exist in the job. Second, many default startup files return early unless the shell is interactive, so module load lines in your .bashrc never run inside a job at all.
The module system (Lmod on most sites) toggles software versions per shell. If your pipeline calls samtools and the job never ran module load samtools, you get exit code 127. The same applies to conda, because conda activate myenv changes PATH only in the shell that runs it. A job shell without the activation finds the system Python instead.
Version drift is the quieter variant. The cluster module may offer samtools 1.2.4 while your laptop has 1.19.2. Flag names, output columns, and defaults changed between those versions, so the run completes and produces subtly different files. Python 3.6 versus 3.12 breaks modern syntax and library APIs. R 3.x versus 4.x changes factor handling and breaks packages. A missing system library is the third variant: conda bundles libxml2, libcurl, and friends on your laptop, while a bare cluster Python lacks them, and imports fail with errors that look like broken code.
Fixes, in order of preference:
- Containers (see the Apptainer section below), which carry the exact versions with the job.
- A conda environment created from a lockfile (
conda env export -n myenv > environment.lock.yml), activated inside each process script. - Explicit
module loadlines inside each process script, never in shell startup files.
Verify inside a job, not on the login node:
module list
which samtools
python -V
conda list -n myenv | head -25
The deeper point is that the same protocol behaves differently in different environments, and this is not unique to computing. In a randomized trial across seven specialty clinics, an automated text messaging protocol for hepatitis C care produced different uptake and usability by site, which the investigators tracked with process measures such as facilitation metrics and usability ratings [1]. Treat your laptop and the cluster as two sites running the same protocol, and measure the environment at both.
2. Resource Limits the Scheduler Enforces
On your laptop, using all 32 GB is a slowdown. On a cluster, the scheduler enforces per job limits with control groups (cgroups), the kernel mechanism that caps what a job may consume. Exceed the memory you requested and the kernel's out of memory (OOM) killer sends SIGKILL, which surfaces as exit code 137. Locally nothing kills the process, so the failure appears only on the cluster, and often only on the real dataset.
Measure before you fix. sacct reports MaxRSS, the peak RAM the job actually used:
sacct -j 123456 -o JobID%20,State,ExitCode,MaxRSS,Elapsed -PIf MaxRSS approached or exceeded the request, raise the memory directive for that one process. Do not raise memory for the whole pipeline. Note that free -g inside a job shows the whole node's RAM on shared nodes, not your limit. To see the enforced limit, read the cgroup value directly (cat /sys/fs/cgroup/memory.max on cgroup v2 sites).
CPU limits fail in two directions. Request 2 cores and a tool that links OpenMP (the threading layer inside many scientific programs) or a threaded BLAS library (the linear algebra backend under NumPy and R) will spawn one thread per visible core, sometimes 64 on a shared node. Oversubscription slows everything and can trip site policies. Size threads to the allocation inside the job script:
export OMP_NUM_THREADS=${SLURM_CPUS_PER_TASK:-1}
export OPENBLAS_NUM_THREADS=1
export MKL_NUM_THREADS=1
In Nextflow process scripts, ${task.cpus} is the portable equivalent of SLURM_CPUS_PER_TASK. Also prefer these variables over nproc, because nproc can report all cores on the node rather than your allocation, depending on cluster configuration. The opposite failure is paying for 8 cores while the tool runs single threaded because it needs a command line flag you did not pass. Check the tool's thread option and the job's actual CPU use before blaming the scheduler.
Walltime failures leave the nastiest debris. When the limit runs out, Slurm sends SIGTERM (exit 143) and the State column shows TIMEOUT. A step killed at hour 23 of 24 may leave a truncated BAM or a half written table, and the failure then appears one or two steps later as a corrupt input. Give long steps realistic time directives, and configure retries that scale with the attempt number:
process {
    errorStrategy = 'retry'
    maxRetries    = 3

    withLabel: highmem {
        cpus   = { 4 * task.attempt }
        memory = { 16.GB * task.attempt }
        time   = { 4.h * task.attempt }
    }
}
With errorStrategy = 'retry', the failed task reruns automatically, and task.attempt grows from 1, so each retry can request more memory and time.
Two quieter limits bite tools that open many files at once. ulimit -n caps open file descriptors, and ulimit -u caps user processes. Merging steps that read hundreds of files hit too many open files. Run ulimit -a inside a job to see both values.
3. Scheduler Integration Gaps in Nextflow and Snakemake
Both managers default to running tasks where you launched them. On a cluster that default means the login node, which is exactly what your site's usage policy forbids. The fix in both cases is a profile, a named configuration selected at launch, that names the scheduler.
Nextflow's default executor is local. Declare a Slurm profile in nextflow.config:
profiles {
    cluster {
        process {
            executor = 'slurm'
            queue    = 'general'

            withLabel: low {
                cpus   = 2
                memory = '8.GB'
                time   = '2.h'
            }

            withLabel: highmem {
                cpus   = 8
                memory = '64.GB'
                time   = '24.h'
            }
        }
    }
}
Launch with the work directory on shared storage so compute nodes can reach staged inputs (staging means the manager copies or links each task's inputs into the task's own directory before the script runs):
nextflow run main.nf -profile cluster -w /scratch/$USER/nf-work -resumeThree cluster specific settings matter. First, Nextflow needs a recent Java runtime, and cluster defaults are often old, so check java -version and load a newer module if needed. Second, keep the cache off your home quota with export NXF_HOME=/scratch/$USER/.nextflow. Third, for steps that write heavily, the scratch directive copies staged inputs to node local scratch and results back, which spares the shared filesystem. When you capture logs in files, add -ansi-log false for clean output.
Snakemake (version 8 and later) submits through executor plugins configured in a profile. If the folder profile/default exists in your project, Snakemake reads it automatically:
# profile/default/config.yaml
executor: slurm
jobs: 100
retries: 3
latency-wait: 120
rerun-incomplete: true
use-conda: true
conda-frontend: mamba
printshellcmds: true
default-resources: "slurm_partition=general cpus_per_task=2 mem_mb=8000 runtime=120"
Override resources per rule with set-resources entries such as align_reads:mem_mb=48000. With use-conda, environments are built on the node where you launched Snakemake, so that node needs internet access, and building ahead of time with mamba (a faster conda compatible solver) avoids long first run stalls. Running bare snakemake with no profile on a shared login node is the single fastest way to hear from your system administrators.
Both tools are mature, and the practical differences are narrower than forum arguments suggest:
| Aspect | Nextflow | Snakemake |
|---|---|---|
| Language | Groovy based DSL | Python based |
| Model | Dataflow channels and asynchronous tasks | Rule based directed acyclic graph (DAG) |
| Scheduler setup | Built in executors (slurm, sge, pbs, lsf, k8s) chosen in config | Executor plugins (slurm and others) chosen in a profile |
| Resume behavior | Task hashing, -resume reuses completed tasks | DAG based, reruns only outdated rules |
| Containers | docker, singularity, and conda directives per process | use-docker, use-singularity, use-conda flags |
| Ecosystem | nf-core pipelines and modules (the community Nextflow collection) | Community rules, wrappers, close bioconda integration |
Choose by team skills and ecosystem fit. If your group lives in Python, Snakemake reads naturally. If you want community maintained production pipelines, the nf-core catalog on Nextflow is the larger one.
4. Paths, Filesystems, and Data Staging
Staging fixes and causes path problems at the same time, because each task sees its inputs in its own directory under names the workflow declared.
Relative paths and the working directory. A scheduled job starts in a working directory your script may not assume. A relative path that resolved on your laptop resolves to nothing in the job. Hardcoded absolute paths are worse, because /Users/you/data exists only on your laptop. Pass inputs through the manager's input declarations and reference them by their staged names. Keep site specific locations in parameters, for example params.genome = '/projects/ref/hg38/hg38.fa', never inside process scripts.
Node local /tmp. /tmp on a compute node is node local. Files written there vanish when the job ends, and two tasks running on different nodes cannot see each other's /tmp. Tools that quietly use a temp directory for intermediates then fail with missing file errors that make no sense until you realize the two halves ran on different nodes. Point tools at shared scratch (high performance temporary storage, usually not backed up) or use Nextflow's scratch directive.
Quotas. Home directories carry small quotas, while project and scratch areas carry large ones. A work directory under home fills the quota mid run with the unhelpful error No space left on device. Check with df -h /scratch, du -sh work/, and quota -s (on Lustre filesystems, lfs quota -u $USER /scratch). Put work directories on scratch and publish only final outputs to project storage.
Permissions and umask. umask is the default permission mask applied to new files, and it differs between your laptop and cluster shells. Outputs may land unreadable to collaborators, or a read only project directory may break staging. Set an explicit umask in process scripts that write shared outputs. Nextflow's publishDir with mode: 'copy' writes real files into the publish directory, while the default symlink points into the work directory and breaks when you clean the work dir.
Filesystem latency. Parallel filesystems (Lustre and GPFS on most clusters) spread data across many servers. Under load, a file a job just wrote can take seconds to appear to the node that checks for it. Snakemake then reports Missing output files for a job that succeeded. The profile settings latency-wait and retries exist for exactly this situation. Raise latency-wait to 120 seconds on busy filesystems and let retries absorb the rest.
Cleanup. Safety note: deleting work directories destroys the only copy of any output you have not published. Verify published files before cleanup, and consider moving old work directories to a holding path for a week before deleting them.
5. Containers Behave Differently on HPC
Docker needs a privileged background daemon, and most HPC sites do not run one. A pipeline that uses docker.enabled = true locally will fail on the cluster by design. The HPC equivalent is Apptainer (formerly Singularity), a container runtime built to run without root privileges on shared systems.
Nextflow switches engines in config:
singularity {
    enabled    = true
    autoMounts = true
}
Set a shared cache so images are pulled once rather than per task:
export NXF_SINGULARITY_CACHEDIR=/scratch/$USER/singularitySnakemake's profile keys use-singularity: true and singularity-prefix: /scratch/$USER/singularity do the same.
Compute nodes often have no internet, so image pulls fail there even when they worked from your laptop. Pre pull images from the login node into the shared cache, or use a site mirror. Test registry access directly:
apptainer pull docker://ubuntu:22.04Safety note: pull containers only from registries your institution trusts, and pin versions rather than latest tags. A container runs with your file permissions, so a tampered image can read or delete everything you can.
6. Your Test Data Is Not Your Real Data
The local run that convinced you the workflow works used a small, clean test file. The cluster run uses the full cohort. Three differences bite.
Memory scales with data. Tools that load a whole VCF, expression matrix, or table into RAM fit a 10 MB test file in seconds and blow an 8 GB allocation on a 40 GB real file. This is why the OOM kill appears on the cluster with no local equivalent.
Real data are dirtier. Truncated FASTQ from a failed transfer, mixed gzip and plain files, CRLF line endings from a Windows collaborator, and duplicated sample ids all pass locally because your test file had none of these problems. Validate inputs at the first step: count records, check compression, and fail early with a clear message.
References drift. hg38 with alt contigs is not the same file as hg38 without them, and an index built with an older aligner version is not interchangeable. Checksum your references (md5sum reference.fa) and record the values in the run report, because a wrong reference produces a completed run with quietly wrong results.
The prevention is a test profile: a miniature dataset that exercises every process end to end in minutes. nf-core pipelines ship one by convention. Run the test profile on the target cluster and partition before the real launch, because the test run also verifies modules, containers, staging, and scheduler settings in the real environment.
7. Silent Failures with Exit Code Zero
The worst failures return exit code 0. The step ran, the file exists, and the data are
Silent Failures: When Exit Code Zero Lies
The truncated failure is loud. The truncated dataset is quiet, and it is the more dangerous of the two. A step can exit 0 and still hand the next step garbage, and on a cluster this happens more often than locally because of three mechanisms that rarely appear on a laptop.
Pipes that hide dead upstream commands. Unix reports the exit status of the last command in a pipe. If a command chain ends in something that succeeds on partial input, such as a compressor, a paginator, or a log writer, an upstream crash is invisible. gzip -c big.fastq | some_downstream_tool reports success even when gzip died halfway through the file, and the downstream tool happily processed a truncated stream. Snakemake wraps rule scripts in a bash strict mode that includes set -o pipefail, so a failed pipe member fails the rule. Nextflow's generated .command.sh uses a strict bash header as well, but the safest habit is to look inside .command.sh in the work directory and confirm, or add set -o pipefail explicitly in any script block that uses a pipe. Verification beats assumption here.
Tools that warn and continue. Many aligners and annotation tools skip problem records, print a note to stderr, and exit 0. A wrong reference genome is the classic case: the run completes, the BAM exists, and the mapping statistics quietly sag. This is why the troubleshooting table's row for "results differ" asks you to read stderr even for tasks that succeeded. On a cluster, where the reference path comes from a config parameter you may have typed by hand, this failure mode is common.
Debris from earlier kills. A step that died at its walltime limit may have left a partial output. If a later step overwrites rather than checks, or if the workflow manager's resume logic considers the timestamp sufficient, the corruption propagates. Snakemake's rerun-incomplete setting exists for this; Nextflow's -resume hashes task inputs and scripts, which catches most but not all forms of downstream drift.
Build verification into the workflow rather than into your memory. Count records (wc -l on plain text, the tool's own summary for binary formats), test compression integrity (gzip -t), and run cheap structural checks such as samtools quickcheck before downstream steps. Aggregate QC, for example a MultiQC step at the end of a read processing workflow, converts dozens of quiet per sample warnings into one visible report. Where results matter, checksum your final outputs and record them in the run report, so a rerun on a different node or a different month either matches or raises a question.
The trial of an automated hepatitis C messaging protocol across seven specialty clinics faced the same structural problem in a different domain: the same protocol produced different results at different sites, and the investigators caught that by tracking process measures such as facilitation and usability at each site [1]. Your workflow is the protocol, and your laptop and the cluster are the sites. Build the measures that would notice.
A Worked Diagnosis: Nextflow, From Failure to Root Cause
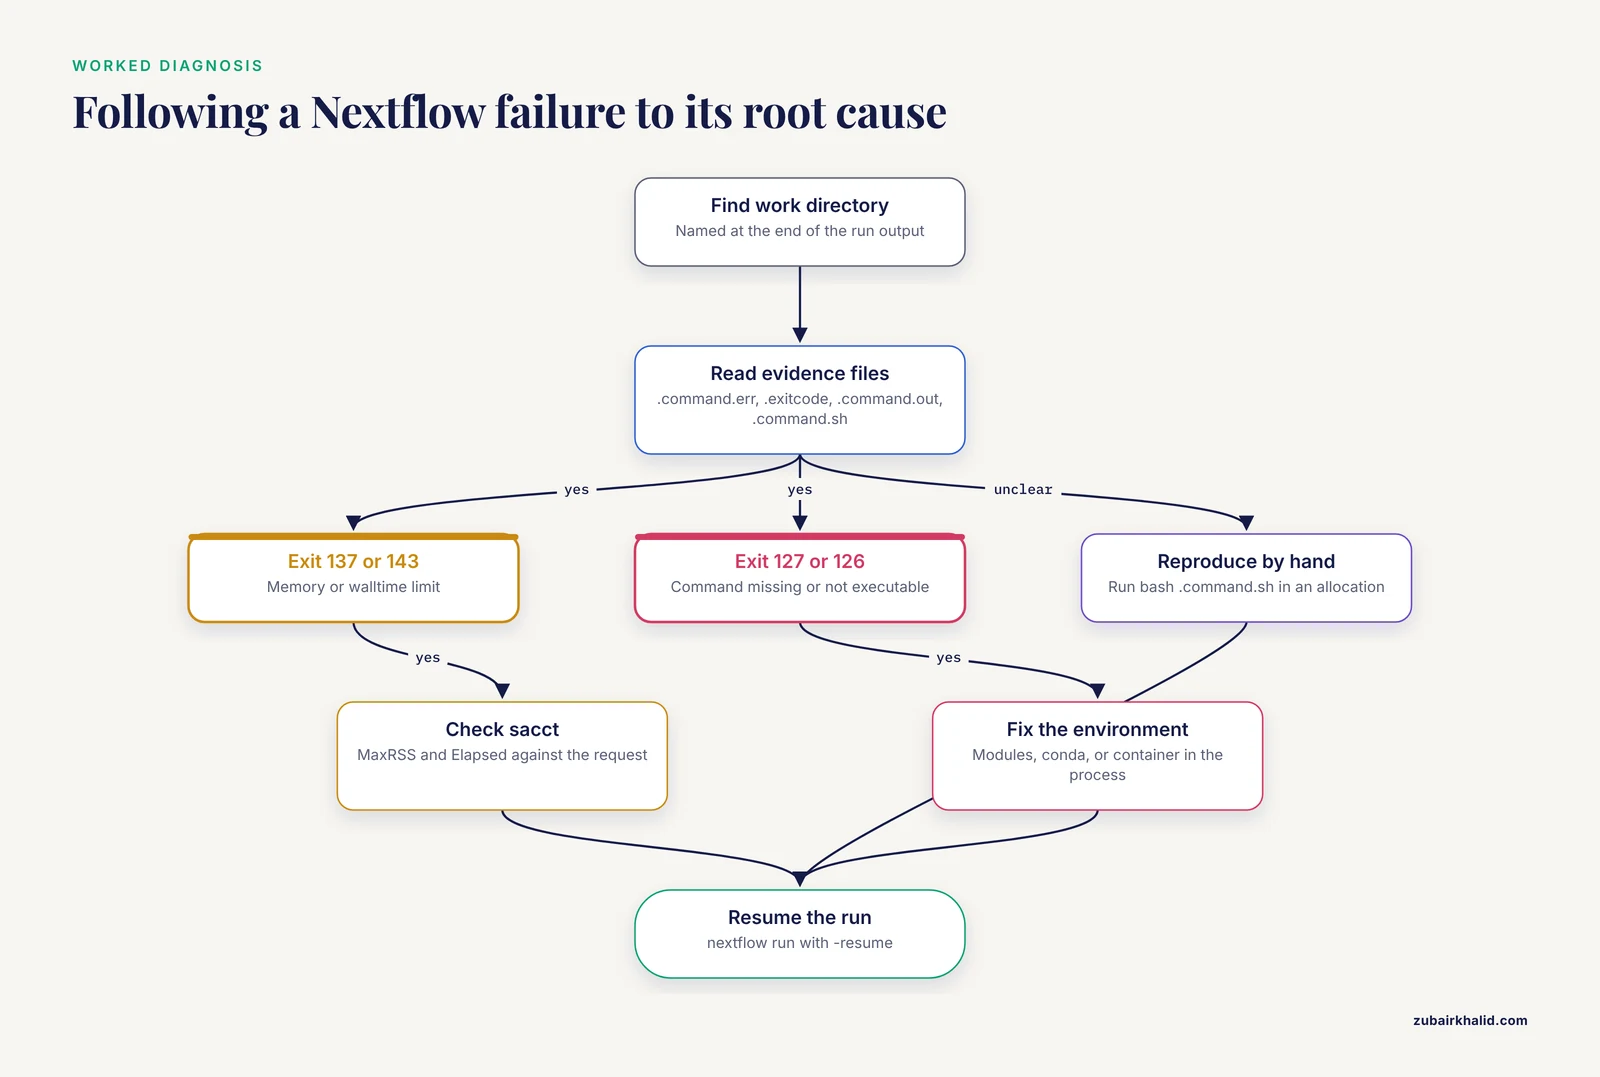
Here is the sequence a senior user actually follows, written as a repeatable procedure. Suppose a run of a small RNA seq pipeline fails overnight and the console shows a wall of task failures.
- Find the failed task's work directory. The end of the run output names it, for example
/scratch/yourname/nf-work/9f/e1a2b3.../. If the console text is gone, open.nextflow.login the launch directory and search forCommand error, or list past runs withnextflow logand inspect a specific one:
   nextflow log
nextflow log <run_name> -f hash,process,exit,status,duration- Read the four evidence files.
cdinto the work directory and read them in this order:
   cat .command.err    # the actual error message, almost always here
   cat .exitcode       # the number that determines everything else
   cat .command.out    # stdout, useful for partial progress
   cat .command.sh     # the exact script that ran, after variable substitution
Reading .command.sh is the step beginners skip. It shows what the variables actually became, which catches a malformed path or an empty parameter in seconds.
- If the exit code is 137 or 143, go to the scheduler. The job id appears in the submission wrapper
.command.runand in the log lines. Pull the accounting record:
sacct -j <jobid> -o JobID%20,State,ExitCode,MaxRSS,Elapsed -POUT_OF_MEMORY with a MaxRSS at or above your request means a sizing problem. TIMEOUT with an Elapsed near your time directive means the same for time.
- If the exit code is 127 or 126, the environment is the problem. The command was not found or not executable in the job shell. Fix it where the job runs: module loads, conda activation, or a container directive inside the process, never in your interactive shell.
- Reproduce by hand if the error is not obvious. Get an interactive allocation on the same partition (an interactive session is described in the debugging section below),
cdinto the work directory, and runbash .command.sh. You are now holding the failing command in your hands with the exact inputs staged.
- Fix at the right level. A memory problem is a directive for that process or label, not a note to self to rerun manually. A version problem is a container or lockfile, not a manual module load.
- Resume, do not restart.
nextflow run main.nf -profile cluster -resumereuses every task whose inputs and script are unchanged, so your fix costs one task's runtime, not the pipeline's.
The habit that separates fast diagnosis from slow diagnosis is reading .command.err before forming any theory. The error message is usually literal.
A Worked Diagnosis: Snakemake on Slurm
Snakemake failures present differently because the top level error names a log file. Consider the classic mid run stop: Missing output files for rule bam_index after 120 seconds. Two very different causes produce that message, and the procedure separates them.
- Open the run log. Snakemake writes a timestamped log under
.snakemake/log/. The failing job's own log path is printed in the error, typically under.snakemake/slurm_logs/with the cluster job id embedded in the filename on most setups. Read that job log first.
- Check the scheduler record for that job id.
sacct -j <jobid> -o JobID%20,State,ExitCode,MaxRSS,Elapsed -PIf the job actually died with OUT_OF_MEMORY or a tool error, you have a real failure and the fix is a resource change or a code fix.
- If the job succeeded but the output was missing at check time, it is filesystem latency. The file was written on a node and had not propagated far enough across the parallel filesystem when Snakemake's check ran. Confirm by
lsof the file path now; it is almost certainly there. The fix is a largerlatency-waitin the profile andretriesto absorb residual races. Snakemake marks interrupted or uncertain jobs as incomplete, andrerun-incomplete: truein the profile makes the next invocation clean them up automatically.
- Dry run to understand the plan after a fix.
snakemake -n -pwalks the DAG, prints the commands, and reports which jobs would run and with what resources. This is the cheapest way to confirm that a resource edit landed on the right rule and nothing else changed.
- Reproduce one rule by hand. Snakemake prints the full command when
printshellcmdsis on, so you can copy the exact command for the failing rule and run it inside an interactive allocation. Withuse-conda, the environment lives under.snakemake/conda/and its path appears in the log, so you can activate the identical environment by hand. One caveat: Snakemake normally verifies conda environment contents against checksums before running, and hand activation skips that verification, so use the manual route for diagnosis, not as a substitute for the manager.
- Force the fixed step to rerun. Removing the failed rule's output file makes Snakemake rerun it and everything downstream on the next invocation, which is the simplest and least error prone way to resume after a fix.
The Nextflow and Snakemake procedures converge on the same three questions: what did the task actually run, what did the scheduler actually record, and does the failure reproduce inside a real allocation. Answer those in order and most cluster failures resolve within a few attempts.
Reproduce the Job by Hand: Interactive Debugging on Compute Nodes
The single most valuable debugging skill on an HPC cluster is getting a shell that resembles a job. Debugging on the login node reproduces the wrong environment: login nodes usually have different cgroup enforcement, different resource limits, and often different filesystem mounts, so a fix that works there proves nothing.
The standard route with Slurm is salloc, which grants an allocation and drops you into a shell on a compute node or, on some sites, runs the shell wherever your session started while the resources are reserved. Either way the allocation enforces the same memory and CPU limits a batch job would see:
salloc -p general -t 02:00:00
hostname
module list
Request the same partition, and ideally similar memory and CPU settings, that the failing task used, so the reproduction is faithful. Inside that shell:
cdinto the task's work directory (Nextflow) or the working directory from the job log (Snakemake).- Confirm the environment:
which samtools,python -V,module list. Compare against what you expected. - Run the exact task script:
bash .command.shfor Nextflow, or the printed rule command for Snakemake. - Watch the process live in a second terminal or with
topin the same one. Memory growth curves tell you whether the tool scales with input size or hits a fixed structure. Thread counts tell you whether the tool respected your core request.
This procedure answers questions no log can: does the tool crash at startup or after minutes of work, does it fail on one particular input record, does it read the reference you think it reads. Interactive sessions are also where you test container pulls, conda environment solves, and filesystem writes before committing them to a pipeline configuration.
Two honest caveats. First, interactive allocations consume the same scheduler budget as batch jobs, so keep them short and release them; sitting in an idle allocation on a busy partition is exactly the behavior support staff notice. Second, an interactive shell is still not the job shell. It inherits more of your session state than a batch task does, so a fix that only works interactively should always be revalidated by an actual pipeline rerun. The right standard is that the fix lives in the configuration or the process script, where the scheduler can see it, not in your reflexes.
Turning sacct Output into Resource Directives
Guessing memory requests is how pipelines oscillate between OOM kills and weeks long queue waits. The workflow manager gives you the data to stop guessing. The procedure below turns one completed run into a sized configuration.
Step 1: collect per task measurements. Nextflow's trace report records peak memory per task directly:
nextflow run main.nf -profile cluster -with-trace trace.txtThe trace file includes columns for status, duration, CPU use, and peak resident memory per task. Sort or filter for the heaviest tasks and note which process and label they belong to. For Snakemake, the cluster job ids appear in the run and job logs; feed them to sacct in batches and record MaxRSS per job.
Step 2: group by process, take the maximum, add headroom. For each rule or process, the memory directive should cover the largest observed peak with room for a slightly larger input file. A common convention among pipeline developers is to add roughly a quarter to a half again as headroom and round to a clean value, because memory that is requested but unused is recoverable by the scheduler, while memory that is underrequested costs a full rerun. Avoid rounding up by an order of magnitude, which is how one process ends up blocking a whole node.
Step 3: encode tiers, not per task numbers. Most pipelines need two or three tiers, not dozens:
withLabel: low {
    cpus   = 2
    memory = 8.GB
    time   = 2.h
}
withLabel: highmem {
    cpus   = 8
    memory = 64.GB
    time   = 12.h
}
Assign labels to processes when you write them, and the configuration stays readable. In Snakemake the same idea is expressed as default-resources plus set-resources overrides per rule, for example align_reads:mem_mb=48000.
Step 4: account for the tool's own memory controls. Some tools take a memory flag (sorters are the usual example) that must agree with the scheduler directive. If the tool caps itself below the request, you pay for RAM it never uses; if it caps itself above the request, the kernel kills it. Align the two numbers deliberately.
Step 5: revalidate with the test profile. After resizing, run the small end to end test profile on the cluster. It should complete with no retries. Then run the real dataset and check the trace again; if some task now retries and succeeds, its directive was still too tight and one more adjustment settles it.
Treat retries as a safety net, not a sizing strategy. A pipeline whose correctness depends on every process exhausting maxRetries is a pipeline whose sizing was never measured, and on a busy partition each retry multiplies queue time.
Common Misconceptions That Cost Hours
"It worked locally, so the code is correct." Locally validated means validated on one site, with one dataset, one filesystem, and one scheduler shaped like nothing. The trial evidence from multi site protocols applies directly: sites differ in measurable ways even under an identical protocol, and the differences surface only when you measure at each site [1]. Assume nothing transfers until the test profile passes on the cluster.
"More memory fixes everything." Raising a memory directive is correct when MaxRSS shows the task genuinely needed it. But some OOM kills are algorithmic: a script that reads a whole table into a Python list will consume any allocation on a large enough input, and the honest fix is streaming or chunking the code, not requesting half a terabyte. Before raising memory, ask whether the tool has a streaming or index backed mode. Raising memory to hide an algorithmic problem also wastes shared resources, which is the fastest way to lose the goodwill of your system administrators.
"The scheduler is buggy." Schedulers kill jobs that exceed their requests because shared clusters would otherwise be unusable. When a job dies with 137 or 143, the scheduler almost always did what someone asked it to do. The bug is nearly always in the request.
"Containers solve everything." Containers solve software versions, which is the largest cause category, but not paths, staging, quotas, node local scratch, or resource limits. A containerized pipeline still needs the shared cache directory, still needs images pulled where the network exists, and still needs its inputs staged into the task directory. Teams that treat containers as a complete solution are surprised by the remaining half.
"A quick test on the login node is fine." Two problems. First, it violates most usage policies and is visible. Second, and more practically, it is misleading: the login node has no memory enforcement, so an OOM condition cannot reproduce there, and its module set often differs from the compute partitions. A five minute interactive allocation is the correct quick test.
"Retries will fix it." Retries absorb transient filesystem races and undersized first attempts. They do not fix wrong paths, missing modules, or broken code, which fail identically on every attempt. If a task fails on attempt three exactly as it failed on attempt one, the cause is deterministic and retries are just delay.
"Exit code 0 means the step worked." Covered in depth above, and worth repeating as a rule of practice: verify outputs, not exit codes, for every step whose output feeds a result you will publish.
Nextflow vs Snakemake for Debugging on a Cluster
The comparison table in the main article covers features. For day to day cluster debugging, the differences that matter are narrower and more practical: where the evidence lives, how resume behaves after a fix, and how quickly the ecosystem hands you a tested configuration.
Where the evidence lives. Nextflow concentrates evidence per task in the work directory: .command.sh, .command.err, .command.out, .exitcode, plus the submission wrapper. Once you know the pattern, any failed task is diagnosed with the same four files, and the trace report gives per task resource accounting. Snakemake concentrates evidence in per run and per job logs under .snakemake/, with the failing job's log path printed in the error. Both are adequate; the Nextflow layout is slightly easier to teach because the files have fixed names, while Snakemake's log naming varies more with version and executor plugin.
Resume semantics after a fix. Nextflow's -resume hashes each task's inputs, script, and container, so editing one process reruns only that process and its dependents, and it does this across runs, which suits iterative tuning of one heavy step. Snakemake decides from the DAG and file timestamps and metadata, so reruns after a fix are targeted by default, and incomplete metadata from interrupted runs is handled by rerun-incomplete. Practically, both tools let you iterate on a single failing step cheaply, which is the property that matters when the cluster queue is an hour deep.
Conda and container ergonomics. Snakemake's use-conda builds environments itself from YAML specs, which is convenient but makes the first run sensitive to solver speed and to whether the launching node has network access. Nextflow delegates environment provisioning to conda or container directives per process and leans harder on the container path, which on HPC means Apptainer. On clusters where compute nodes lack internet, both tools require the same discipline: build or pull on the login node into a shared cache before launching.
Ecosystem leverage. This is where the difference is largest in practice. nf-core pipelines ship with test profiles, parameter schemas, containers, and cluster tuned configs already written, so adopting one replaces a large fraction of the debugging this article describes with running a documented test first. Snakemake's ecosystem offers wrappers and community rules with similar integration into bioconda, but the turnkey, pre tuned cluster pipeline catalog is smaller. If your problem is "I need this analysis running reliably on our cluster by Friday," the ecosystem often decides the choice before the language does.
Team language. The remaining honest differentiator: Snakemake is Python, so a Python fluent team can read and modify rules without learning a second syntax. Nextflow is Groovy based, which reads like Java flavored scripting; the DSL covers most needs without deep Groovy, but debugging an unusual edge case rewards someone comfortable with the underlying language. Choose the one your team can debug at 5 pm on a deadline, because that is when cluster failures actually happen.
Build a Test Profile That Catches Cluster Failures Before the Real Run
Every cause in this article, except raw dataset size, can be caught by a five minute end to end test run on the target cluster. Building that test profile is an afternoon of work that repays itself the first time it saves you from discovering a missing module three hours into a real run.
Step 1: shrink the data honestly. For sequencing data, subsample reads rather than truncating files, because a truncated compressed file fails decompression and teaches you nothing. Many aligners and QC tools ship their own tiny test data. For variant or expression inputs, take the first few hundred records with the tool's own subsetting options or a plain head on plain text, and re compress cleanly. The goal is not realism, it is exercising every code path.
Step 2: shrink the reference only if the tool allows it. Some tools require a full reference and cannot run on a subset chromosome safely. Where a subset works, a small contig slice makes the test faster. Where it does not, accept the cost; a test that lies about its inputs is worse than a slow one.
Step 3: wire it as a parameter, not a fork. Keep one pipeline, and make the test data a parameter set. In Nextflow, a test profile that overrides params.input and resource directives; in Snakemake, a config file config/test.yaml with the subset paths and reduced resource requests. The pipeline code stays identical between test and production, which is the whole point: the test exercises the real code.
Step 4: run it on the cluster, on the real partition. This is the step people skip. A test run on your laptop validates the code; a test run on the cluster validates modules, containers, staging, queue names, and scheduler integration in the environment that matters. Run it after every configuration change, and rerun it after cluster maintenance windows, because module versions and partitions change underneath you more often than anyone announces.
Step 5: assert on outputs, not just completion. Make the test fail if the final outputs are absent, empty, or below a sane size, and check a summary statistic or two. A test that only checks exit status inherits the silent failure problem described earlier.
Step 6: keep the test data pointers version controlled. Commit the URLs or checksums of the test inputs so the profile is reproducible on a new cluster, which is also how you onboard a collaborator: their first run is the test profile, and its success tells both of you that their environment is sound before any real data moves.
Measure the test the way the multi site trial measured its rollout, with explicit process measures at each site rather than a single end of study verdict [1]. The test profile is your process measure, and running it at every site, meaning every cluster you use, is what turns "works on my machine" from an excuse into a checked claim.
A Pre-Launch Checklist for Cluster Runs
Run this list before any real dataset hits a scheduler. It compresses the entire article into ninety seconds of reading.
Environment
- Every process loads its modules, activates its conda environment, or declares its container inside the workflow, not in shell startup files.
- Tool versions are pinned by container, lockfile, or explicit module names, and the versions are recorded in the run report.
- Java version verified for Nextflow launches, or the appropriate runtime module loaded.
- The test profile has passed on this cluster and partition since the last change to the configuration.
Resources
- Memory and time directives exist for every process, sized from measured MaxRSS and Elapsed, with labels for tiers.
- Retry logic configured with scaling attempts, understood as a safety net rather than a plan.
- Thread environment variables (
OMP_NUM_THREADS,OPENBLAS_NUM_THREADS,MKL_NUM_THREADS) sized to the allocation. - The work directory is on scratch or project storage with quota headroom, not under home.
Scheduler
- A profile naming the executor exists, and a bare launch without a profile is not possible by habit.
- Queue or partition names in the config match the current site documentation, checked after the last maintenance window.
- The launch command includes the shared work directory path and resume support.
Data
- Input paths are absolute and exist on shared storage reachable from compute nodes, verified inside an allocation at least once.
- References checksummed and recorded; index files built with the pinned tool version.
- Input validation in the first process catches truncated files, mixed compression, and duplicate sample ids early.
Failure handling
- Publish mode set so final outputs are real copies, and cleanup procedures respect that work directories may hold unpublished results.
latency-waitandretriesraised appropriately for the site's filesystem.- You know, before launching, which log files you will read first when it fails.
Most clusters have some institutional version of this discipline. The implementation science literature offers a useful frame: complex protocols succeed across sites when the sites track their own process measures and adapt deliberately rather than assuming uniformity [1]. A checklist is exactly that, a process measure you keep for your own practice. Writing it down once and using it every launch is the difference between a workflow that fails informatively and one that fails mysteriously.
When to Escalate: Writing a Ticket Support Can Act On
Sometimes the cause is genuinely site level: a misconfigured module tree, a partition draining for maintenance that nobody announced, a filesystem with a pathological latency spike, a quota change. At that point the fastest path forward is a good support ticket, and the difference between a ticket answered in an hour and one answered in a week is almost entirely the evidence you include.
Include, in this order:
- Job ids. The scheduler ids of the failing jobs, so support can pull
sacctand their own logs immediately. One or two representative ids are enough, not forty. - The exact launch command and configuration. The full
nextflow runorsnakemakecommand, the profile contents, and the relevant process or rule definitions. Attach files rather than pasting if they are long. - The task level evidence. The work directory path and
.command.errfor Nextflow, or the job log path for Snakemake, plus the exit code. - What changed. "Worked last Tuesday, fails today" is a useful sentence only when followed by what is different: a new dataset size, an edited config, a module update notice, a moved reference path.
- What you already ruled out. Stating that MaxRSS was well under the request, or that the command reproduces interactively, saves the support staff a round trip.
Ask a specific question. "The pipeline fails" is not answerable; "why does module load samtools resolve to version X in my batch jobs but version Y in my interactive sessions" is.
Keep a run log as you debug: date, launch command, profile, outcome, fix. After three failures you will notice patterns that no single failure reveals, such as one process that OOMs only on particular sample types, or failures that cluster after maintenance windows. This is the same habit the multi site trial used, capturing how the protocol actually behaved at each site rather than reconstructing it from memory after the fact [1], and on a shared cluster it has a second benefit: your run log is often the evidence that lets support distinguish your problem from the site's.
One final framing note for the whole article. None of the fixes here require you to become a systems administrator. They require you to treat the cluster as a site with a measurable environment, to verify rather than assume, and to put your knowledge into the workflow's configuration where the scheduler can act on it. Every hour spent on directives, test profiles, and checklists is repaid the first time a failure produces a clear error in sixty seconds instead of a mysterious one at midnight.
Further Reading
- NGS and the design of an optimized phage display workflow for peptide discovery.
- Q-LEASE: Lifecycle-bound zero-trust authorization for HPC-to-QPU job handoffs.
- LC-HRMS and Molecular Networking for Non-Targeted Screening of Emerging Contaminants in Cosmetics: Workflow, Applications, and Regulatory Challenges.
- Unlocking the future potential of SWATH-MS: Advancing non-target screening workflow for the qualitative and quantitative analysis of emerging contaminants.