UniProt Expression Data Not Showing?
By Dr. Zubair Khalid, DVM, MS, PhD ·

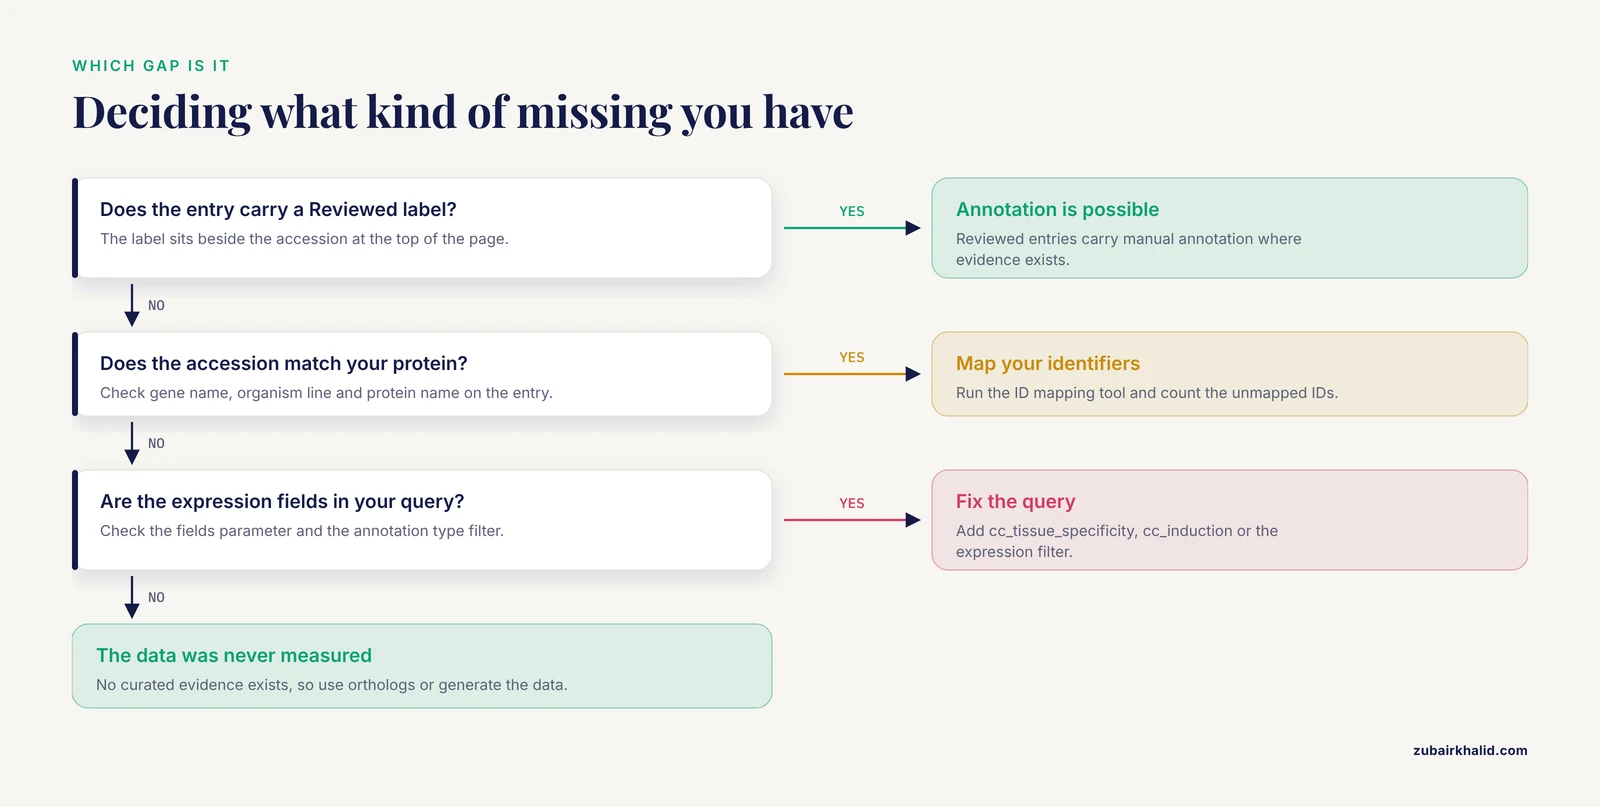
The most common cause of missing expression data in UniProt is simple: you have landed on an entry that has no curated expression annotation, usually because the entry is unreviewed (a TrEMBL record) or because no experimental or imported evidence exists for that protein. The first thing to check is the entry's review status, the small "Reviewed" or "Unreviewed" label next to the accession at the top of the UniProtKB page. If the entry says "Unreviewed," the absence of an Expression section is expected behavior, not a bug.
A close second cause is identifier confusion. You searched a gene symbol, alias, or old name, UniProt resolved it to a different protein, an isoform, or an ortholog, and the expression annotation sits on a record you never opened. This article walks through the causes of uniprot expression data missing from a page or a download, from the most frequent to the rarest, gives you a short diagnostic sequence you can run in under five minutes, and covers what to do when the gap is not in UniProt but in the underlying experimental data itself. Missingness in gene expression measurements is a well documented problem in high throughput biology, and knowing where that missingness originates changes how you should interpret both UniProt and your own datasets [1], [2], [3].
Quick Diagnostic: Six Steps for Missing UniProt Expression Data
Run this sequence in order before you write any code or contact any help desk.
- Confirm the entry exists. Search the gene name plus organism, for example
TP53 human, at uniprot.org. If the search returns nothing, skip to the identifier mismatch section below. - Check review status. On the entry page, look at the label next to the accession (for example, P04637 for human p53). "Reviewed (Swiss-Prot)" entries carry manual annotation including expression information where evidence exists. "Unreviewed (TrEMBL)" entries are computationally annotated and rarely carry a populated Expression section.
- Read the Expression section on the page. UniProt presents expression information in several places: the "Tissue specificity" free-text comment, the "Induction" comment, and interactive views contributed by partner resources such as Bgee, the Human Protein Atlas, and PaxDB. A thin Tissue specificity line is not the same as no data.
- Open the cross-references. Scroll to the Cross-references section and look for links to expression databases. Those external resources often hold far more tissue-level detail than the UniProt page itself displays.
- Test the REST API. Download the entry programmatically and confirm the expression fields are populated (a working command appears later in this article). Blank columns in a bulk download are usually a fields parameter problem, not missing data.
- Check orthologs. If your protein has no expression data in your organism of interest, open the Orthologs view and check the human, mouse, or rat entry. Expression evidence for a well studied ortholog tells you the biology is probably annotated somewhere, and it points you to which resource to mine.
If all six steps come up empty, the expression information for your protein genuinely has not been measured or curated. Later sections cover what that means and how to work around it.
Troubleshooting Table
| Symptom | Likely cause | How to confirm | Fix |
|---|---|---|---|
| Entry page has no Expression section at all | Entry is unreviewed (TrEMBL) or no curated evidence exists | Look for the "Unreviewed" label beside the accession | Filter searches with reviewed:true, or pull expression from linked resources such as Bgee or the Human Protein Atlas |
| Search box returns no entry | Gene symbol is obsolete, an alias, or spelled differently | Search by full gene name, then by organism | Use the UniProt ID mapping tool to convert your identifier list to UniProt accessions |
| Entry exists but the tissue you care about is absent | Curators imported data for some tissues only, or the source study did not cover that tissue | Open the cross-references to expression databases | Query the linked resource directly, or check ortholog entries |
| REST or TSV download shows blank expression columns | The fields parameter omits expression field types | Compare the API URL against a known good query | Add cc_tissue_specificity, cc_induction, or the expression annotation filter to the query |
| Data appeared yesterday but is gone today | You cached a different entry version, or the entry was merged into another accession | Check the entry version number and the merged history at the bottom of the page | Follow the redirect to the merged accession and refresh your saved URLs |
| Bulk retrieval returns rows for only some of your IDs | Some identifiers failed to map, or your list mixes accession versions and gene names | Count returned rows against submitted rows | Re-map failed IDs through the ID mapping service and handle isoform-level accessions separately |
| You expected RNA expression data | UniProt annotates protein-level expression, not transcript abundance | Confirm which molecule you need | Use transcript-level resources for RNA, or use the UniProt RNA cross-references to reach nucleotide records |
UniProt Expression Data Missing Causes, Ranked by Frequency
Understanding why a field is empty helps you decide whether the gap is recoverable, whether it matters for your analysis, and whether a workaround exists.
UniProt is a curated knowledgebase, not a raw expression warehouse
UniProtKB is a protein sequence and function database. Its Expression section records curated statements about where and when a protein is expressed, imported from the scientific literature and from partner resources, together with evidence tags that tell you how strong each statement is. UniProt does not store raw RNA-seq counts, microarray intensities, or mass spectrometry peaks. If your mental model is "UniProt is where I download expression matrices," the fix is to treat UniProt as an annotation layer and pull quantitative data from the resources it links to.
This distinction matters because annotation is expensive. Trained biologists read papers and transfer facts onto entries. Expression annotation only appears when a curator or an importing pipeline has evidence to attach. A protein discovered recently, or a protein family studied only in structural work, can have a complete sequence record with a rich set of cross-references and no expression section whatsoever.
Reviewed versus unreviewed entries
UniProtKB contains two sections. Swiss-Prot entries are manually reviewed, and TrEMBL entries are computationally annotated and remain unreviewed until curators work through them. The Expression section, with its curated Tissue specificity and Induction comments, is overwhelmingly a reviewed-entry feature. When uniprot expression data not showing is your complaint, checking this one label resolves the majority of cases.
Practical consequences:
- Searching with
reviewed:truein the query string restricts results to curated entries and dramatically increases the chance of populated expression fields. - For human proteins, the reviewed entry almost always exists, so a missing Expression section there usually means a data gap rather than a status problem.
- For non-model organisms, most entries are unreviewed. If your protein of interest is a fish, a fungal species, or a recently sequenced pathogen, expect sparse expression annotation and plan to use orthology.
Organism coverage is uneven
UniProt mirrors the published literature and the deposited data. Model organisms accumulate expression evidence faster than everything else. If you work on a well studied organism and still see nothing, suspect an identifier problem. If you work on a poorly characterized organism, the absence of expression data is an honest reflection of what has been measured, and the realistic path forward is to reason through orthologs or to generate the data yourself.
You May Be Looking at the Wrong Entry
Gene and protein identifiers drift
Gene nomenclature changes, aliases multiply, and older publications use names that no longer match current standards. A search for an alias can resolve to the wrong species, a related gene family member, or nothing at all. Before concluding that UniProt lacks data, confirm that the accession you are reading actually corresponds to your protein. Check the gene name, the organism line, and the protein name on the entry page.
The robust fix is identifier mapping. Collect your gene symbols or Ensembl IDs in a plain text list, open the UniProt ID mapping tool, choose the source identifier type and the target type (UniProtKB reviewed, for example), and submit. The output gives you a table of your original identifier paired with the UniProt accession, including unmapped IDs. Any identifier that fails to map is a candidate cause of downstream missing rows.
Isoforms and canonical sequences
Many human proteins have multiple UniProt entries or annotated isoforms derived from alternative splicing. Expression annotation is usually attached at the level of the canonical entry, not per isoform. If you navigated from a transcript or isoform identifier, you may have opened a record that inherits little annotation. Navigate up to the canonical entry, read its Expression section, then return to the isoform for sequence-level questions.
Merged entries and version history
UniProt merges duplicate records over time. When two entries describing the same protein are merged, one accession redirects to another, and a saved URL from months ago may land you on the survivor entry. That entry can differ in version number and sometimes in annotation content. If a colleague's screenshot showed expression data and yours shows none, compare the entry version and accession at the top of both pages before assuming anything was deleted.
The Data Exists but Not Where You Are Looking
The web page compresses, the resources expand
The UniProt page shows a curated summary. The full depth of expression evidence usually lives one click away in cross-references. For human proteins, the Human Protein Atlas provides tissue and cell-type immunohistochemistry plus RNA consensus data. Bgee provides curated and normalized expression calls across tissues and developmental stages for multiple species. PaxDB provides integrated absolute protein abundance estimates. Proteomics resources provide mass-spectrometry-based evidence. If the UniProt page says only "Tissue specificity: Widely expressed," the linked resources may still give you per-tissue scores, images, and quantification.
Make a habit of this order of operations: read the curated comment for the reliable summary, then follow the cross-reference for the quantitative detail, then, if you still need more, go to the raw repositories the resource itself cites.
API and bulk retrieval failures
Most complaints about uniprot expression data missing in bulk workflows trace to the query, not the database. Two field types matter. The comment fields that carry expression text are requested explicitly, and the annotation type filter selects entries that carry any expression annotation. A minimal working example, using standard UniProt REST syntax:
curl "https://rest.uniprot.org/uniprotkb/search?query=(gene:TP53) AND (organism_id:9606) AND (reviewed:true)&fields=accession,id,gene_names,cc_tissue_specificity,cc_induction&format=tsv"If your download is missing columns entirely, you omitted the field from fields. If you want only entries that carry expression annotation, add AND annotation:(type=expression) to the query string. If your file comes back with zero rows, quote the gene name, verify the organism taxon ID, and check that your shell did not strip the URL parameters.
For batch jobs, retrieve results in a streaming fashion rather than requesting thousands of rows in one page, and always count returned rows against your submitted identifier list. A row count mismatch is the earliest and cheapest signal that some identifiers failed to map.
Expecting RNA data from a protein database
A recurring misunderstanding: UniProt annotates proteins. Its Expression section describes protein-level expression, and Tissue specificity comments frequently synthesize both protein and transcript evidence, but the database is not a transcriptome browser. If your analysis requires RNA-level quantification, go to a nucleotide or expression archive, not to UniProt. Mixing the two levels without acknowledgment is one of the errors described below under Common Mistakes.
When the Underlying Experiments Never Measured the Protein
Sometimes UniProt is fine, your identifiers are fine, and the expression data is missing because the experiments themselves contain gaps. This is a structural feature of high throughput biology, and it has been characterized in detail.
Where missingness in expression data comes from
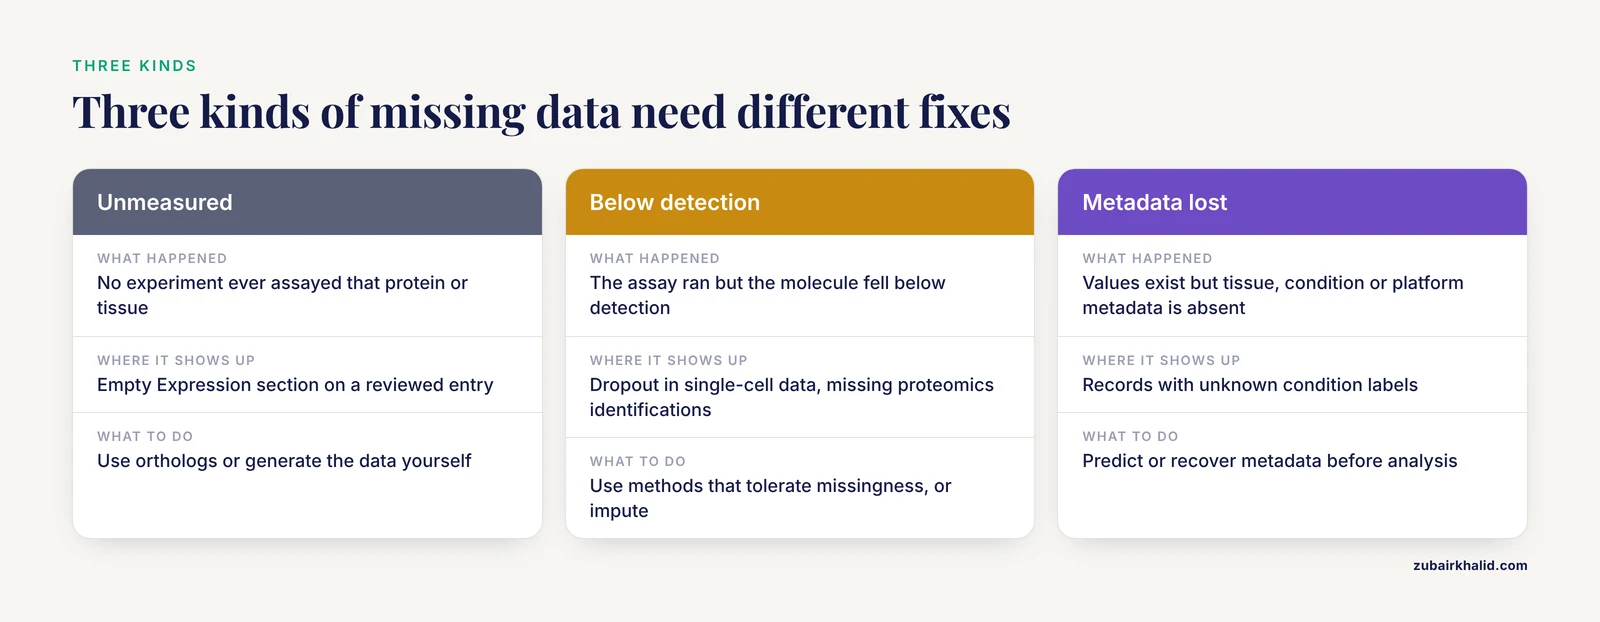
In single-cell RNA sequencing performed with droplet-based 3' protocols, genes documented as expressed by other methods can be entirely absent or drastically underrepresented. The dominant causes are reads mapping just beyond annotated gene boundaries because of incomplete 3' UTR annotation, intronic reads from unannotated exons or pre-mRNA, and reads discarded because of gene overlaps. Each mechanism blinds the analysis to thousands of genes even in well characterized mouse and human genomes [1]. In differential network analysis of multi-platform data, missing values such as dropout events in single-cell datasets are frequent enough that estimation methods must be designed around them explicitly [2]. In discovery proteomics, missing values correspond to proteins not identified in a given sample, and imputing large numbers of them can materially distort downstream differential analysis [3]. In cross-cohort work, truncating to genes observed across every cohort, the current common practice, excludes real biology, and imputation methods can reasonably recover genes when total missingness stays below roughly 20 percent [4].
The relevance to UniProt is direct. Curated expression statements derive from these same measurement technologies. If a technology systematically fails to detect a gene, or if a study dropped samples with incomplete profiles, the literature that feeds annotation contains fewer or weaker expression statements, and UniProt reflects that.
What imputation can and cannot fix
If you are handling your own expression matrix and missing values block your analysis, you have two honest options: impute, or use a method that tolerates missingness. The imputation literature is large, and the methods divide into a few families.
Neighbor-based methods are the workhorse. The classic k-nearest neighbor approach estimates a missing value from similar genes or samples, and refinements continue to improve it. One extension applies ordered weighted averaging operators to the aggregation of neighbors and reports lower error than baseline neighbor models across six published gene expression datasets at missing rates from 1 to 20 percent [5]. A distance-based iterative sequential variant combines a modified Euclidean distance with the Pearson correlation coefficient and reuses estimates iteratively, outperforming widely used techniques on both time-series and non time-series microarray data [6]. Another method integrates K-means with spectral clustering and applies a weighted nearest-neighbor rule within each cluster, showing that local similarity approaches remain effective across datasets of varying dimensionality [7].
Knowledge-guided methods improve on expression-only approaches by borrowing structure from biology. A Gene Ontology-based similarity measure links microRNAs to functional annotations through their target genes and combines that semantic similarity with expression similarity to impute microRNA profiles, a useful strategy because microRNAs lack direct functional annotation of their own [8]. Graph neural networks can leverage biological networks of gene regulation, but a naive application to raw expression data can actually degrade imputation. Normalizing the expression data first and weighting the message-passing scheme mitigates the inconsistency between data and network knowledge, and the resulting method produced consistently lower mean absolute error than state-of-the-art generic imputers across two biological networks [9].
Ensemble and optimization-based methods combine several learners. One approach applies bootstrap sampling across multiple component imputers, learns optimal weights in closed form by minimizing a cost function on observed values, and shows improved accuracy, robustness, and generalization over single-learner methods at different noise levels and missing rates [10]. A bee-based algorithm that guides k-nearest neighbors with linear regression and uses GINI importance scores for value selection reported 15 to 25 percent higher classification accuracy from imputed datasets relative to the original incomplete data, framing imputation as an optimization of discriminative power rather than a recovery of true values [11]. Multiple imputation, which generates several imputed datasets and combines results, consistently produced lower normalized root mean squared error and better gene clustering than three single-imputation methods across three cancer gene expression profiles [12]. A review of computational recovery techniques catalogs the broader design space [13], and a methods-series chapter summarizes the standard algorithm families for laboratory practitioners [14].
For classification workflows specifically, an evaluation on hepatocellular carcinoma gene expression data with 40 observations and 54,675 features found that mean imputation outperformed k-nearest-neighbor imputation and no imputation for classification performance with XGBoost, a useful reminder that the simplest method can win depending on the task and data shape [15].
Sometimes the best solution is to avoid imputation entirely. ProtRank ranks proteins by their observed changes relative to changes observed for other proteins, incorporates missing values directly without imputing them, and remains robust while producing results similar to a state-of-the-art differential expression method [3].
Spatial and cross-platform recovery
Two newer problem settings deserve mention because they explain a specific pattern of "missing" that confuses people comparing datasets. Spatial transcriptomic technologies profile only a limited number of genes at subcellular resolution, so most genes appear missing in any spatial dataset. Methods such as VISTA predict expression levels of unobserved genes by jointly modeling spatial and single-cell data with variational inference and geometric deep learning, enabling downstream applications including detection of spatially variable genes and ligand-receptor interactions [16]. Where spatial and single-cell data are unpaired, deep generative models such as gimVI integrate the two modalities and impute held-out genes, outperforming alternative integration methods on real datasets.
If you compared a spatial dataset against a whole-transcriptome resource and concluded that expression data was missing, the comparison itself was the problem. Matching the technology to the question prevents that failure before it happens.
Metadata Gaps: A Different Kind of Missing Expression Data
A second category of missingness deserves its own diagnosis. Sometimes the expression values exist but the metadata describing them, such as tissue, disease state, treatment, or platform, is absent, which makes the data unusable even though the numbers are present. Missing metadata is common enough in public repositories that researchers frequently classify affected datasets as useless. A machine learning framework built to predict missing metadata demonstrated that when missing variables are accurately predicted, the corresponding gene expression data can be reliably reused in downstream analyses such as differential expression, and that using only the subset of predictions that can be made accurately, quantified through a metric called the Proportion of Cases Accurately Predicted, outperforms pipelines built on standard classification metrics [17].
In the UniProt context, this problem appears when entries lack the structured annotation that would allow automated pipelines to join expression facts to the right tissue or condition. A deep neural network with an attention mechanism has been applied to predicting missing types in linked data using UniProt as a case study dataset, reflecting active work on filling annotation gaps computationally [18]. The practical lesson for your own project is to check metadata completeness before analysis, not after, and to treat records with unknown condition labels as a distinct failure mode from records with no expression measurement at all.
How to Use UniProt for Expression Questions: A Working Tutorial
This short uniprot database tutorial consolidates the fixes above into a repeatable workflow.
Step 1. Start from a gene and organism. At uniprot.org, type the gene symbol and organism name, for example GAPDH human. The results page separates reviewed from unreviewed hits. Prefer the reviewed entry unless you have a specific reason not to.
Step 2. Read the entry strategically. On the entry page, open these sections in order: the review status label, the Expression section with Tissue specificity and Induction comments, and the Cross-references block. Note the evidence tags attached to each expression statement. Evidence tags such as "Experimental evidence" carry more weight than imports or similarity-based statements.
Step 3. Filter the whole database by expression. In the search bar, build a query such as reviewed:true AND organism_id:9606 AND annotation:(type=expression) to list human reviewed entries carrying expression annotation. This converts UniProt from a per-protein lookup into a set retrieval tool.
Step 4. Download through the REST API. Use the curl command shown earlier, adding every field you need. For programmatic pipelines, request TSV format for spreadsheets and JSON for code, and record the entry version number with your results so the download is reproducible.
Step 5. Follow cross-references for depth. Open the Bgee, Human Protein Atlas, or PaxDB links on your entry of interest for tissue-level quantification and images. Treat UniProt as your curated index into these resources.
Step 6. Bridge to orthologs when your organism is sparse. Use the Orthologs view to find curated relatives, then decide explicitly whether orthology-based inference is acceptable for your question, and say so in your methods.
Common Mistakes and Limitations
- Concluding "no data" from an empty section on an unreviewed entry. TrEMBL records are computationally annotated. Absence of expression text there is the default state, not evidence of absence in biology.
- Confusing protein-level and RNA-level expression. UniProt annotates proteins. Comparing its expression statements directly against an RNA-seq matrix without acknowledging the molecule-level mismatch produces contradictions that are artifacts of the comparison.
- Skipping the ID mapping step. Gene symbol lists passed straight into UniProt search fail silently for obsolete names and aliases. Map identifiers first and count unmapped IDs.
- Assuming imputed values are measured values. Imputation methods are built to improve downstream tasks, sometimes prioritizing classification accuracy over faithful recovery of original values [11]. Report imputation in your methods, and prefer methods that tolerate missingness when the imputed fraction is large [3].
- Imputing beyond what the methods support. Cross-cohort assessments indicate that LASSO and LLS imputation perform reasonably when total missingness stays below about 20 percent, and truncation to common genes discards real biology, so neither extreme truncation nor aggressive imputation of very sparse data is defensible without validation [4].
- Applying graph-based imputation naively. Raw expression data fed to a graph neural network without normalization and message-passing weights can yield worse results than generic imputers [9].
- Trusting any single resource as ground truth. UniProt, Bgee, the Human Protein Atlas, and proteomics repositories summarize different evidence types with different biases. Where they disagree, the disagreement is information.
- Individual experimental design still requires expertise. This guide covers database and data handling workflows. Interpretation of expression findings for a specific biological or clinical question needs review by a qualified specialist in that domain.
Prevention: Building a Workflow That Fails Loudly
Prevention in this context means designing your retrieval and analysis steps so that missing data announces itself.
- Record provenance. Save the UniProt accession, entry version, and retrieval date with every download. Version-aware citations make silent data changes detectable.
- Validate row counts at every transfer. After each mapping or download step, assert that output rows equal expected rows. Mismatches surface identifier problems immediately instead of weeks later.
- Use reviewed-entry filters by default. Build queries with
reviewed:trueunless you deliberately want computational annotation, and document the choice. - Separate the three kinds of missing. In your own datasets, label whether a value is missing because it was unmeasured, because it fell below detection, or because metadata linking it to a condition was lost. Each type has a different remedy, and conflating them corrupts downstream statistics.
- Test your imputation. Mask known values in your matrix, run your chosen imputer, and measure error before trusting it on real gaps. This takes minutes and prevents the most expensive class of silent failure.
Frequently Asked Questions
Why does my UniProt entry have no Expression section at all?
Most often the entry is unreviewed, meaning it is a TrEMBL record with computational annotation only, or no curated expression evidence exists for that protein. Check the review status label beside the accession, then try the reviewed-entry filter and the cross-references to expression databases.
Does UniProt provide RNA expression data?
No. UniProt is a protein database, and its Expression section describes protein-level expression with curated tissue specificity and induction comments. For transcript-level quantification, use an expression or nucleotide resource and treat UniProt as the protein annotation layer.
How do I download expression data for many proteins at once?
Use the UniProt REST API with an explicit fields parameter requesting the expression comment fields, and add the expression annotation type filter to the query if you want only annotated entries. Map your identifiers first and verify that the returned row count matches your input list.
Why do UniProt, the Human Protein Atlas, and Bgee disagree about expression?
The resources summarize different evidence types, including curated literature, immunohistochemistry, normalized transcript data, and proteomics, each with its own detection biases. Disagreement usually reflects different technologies and thresholds rather than an error, so treat the union and the conflicts as informative.
Can I trust expression data on unreviewed UniProt entries?
Treat it cautiously. Unreviewed entries carry computational annotation, and expression information there is sparse and less rigorously supported than on reviewed entries. For expression questions, rely on reviewed entries and on the primary resources linked from them.
How should I handle missing values in my own expression dataset?
First characterize the missingness, then choose between imputation and missingness-tolerant analysis. Neighbor-based, knowledge-guided, and ensemble imputers all have published support, and for proteomic differential analysis you can bypass imputation entirely with ranking methods that handle missing values directly.
My protein shows expression in UniProt but my experiment detected none. What now?
Check that you measured the same molecule type, tissue, condition, and developmental stage as the annotated evidence, and read the evidence tags on the annotation. Technical detection limits in your assay, especially dropout in single-cell data or missing identifications in proteomics, are common explanations.
How current is UniProt expression data?
UniProt releases updated entries on a regular cycle, and each entry carries a version number that changes when annotation changes. Record the version and retrieval date with your downloads so you can reproduce exactly what you saw, and re-check entries whose data drives important conclusions.
Sources
- Enhanced recovery of single-cell RNA-sequencing reads for missing gene expression data
- WDNE: an integrative graphical model for inferring differential networks from multi-platform gene expression data with missing values
- ProtRank: bypassing the imputation of missing values in differential expression analysis of proteomic data
- Assessment of Imputation Methods for Missing Gene Expression Data in Meta-Analysis of DistinctCohorts of Tuberculosis Patients
- Improved KNN Imputation for Missing Values in Gene Expression Data
- A novel distance-based iterative sequential KNN algorithm for estimation of missing values in microarray gene expression data
- Usage of Clustering and Weighted Nearest Neighbors for Efficient Missing Data Imputation of Microarray Gene Expression Dataset
- Missing value imputation for microRNA expression data by using a GO-based similarity measure
- Impute Gene Expression Missing Values via Biological Networks: Optimal Fusion of Data and Knowledge
- An efficient ensemble method for missing value imputation in microarray gene expression data
- Missing value imputation on gene expression data using bee-based algorithm to improve classification performance
- A comparison of single imputation and multiple imputation methods for missing data in different oncogene expression profiles
- Computational techniques to recover missing gene expression data
- Missing-Values Imputation Algorithms for Microarray Gene Expression Data.
- Performance Evaluation XGBoost in Handling Missing Value on Classification of Hepatocellular Carcinoma Gene Expression Data
- VISTA Uncovers Missing Gene Expression and Spatial-induced Information for Spatial Transcriptomic Data Analysis
- Maximizing the reusability of gene expression data by predicting missing metadata
- Missing Types Prediction in Linked Data Using Deep Neural Network with Attention Mechanism: Case Study on DBpedia and UniProt Datasets