Experimental vs. Predicted Localization in UniProt
By Dr. Zubair Khalid, DVM, MS, PhD ·

Experimental localization in UniProt means a subcellular location that curators supported with direct, published laboratory evidence, while predicted localization means a location assigned by computational analysis of the protein sequence or by transfer from related proteins. The two annotation types carry different confidence levels, and UniProt labels each one explicitly so you can tell them apart.
This distinction matters because subcellular location constrains what a protein can actually do. A kinase confined to the cytosol cannot phosphorylate a nuclear transcription factor until it translocates, and a membrane transporter mislocalized in a disease state changes the behavior of an entire tissue. Researchers who build protein interaction networks, prioritize disease candidate genes, or interpret proteomics results rely on localization data as a biological filter, so knowing whether a location was measured in a laboratory or computed from a sequence determines how much weight it deserves [1]. UniProt sits at the center of this workflow as a hub that collects both experimental annotations from the literature and automated, rule-based, or machine-learning predictions, then presents them side by side in a single entry [2].
What Does Experimental vs. Predicted Localization in UniProt Actually Mean?
Subcellular localization is the compartment, structure, or membrane where a protein carries out its function, such as the nucleus, mitochondrion, plasma membrane, or extracellular space. UniProt stores this information in a controlled vocabulary of location terms so that every entry describes location in the same words, which makes large-scale analysis possible [2].
When you open any UniProt entry, the Subcellular location section can contain three kinds of statements:
- Experimentally validated locations. A curator read a peer-reviewed paper that used a direct method such as immunofluorescence microscopy, cell fractionation, or tagged-protein imaging, and entered the location with a citation to that paper.
- Locations inferred by similarity. The location was demonstrated experimentally for an orthologous protein in another organism, and UniProt transferred the annotation with the qualifier "By similarity."
- Predicted locations. No direct experimental evidence exists for the protein or a close ortholog, so the location comes from sequence analysis, such as detection of a signal peptide, transmembrane helices, or a machine-learning model trained on labeled sequences.
Every one of these statements carries a visible evidence tag. In the web interface, experimental evidence is highlighted in gold, "By similarity" in a distinct color, and predicted or computational evidence in silver. This color and evidence-tag system is the practical answer to the question of what uniprot experimental vs predicted localization means: it is a confidence label attached to each location claim, produced either by a laboratory experiment or by an algorithm, and curated into the entry by a human or an automated pipeline [2].
How UniProt Annotates Subcellular Location, Step by Step
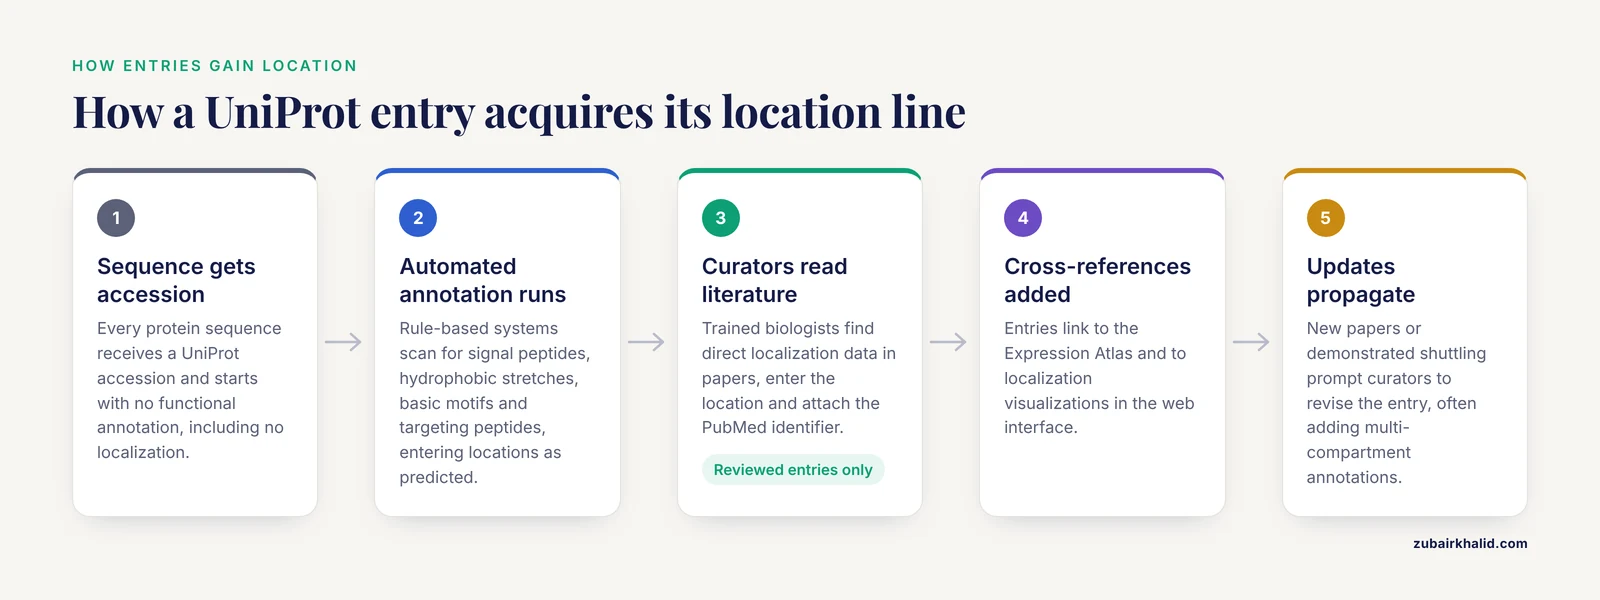
Understanding how an entry acquires its location line helps you interpret it correctly. UniProt operates two linked sections of the Knowledgebase, one holding expertly curated entries reviewed by literature and one holding automatically annotated entries, and the localization workflow differs between them [2].
Step 1: The sequence enters the Knowledgebase
Every protein sequence, whether from a genome project or a direct submission, receives a UniProt accession. At this point it has no functional annotation at all, including no localization.
Step 2: Automated annotation runs first
Before any human looks at the entry, rule-based systems scan the sequence. These systems look for features that imply location: an N-terminal signal peptide suggesting secretion, hydrophobic stretches suggesting transmembrane segments, an arginine-rich motif suggesting nuclear import, or a targeting peptide suggesting import into mitochondria. Any locations produced this way enter the entry as predicted annotations with computational evidence tags.
Step 3: Curators review the literature for reviewed entries
For entries in the curated section, trained biologists search the published literature for direct localization data. If a paper reports where the protein was observed, the curator enters the location, attaches the PubMed identifier, and selects the appropriate evidence category. Detailed annotation extracted from the literature by expert curators covers well over half a million proteins in the Knowledgebase, and localization is one of the most heavily curated annotation types [2].
Step 4: Cross-references connect the entry to complementary resources
The location section does not stand alone. UniProt links entries to expression resources such as the Expression Atlas, which aggregates gene and protein expression studies across tissues, cell types, and species, and integrates that data back into EMBL-EBI resources including UniProt itself [3]. UniProt also added dedicated data visualizations for subcellular localization, structure, and interactions to the web interface, so a reader can see a protein positioned among cellular compartments graphically rather than as text alone [2].
Step 5: Updates propagate
When a new paper reports a different location, or when a protein is shown to shuttle between compartments, curators revise the entry. Multi-compartment annotations are common and biologically real, for example for receptors that internalize from the plasma membrane or transcription factors that translocate into the nucleus in response to ligands.
A Practical UniProt Database Tutorial for Localization
Here is a concrete walkthrough for a single human protein, which you can repeat for any accession.
- Go to uniprot.org and type the gene name or accession into the search bar. Restrict the search to "Reviewed" if you want expertly curated entries only.
- Open the entry and scroll to the "Subcellular location" section near the top. Read the location terms first, then the qualifiers: look for phrases such as "By similarity" or "Predicted" and for the colored evidence dots beside each claim.
- Click an evidence tag. It expands to show the source, which for experimental data is a cited publication with a PubMed link, and for predicted data is the computational method that produced the call.
- Open the "Features" tab and look for location-relevant sequence features: SIGNAL for a signal peptide, TRANSMEM for transmembrane helices, DOMAIN for targeting domains, and MOTIF for short import or retention signals. Each feature also carries its own evidence tag.
- Follow the cross-references. The Expression Atlas link shows in which tissues and conditions the transcript or protein is detected, which complements the location statement with expression context [3].
- If you need many proteins at once, use the UniProt REST API or the batch download from the search results page. Retrieving the subcellular location lines for a full proteome is a single tab-separated-values download with "Subcellular location" selected as a column.
This is the core of how to use UniProt for localization work. The same pattern, read the claim, then read the evidence behind the claim, applies to every annotation type in the entry.
How Experimental Localization Is Determined in Practice
To judge experimental annotations, you need to know what the underlying experiments look like. Several standard methods produce the data curators enter as gold evidence.
Fluorescence microscopy and immunostaining
Immunofluorescence labels a protein with a fluorescent antibody and images its position in intact cells or tissue sections. In pancreatic cancer studies, for example, researchers used immunofluorescence and co-immunofluorescence in human tumor specimens to place the invadopodia proteins TKS5 and Cortactin at invadopodia structures, combining cell-line data with patient-derived tissue to confirm that the localization observed in culture held in actual tumors [4]. Semi-quantitative immunohistochemistry extends this to formalin-fixed tissue, where software such as ImageJ Fiji performs deconvolution of hematoxylin and DAB stained images so that expression and localization can be measured and compared across samples in a reproducible way [5].
Epitope and fluorescent tagging at the endogenous locus
When antibodies are unavailable or unreliable, researchers insert standardized immunoepitopes or fluorescent tags into the endogenous gene. In Drosophila, a full suite of genomic resources supports tagging genes with standardized epitopes or fluorescent proteins at their native locus, which reports proper expression, subcellular localization, and live imaging dynamics of the encoded protein. Tagging at the endogenous locus is emphasized because it preserves native regulation, whereas overexpression constructs frequently mislocalize proteins as an artifact of excess abundance [6].
Cell fractionation
Fractionation physically separates a cell into nuclear, membrane, cytosolic, and mitochondrial fractions, then identifies the protein in each fraction by western blot or mass spectrometry. Studies of the aryl hydrocarbon receptor in the human placenta combined cell fractionation with immunofluorescence microscopy and found constitutive nuclear localization of AhR in every placental model examined, in the absence of any deliberately added exogenous activator, which suggested intrinsic activation by endogenous placental ligands [7]. Similarly, work on the SVCT2 transporter in breast cancer cell lines used immunofluorescence colocalization assays together with cellular fractionation experiments to establish subcellular localization, and paired that with tissue microarray immunostaining analyzed through the Human Protein Atlas resource [8].
Mass spectrometry proteomics of isolated compartments
Large-scale proteomics of purified organelles or membrane preparations assigns many proteins at once. Databases such as MOPED organize this kind of protein-level expression data so users can browse results by organism, tissue, localization, and condition, sorted by false discovery rate and expression level, and link directly out to UniProt and pathway resources [9]. In a complementary approach, single-cell proteomics methods that measure proteins with oligo-conjugated antibodies require careful normalization, because unbound antibodies encapsulated during droplet generation create protein-specific noise that computational tools now correct using background signal from empty droplets [10]. Misinterpreting background antibody signal as genuine protein presence is exactly the kind of artifact that can contaminate localization datasets.
The limits of experimental data
Every experimental method has failure modes. Antibodies can cross-react. Overexpressed tagged proteins can mislocalize. Fractionation can leak proteins between fractions. A protein can genuinely live in two compartments, and a single experiment in a single cell line under a single condition may capture only one of those states. Reviews of individual proteins illustrate this depth: the S100A6 calcium-binding protein has decades of work on its expression, localization, and binding partners, and the literature still leaves aspects of its behavior incompletely resolved [11]. Experimental does not mean complete, it means measured under stated conditions.
How Predicted Localization Is Generated
Predicted annotations come from algorithms, and knowing the algorithm families explains both their power and their blind spots.
Motif and feature detection
The simplest predictors scan for sequence signatures. An N-terminal signal peptide of about 15 to 30 hydrophobic residues with a cleavage site predicts secretion or entry into the secretory pathway. A stretch of 20 to 25 hydrophobic residues predicts a transmembrane helix and therefore membrane association. A cluster of basic residues predicts a nuclear localization signal. These rules are fast, transparent, and wrong for every exception, which is why UniProt marks their output as predicted rather than experimental.
Mitochondrial targeting prediction
Mitochondrial proteins deserve a specific example because their precursors carry N-terminal targeting peptides that encode both organelle destination and submitochondrial sorting into the outer membrane, inner membrane, intermembrane space, or matrix. Dedicated computational methods detect these targeting peptides, predict cleavage site positions, and assign the final submitochondrial compartment, with benchmarked web servers available for discriminating human mitochondrial proteins and their destinations [12]. Prediction is essential here because only a fraction of mitochondrial proteins have experimentally characterized targeting peptides, yet the sequence signal is strong enough for algorithms to generalize [12].
Deep learning on sequence alone
The DeepLoc system represents the machine-learning end of the spectrum. It uses a recurrent neural network that processes the entire protein sequence, combined with an attention mechanism that identifies the sequence regions most relevant to localization, and it relies only on sequence information rather than annotation of homologues. The model was trained and tested on a dataset extracted from a UniProt release in which experimentally annotated proteins follow more stringent criteria than before, and it achieved 78 percent accuracy across 10 localization categories and 92 percent accuracy for the simpler membrane-bound versus soluble distinction, outperforming state-of-the-art algorithms that relied on homology information [13]. Two points in that design matter for interpretation. First, the training set was built from experimentally annotated UniProt entries, so predictions inherit the biases of the experimental literature. Second, sequence-only prediction is deliberately aimed at novel proteins and sequence variants where no annotated homologue exists, which is precisely the situation where no gold annotation can exist yet [13].
Why prediction is indispensable
Most of the proteins in the UniProt Knowledgebase, which spans over 120 million sequences, will never be individually studied in a laboratory, and detailed literature curation applies to a small subset [2]. For the long tail, computed annotation is the only annotation. Prediction is not a substitute for experiment, it is the scalable floor that keeps the database usable.
Experimental vs. Predicted Localization in UniProt: Side-by-Side Comparison
The table below contrasts the two annotation types and the related terms most often confused with them.
| Attribute | Experimental localization | Predicted localization | By similarity (related term) | Uncertain (related term) |
|---|---|---|---|---|
| Source of evidence | Direct laboratory measurement published in a cited paper | Computational analysis of the sequence, or a machine-learning model | Experiment on an orthologous protein, transferred to this one | Conflicting or weak evidence of any kind |
| Confidence in the interface | Gold highlighting | Silver highlighting | Separate color category | Explicit qualifier on the location line |
| Typical supporting methods | Immunofluorescence, cell fractionation, endogenous tagging, compartment proteomics | Signal peptide detection, transmembrane prediction, targeting peptide models, deep learning networks | Comparative genomics curation | Curator judgment over contradictory data |
| Strength | Ground truth under stated conditions | Covers proteins no one has studied, works for novel sequences and variants | Reasonable when orthologs are close and function is conserved | Prevents overclaiming |
| Weakness | Cell-type, condition, and method dependent, limited coverage | Inherits training-set bias, fails on unusual or dual-localized proteins | Fails when localization is species-specific | Provides no direction |
| Best use | Reference standard, disease gene prioritization, mechanistic studies | First-pass annotation of new genomes, variant interpretation, hypothesis generation | Filling gaps in well-conserved protein families | Flagging proteins for targeted follow-up |
The confidence labels are not decoration. When researchers integrate subcellular compartment data with protein-protein interaction networks to prioritize disease candidate genes, the significance assigned to each compartment and the edges in the weighted network depend on the reliability of the localization input, which is why annotation quality propagates directly into downstream biological conclusions [1].
Interpreting Disagreements Between Experimental and Predicted Annotations
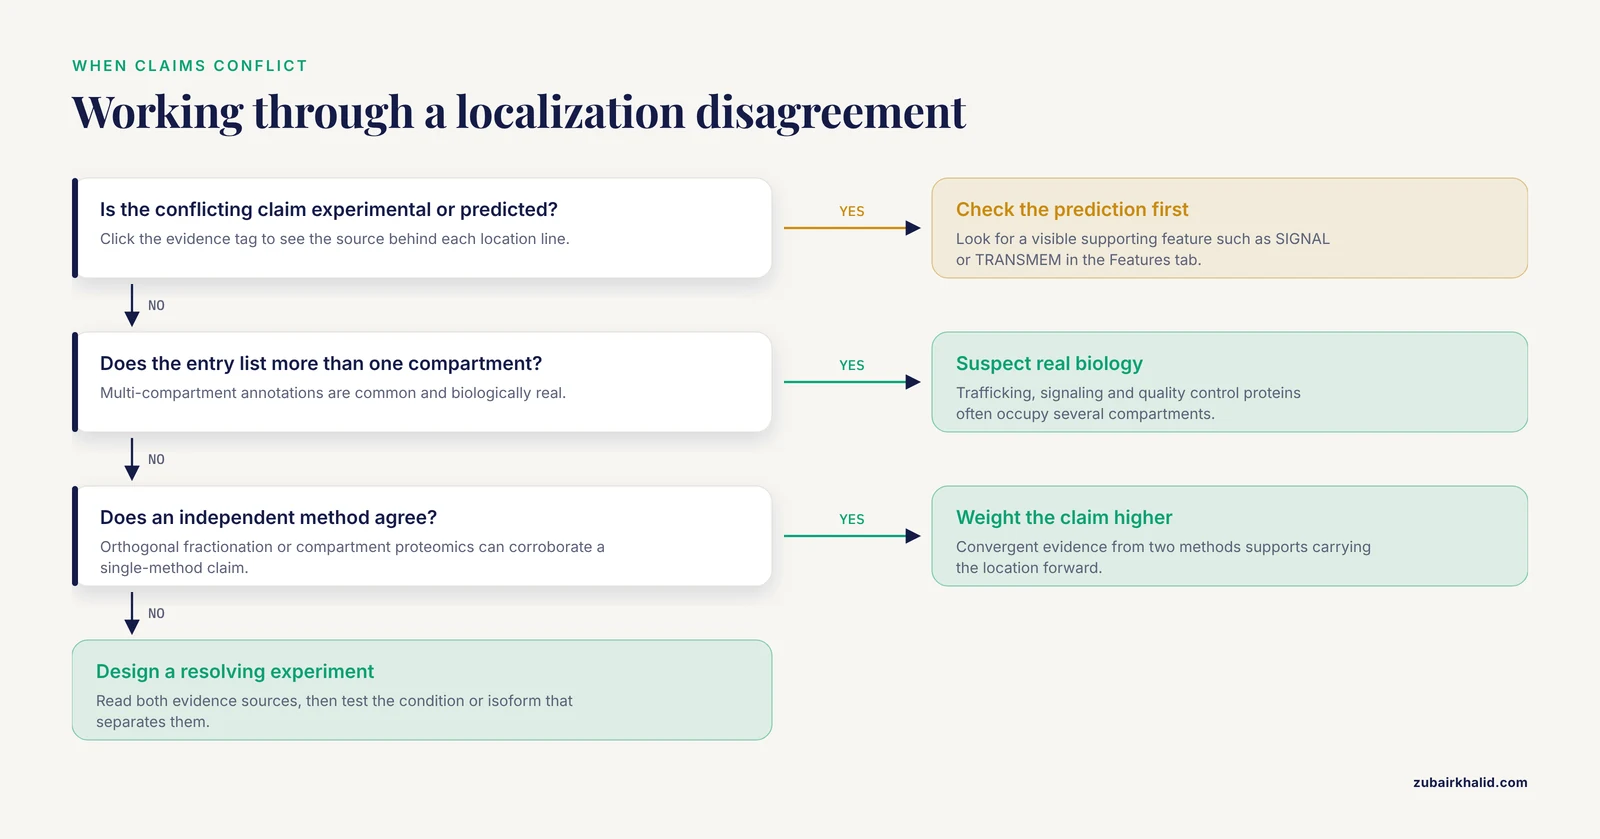
Disagreement is common and informative. Treat it as a question to investigate, not an error to dismiss.
Case 1: The prediction missed a real location
A protein annotated as cytosolic by sequence-based prediction turns out, by immunofluorescence, to associate with the plasma membrane through a transient interaction or a lipid modification the algorithm cannot see. The experimental line wins, and the sequence feature responsible becomes a lesson in what current predictors ignore.
Case 2: The experiment captured only one state
A predicted secreted protein is found in the cytosol in one experiment. Both may be right. Proteins with leader sequences can retain a cytosolic pool before secretion, and condition-dependent translocation is normal behavior for signaling proteins. The experimental annotation documents one observed state, and the entry may eventually carry several location lines, each with its own evidence.
Case 3: The prediction and experiment both look weak
Old experimental data produced with a cross-reacting antibody can be wrong in the same way an overconfident predictor can be wrong. When a location claim rests on a single method in a single paper, check whether independent work, such as orthogonal fractionation data or a compartment proteomics resource, supports it [9]. This is the core skill in uniprot experimental vs predicted localization interpretation: weigh the evidence, the method, and the biological plausibility together rather than defaulting to either gold or silver.
Case 4: The protein is genuinely multi-compartment
Algorithm outputs usually return a single best category, while curated entries can list multiple locations with qualifiers. If a predictor returns one compartment and the entry lists three, suspect biology rather than error, especially for proteins involved in trafficking, signaling, or quality control.
Using Localization Annotations in Real Analyses
Localization data from UniProt is an input to many standard workflows, and the experimental versus predicted distinction changes how you use it.
Disease gene prioritization. Integrating subcellular compartment data with protein-protein interaction networks allows researchers to define the significance of each compartment, build edge-weighted networks, detect protein complexes through non-negative matrix factorization, and prioritize candidate disease genes, a strategy demonstrated for breast cancer that generalizes to other disorders [1]. In such pipelines, genes with experimental localization carry more weight than genes whose compartments rest on prediction alone, or the pipeline can run sensitivity analyses that down-weight predicted annotations.
Proteomics interpretation. When a mass spectrometry study detects a protein in a purified nuclear fraction, matching that detection against the UniProt location and its evidence type distinguishes confirmation of a known localization from a novel observation. Browsing resources organized by localization and condition, with false discovery rate information attached, supports exactly this kind of comparison [9].
Expression context. A location tells you where a protein can act, an expression profile tells you where it is present. The Expression Atlas connects thousands of studies across species and feeds integrated data into UniProt, so the location line and the expression profile should be read together when you judge whether a localization claim is biologically relevant in your tissue of interest [3].
Variant and isoform interpretation. Sequence-only predictors exist precisely to handle novel proteins and sequence variants, so a variant that disrupts a predicted targeting peptide can be flagged computationally even when the wild-type protein has never been localized experimentally. The accuracy figures for DeepLoc give a realistic sense of what such flags are worth, strong for membrane versus soluble, moderate for fine-grained compartment calls [13].
Common Mistakes and Limitations
- Treating silver as failure. Predicted annotations are computed from features that are often correct. Discarding every predicted location throws away usable information for the vast majority of proteins that will never receive individual experimental study.
- Treating gold as universal truth. An experimental annotation describes one organism, cell type, and condition. Nuclear localization in a HeLa cell line does not guarantee nuclear localization in a hepatocyte, and the annotation carries no guarantee about condition-dependent behavior.
- Reading the location line without the evidence tag. The single most common UniProt error is quoting a location in a paper without checking whether it was experimental, transferred by similarity, or predicted. The tag is one click away and changes the claim's strength completely.
- Confusing "By similarity" with prediction. Similarity-based annotation rests on experimental work in an ortholog, which is a different kind of support than sequence-feature prediction, though both are non-experimental for the specific protein in front of you.
- Ignoring isoforms. Localization can differ between isoforms, and UniProt can annotate location per isoform. Summarizing the entry's first location line for all isoforms of a gene is a frequent and avoidable mistake.
- Overexpressing to observe. GFP fusion constructs driven by strong promoters routinely mislocalize proteins. Endogenous-locus tagging exists because native expression levels matter to correct localization, a principle established clearly in tagging work in complex organisms [6].
- Expecting predictions to capture regulation. Computational tools see the sequence, not the phosphorylation state, ligand binding, or interaction partners that control translocation. A predicted cytosolic protein can translocate to the nucleus minutes after stimulation, and no sequence scanner can know that.
- Forgetting experimental noise sources. Protein measurement methods carry artifacts, from antibody background in droplet-based single-cell assays to cross-reactivity in tissue staining, and localization conclusions built on uncorrected signal inherit those artifacts [10], [5].
Quick Review
- Experimental localization carries published laboratory evidence, highlighted in gold, with a cited paper one click away.
- Predicted localization is computed from sequence features or machine-learning models, highlighted in silver, and marked "Predicted."
- "By similarity" transfers an experimental result from an ortholog, which is neither direct experiment nor pure prediction for your protein.
- DeepLoc predicts localization from sequence alone with 78 percent accuracy across 10 categories and 92 percent for membrane versus soluble, and it was trained on stringently curated experimental UniProt data [13].
- Mitochondrial targeting peptides can be detected computationally, including cleavage sites and submitochondrial destination, because the sequence signal is strong enough to generalize [12].
- Standard experimental methods include immunofluorescence, cell fractionation, endogenous-locus tagging, and compartment proteomics, each with known artifacts [6], [8], [4], [5], [7].
- Localization annotation quality propagates into downstream analyses such as network-based disease gene prioritization [1].
- More than 120 million proteins have sequences in UniProt, and literature curation with detailed expert annotations covers a small fraction, which is why prediction remains necessary [2].
Three Worked Examples: Reading Localization Claims Like a Reviewer
The fastest way to internalize the experimental versus predicted distinction is to walk through real research situations where localization was established, and to ask what a curator saw when reading each paper. The three examples below are drawn from published studies of different protein types, and each one teaches a different lesson about what "experimental" actually guarantees.
Worked Example 1: A Nuclear Receptor Measured Two Independent Ways
The aryl hydrocarbon receptor, a ligand-activated transcription factor, was examined in human placental models using cell fractionation combined with immunofluorescence microscopy. The striking result was constitutive nuclear localization in every placental model examined, in the complete absence of any deliberately added exogenous activator, which the authors interpreted as intrinsic activation by endogenous placental ligands [7]. Suppose you are evaluating this protein for your own project. The lesson is not merely that the receptor sits in the nucleus. The lesson is the shape of the evidence: two orthogonal methods, microscopy and fractionation, agreed with each other, and the conclusion was tested across multiple models rather than a single culture dish. When a UniProt entry carries a gold-tagged location for a protein like this, that tag stands behind exactly this kind of convergent work. Conversely, if you find only a single-method claim, your confidence should drop a notch even though the tag color is the same.
A second lesson hides in the phrase "in the absence of any deliberately added exogenous activator." Localization experiments are performed under stated conditions, and a receptor that occupies the nucleus constitutively in placental tissue may behave differently in a hepatocyte exposed to an environmental ligand. Experimental does not mean universal. It means measured, here, under these conditions, with these reagents.
Worked Example 2: A Transporter Where Tissue Context Carries Part of the Claim
The SVCT2 transporter was studied in breast cancer cell lines using immunofluorescence colocalization assays together with cellular fractionation to establish its subcellular localization, and the authors paired that cellular work with tissue microarray immunostaining analyzed through the Human Protein Atlas resource [8]. This design stacks three evidence layers: a dynamic imaging readout in living-cell models, a biochemical fractionation readout, and a tissue-level spatial readout across patient samples. Notice that these layers answer different questions. The cell-line work answers "where does the protein sit inside a cell," while the tissue microarray answers "in which tissue compartments and tumor regions is the protein detected." A reader who quotes only the compartment-level answer while ignoring the tissue-level answer, or vice versa, has discarded half the evidence design.
When you audit a gold-tagged location in UniProt, ask which of these layers the cited paper actually delivered. An entry supported by a study with this architecture deserves more weight than an entry supported by one image in one cell line, even though both are labeled experimental.
Worked Example 3: A Location Defined Relative to a Structure, Not an Organelle
In pancreatic cancer, researchers used immunofluorescence and co-immunofluorescence in human tumor specimens to place the invadopodia proteins TKS5 and Cortactin at invadopodia structures, deliberately combining cell-line data with patient-derived tissue to confirm that the localization observed in culture held in actual tumors [4]. This example teaches two things. First, subcellular location is not always an organelle name. A protein can be localized to a specialized structure within a compartment, and the biological meaning of that finer placement can be enormous, in this case relating to invasive behavior in cancer. Second, the translation from cell line to patient tissue is itself an experimental result that required its own confirmation. A location demonstrated in a culture model and then verified in patient specimens is a stronger claim than either alone, and studies that explicitly make this translation, as this one did, are the ones whose conclusions age well.
A practical reading habit follows from all three examples: when you click a gold evidence tag in UniProt, you are not clicking a guarantee, you are clicking a door into a specific study with a specific design. Spend the thirty seconds to understand the design, and the distinction between experimental and predicted stops being a color code and becomes a judgment you actually own.
Auditing an Experimental Annotation Before You Trust It
Gold highlighting tells you that a curator found published laboratory evidence. It does not tell you the evidence is good. Before an experimental location claim anchors a decision in your project, run it through a short audit. The checklist below takes minutes per protein and catches most of the problems that matter.
1. Identify the method behind the tag. Click the evidence indicator and read the cited paper's methods, or at least its abstract. Immunofluorescence, cell fractionation, endogenous-locus tagging, and compartment proteomics each carry different failure modes, and knowing which one produced the claim tells you what could have gone wrong.
2. Identify the model system. Was the location measured in a human cell line, a primary culture, a whole organism, or patient tissue? The Drosophila tagging literature makes the general point sharply: tagging at the endogenous locus preserves native regulation and reports proper localization, whereas overexpression constructs frequently mislocalize proteins as an artifact of excess abundance [6]. A claim built on an overexpressed fusion protein is experimental, but it is experimental under an artificial condition, and you should weight it accordingly.
3. Check for orthogonality. The strongest experimental annotations rest on at least two independent methods. The AhR study combined fractionation with microscopy [7], and the SVCT2 study combined colocalization imaging with fractionation and tissue-level staining [8]. Single-method claims are not wrong, but they are one instrument reading away from an artifact.
4. Check the condition and stimulation state. Localization is dynamic. A protein photographed under basal conditions may translocate minutes after stimulation, and a protein imaged after ligand treatment may be cytosolic at rest. The annotation records a snapshot; your experiment may occur in a different frame of the movie.
5. Check whether the measurement was quantified. Semi-quantitative immunohistochemistry with computational image analysis, such as deconvolution of hematoxylin and DAB stained images in ImageJ Fiji, allows expression and localization to be compared across samples in a reproducible way [5]. A quantified measurement supports cross-study comparison; a single representative micrograph does not.
6. Look for independent corroboration. If the claim rests on one paper, see whether a compartment proteomics resource or a second study independently detects the protein in the same compartment. Resources that organize protein-level expression data by organism, tissue, localization, and condition, sorted by false discovery rate, exist precisely to support this kind of cross-check [9].
7. Note the annotation's age. Curation reflects the literature available when the entry was last revised. A location entered years ago may predate better antibodies, better tags, or the discovery of a translocation behavior. This is not a flaw in the database; it is a reason to check whether newer work exists.
Running a claim through these seven questions converts a color code into an evidence assessment, which is the actual skill that the experimental versus predicted distinction exists to support.
Auditing a Predicted Annotation: What the Sequence Evidence Really Shows
Predicted annotations are frequently dismissed as guesses, and just as frequently over-trusted as facts. Both errors come from not looking at what the prediction is actually made of. A predicted location is a chain of reasoning from sequence features to compartment, and you can audit every link.
Reading the Features tab as a localization fingerprint
Open the Features tab of the entry and read it as a narrative about the sequence. A SIGNAL feature marks an N-terminal signal peptide, which predicts entry into the secretory pathway. TRANSMEM features mark transmembrane helices, and counting them tells you the protein's membrane topology class. DOMAIN and MOTIF features mark targeting domains and short import or retention signals. Each feature carries its own evidence tag, so a feature can itself be experimentally demonstrated or merely predicted. When the features and the Subcellular location line agree, the prediction has a visible chain of reasoning. When they disagree, for example a location line that says cytosol while the features tab shows two clear transmembrane helices, you have found something to investigate before you trust either statement.
Knowing what each predictor family can and cannot see
Rule-based feature detection is transparent but brittle. It reads hydrophobic stretches, cleavage sites, and basic residue clusters, and it is wrong for every exception. Deep-learning predictors read the whole sequence and generalize further, but they inherit the composition of their training data. DeepLoc, the sequence-only recurrent network with an attention mechanism, was trained on a dataset extracted from a UniProt release whose experimentally annotated proteins follow more stringent criteria than before, and it reached 78 percent accuracy across 10 localization categories and 92 percent for the membrane versus soluble distinction [13]. Read those numbers as a user would. The binary soluble versus membrane call is strong enough to build on. The fine-grained ten-way call is good but leaves roughly one assignment in five wrong, and errors will concentrate where training examples are rare and where proteins genuinely occupy several compartments.
The mitochondrial case shows why prediction earns its place. Mitochondrial precursors carry N-terminal targeting peptides that encode both organelle destination and submitochondrial sorting into the outer membrane, inner membrane, intermembrane space, or matrix, and dedicated computational methods detect these peptides, predict cleavage positions, and assign the final compartment, because the sequence signal is strong enough to generalize even though only a fraction of mitochondrial proteins have experimentally characterized targeting peptides [12]. Here prediction is not a weak stand-in for experiment; it is the only scalable route to a compartment call, with a quantified, benchmarked error rate.
A three-question audit for any predicted location
First, what feature supports the call, and is that feature visible in the entry's own annotation? Second, does the prediction agree with the location of characterized homologues, keeping in mind that similarity transfer rests on real experiments in an ortholog? Third, is the failure mode of this predictor family relevant here? Predictors cannot see phosphorylation state, ligand binding, or interaction partners, so any localization controlled by regulation rather than by a static sequence motif lies outside their reach. If your protein is a signaling component, a predicted compartment is a starting hypothesis with an expiration date attached to the first experiment that tests it.
How UniProt Localization Fits with Complementary Resources
The Subcellular location line answers one question: where does this protein carry out its function, and on what evidence. Surrounding resources answer adjacent questions, and mature workflows read them together rather than treating UniProt as the whole story.
The Expression Atlas aggregates gene and protein expression studies across tissues, cell types, and species, and integrates that data back into EMBL-EBI resources including UniProt itself [3]. It answers a presence question: in which tissues and under which conditions is the transcript or protein detected. A location without expression is a capability the protein may never exercise in your system, and an expression signal without a location is a molecule whose role you cannot place. Read together, they convert a static annotation into a biological argument.
MOPED and similar proteomics resources organize protein-level expression measurements so users can browse by organism, tissue, localization, and condition, sorted by false discovery rate and expression level, with direct links out to UniProt and pathway resources [9]. This is where you go to ask whether a mass spectrometry dataset has already detected your protein in the compartment your analysis cares about, and at what measured confidence.
Tissue-level immunostaining resources add the spatial dimension that cell-line experiments lack. The SVCT2 study illustrates the pattern: cellular localization established in breast cancer cell lines, then tissue microarray immunostaining analyzed through the Human Protein Atlas to place the protein in its tissue context [8]. For translational questions, the tissue layer is often the decisive one.
| The question you are asking | Where to look | What it adds beyond the UniProt location line |
|---|---|---|
| - | - | - |
| Where does the protein act, and on what evidence? | UniProt entry, evidence tags clicked | Provenance: experiment, similarity, or prediction [2] |
| Is the protein present in my tissue or condition? | Expression Atlas | Expression context integrated across studies and species [3] |
| Has proteomics detected it in this compartment? | MOPED and comparable resources | Measured protein-level observations with false discovery rates [9] |
| Where does it sit in actual tissue? | Tissue staining atlases of the kind used for SVCT2 | Spatial validation in patient or organism material [8] |
| What does the sequence imply for an unstudied protein? | Predicted annotations and targeting-prediction servers | Scalable hypothesis generation with known accuracy [12], [13] |
The habit to build is triangulation. A location claim that survives contact with an expression profile, a proteomics observation, and a tissue-level stain is one you can carry into a manuscript or a pipeline with confidence proportional to that convergence.
Working at Scale: Retrieving and Parsing Localization Data for Hundreds of Proteins
Single-entry reading builds intuition, but real analyses need localization for tens to thousands of proteins, and bulk retrieval changes the interpretation problem in ways worth planning for.
Step 1: Define your protein set precisely. Decide whether you are working from a gene list, a search query, or a full proteome identifier. Ambiguity here, for example one gene symbol mapping to several entries across species, is the most common source of silent errors in downstream localization tables.
Step 2: Choose a retrieval route. The web interface supports tab-separated-values downloads in which "Subcellular location" is selected as an output column, and the REST API retrieves the same fields programmatically for repeatable pipelines [2]. For a one-off analysis, the download is faster. For anything you will rerun, script the API call so the retrieval itself is documented.
Step 3: Parse the location field defensively. In bulk output, a single location field may contain multiple compartments, qualifiers such as "By similarity," and free-text notes. Splitting on the first separator you see will scramble multi-compartment proteins, which are biologically common. Write your parser to preserve the full string, then decompose it deliberately.
Step 4: Build an evidence-tier column while you parse. As each location string passes through your script, classify it: does it carry an explicit predicted or similarity qualifier, or does it represent a curator-entered claim? Record the tiering rule in your code and your methods section. This mirrors the principle that annotation quality propagates into downstream conclusions: when localization feeds a compartment-weighted interaction network, the reliability of each location assignment shapes the significance of every edge built on it [1].
Step 5: Plan a sensitivity analysis. Run your analysis twice, once with all annotations and once with predicted-only annotations down-weighted or excluded. If your biological conclusion survives, it does not depend on the weakest evidence tier. If it collapses, you have learned exactly which observations it rests on, which is far better to know before review than after.
Step 6: Handle absence honestly. A missing location is not a cytosolic assignment. Leave it missing, report the fraction of your protein set with no localization information, and resist the temptation to impute, because imputation silently converts "unknown" into "data" and contaminates every downstream compartment statistic.
Step 7: Record provenance. Store the retrieval date and the database release with your table. Annotations are revised as literature evolves, so a localization table without a date is not reproducible, and a results section that cannot be reproduced is a liability regardless of how careful the analysis was.
Researchers who skip the evidence tiering step routinely discover, late, that their compartment-level conclusions were carried entirely by predicted annotations for the majority of their protein set. Since detailed literature curation covers a small fraction of the more than 120 million sequences in the Knowledgebase, most large protein sets will be prediction-dominated, and knowing that in advance changes how you frame your claims [2].
A Decision Framework for Choosing Which Annotation to Carry Forward
When two analysts disagree about a localization claim, the disagreement usually traces to unstated standards. Making the standard explicit resolves most arguments. The ladder below ranks annotation types by the strength of support, from strongest to weakest.
- Multi-method experimental support. Two or more independent techniques, ideally across more than one model, as in the combined fractionation and microscopy designs described for placental AhR [7] and for SVCT2 in breast cancer models [8]. Suitable as a reference standard and for mechanistic claims.
- Single-method experimental support. One published measurement, gold-tagged, from one group. Suitable for prioritization and hypothesis framing, with the method's specific failure modes kept in view.
- Similarity transfer from a well-characterized ortholog. The location was demonstrated experimentally in a related organism and transferred with the "By similarity" qualifier. Reliable when orthology is close and the localization mechanism is conserved; unreliable when localization is species-specific.
- Prediction backed by a visible sequence feature. For example, a secreted call supported by an annotated signal peptide, or a membrane call supported by explicit transmembrane features. The reasoning chain is auditable in the entry itself.
- Model-only prediction without an obvious supporting feature. A deep-learning assignment whose sequence basis is distributed and hard to inspect, carrying the published accuracy profile as its main justification, strong for membrane versus soluble and moderate for fine-grained categories [13].
- Explicitly uncertain annotations. Curator-flagged uncertainty. These provide no direction, but they prevent overclaiming and mark proteins where targeted experiments would be most informative.
Two calibration rules complete the framework. First, let the decision at stake set the tier requirement. A mechanistic claim in a manuscript deserves tier one or two; annotating a newly sequenced genome can legitimately operate at tiers four and five, because for the long tail of proteins that will never be individually studied, computed annotation is the only annotation available [2]. Second, never let tier outrank convergence. A tier-four prediction that agrees with an independent proteomics observation is stronger than a tier-two claim from a single method with a known artifact, and your framework should allow that trade explicitly rather than by accident.
Troubleshooting Localization Interpretation: Field-Tested Answers
My microscopy shows the protein in the cytoplasm, but the UniProt entry says nucleus. Where do I start? Work through the boring explanations first. Confirm you are looking at the same isoform the annotation describes, since localization can differ between isoforms and UniProt can annotate location per isoform. Confirm where your tag sits and whether your construct is overexpressed, because excess abundance from strong promoters routinely mislocalizes proteins, which is exactly why endogenous-locus tagging is preferred in well-resourced systems [6]. Then check the condition: the entry's evidence may describe a stimulated state while your experiment is basal, or the reverse. Only after those checks does a genuine discrepancy remain, and at that point the right move is to read both evidence sources and design an experiment that distinguishes them.
The Subcellular location section is essentially empty. What does that mean? It means no curator has entered a location for that entry, not that the protein has none. Check whether an unreviewed, automatically annotated entry for the same protein carries a predicted location from the rule-based pipeline [2], and check the cross-references for expression data that might hint at context [3]. An empty section is a gap in curation, and for many proteins in the Knowledgebase it is the normal state [2].
Two sources give different compartments for the same gene. First verify they describe the same protein product and the same organism. Then compare evidence types: one may be experimental and the other predicted, in which case the disagreement cases described earlier apply, including the possibility that both are right because the protein is genuinely multi-compartment or condition-dependent. If both are experimental, look at methods and model systems. Different cell types and different stimulation states produce different true answers, and the disagreement is then biology, not error.
My bulk download seems to lack the evidence information I saw on the website. The visual color coding is an interface feature; in bulk formats, evidence and qualifiers travel as text, and how they are represented depends on the fields you requested. Verify your download against the web view for a small sample of entries before trusting the parse, and if a qualifier such as "By similarity" is not appearing, adjust the requested fields rather than assuming the information is absent.
A predicted secreted protein keeps showing up in my cytosolic fractions. Do not treat this as a contradiction to resolve by picking a winner. Proteins with leader sequences can retain a cytosolic pool before secretion, and the observed cytosolic signal may document one real state of a protein with more than one. Multi-compartment annotations in curated entries exist precisely because such behavior is common, and a single-category predictor output cannot represent it.
Fractionation puts my protein in every fraction. Is that real? Possibly, but check the obvious artifact first: fractionation can leak proteins between compartments, and highly abundant proteins appear everywhere. Compare against marker proteins of known localization in the same preparation, and look for orthogonal support such as imaging before concluding that the protein is a true multi-compartment resident.
How can I tell whether the antibody behind a staining result was trustworthy? Look inside the cited paper for the signs of careful design: orthogonal confirmation by a second method, as in the combined imaging and fractionation studies already discussed [8], [7], and quantification rather than single images, which is the standard that computational analysis of stained tissue sections was developed to meet [5]. A paper that validates its localization claim internally gives its annotation a durability that a single unstained control cannot.
Common Misconceptions About UniProt Localization, Corrected
"Predicted means unreliable, so I should ignore it." Unreliable is not the same as useless. Sequence-based prediction is the only annotation that exists for most of the Knowledgebase's proteins, and dedicated predictors for problems like mitochondrial targeting carry benchmarked performance and reach compartments that experiment has touched only partially [12], [2]. The correct posture is calibrated use: know the error rate, prefer predictions backed by visible features, and never let a prediction carry a claim that demands direct evidence.
"Experimental means the protein is always there." An experimental annotation documents one organism, cell type, and condition. The placental AhR work found constitutive nuclear localization without any added activator, an interpretation specific to that tissue context and its endogenous ligands [7], and it would be an error to project it unchanged onto every tissue. Experimental means measured, not universal.
"The gold and silver colors are a quality ranking." They encode evidence provenance, not importance or even overall reliability. A silver prediction with a clean supporting feature can be more dependable in practice than a gold claim from a single cross-reacting antibody experiment decades ago. Colors start the audit; they do not replace it.
"By similarity is just a soft prediction." Similarity transfer rests on an actual experiment performed in an orthologous protein, which is a categorically different kind of support from sequence-feature prediction, even though neither is direct evidence for the protein in front of you [2]. The qualifier's reliability tracks orthology distance, so treat transfers from close orthologs and distant relatives very differently.
"If the motif is in the sequence, the localization is certain." Sequence motifs can be necessary without being sufficient. Targeting and retention signals are regulated by phosphorylation, ligand binding, masking by interaction partners, and competitive trafficking, none of which a sequence scanner observes. A perfectly real nuclear localization signal can sit silent for the protein's entire lifetime in one cell type and dominate its behavior in another.
"High-throughput localization data is clean because it is systematic." Scale does not remove artifacts; it standardizes them. Droplet-based single-cell proteomics with oligo-conjugated antibodies carries protein-specific noise from unbound antibodies encapsulated during droplet generation, and computational correction using background signal from empty droplets is required before the data supports localization conclusions [10]. Systematic measurements with understood artifacts beat unsystematic ones, but only when the artifacts are actually handled.
"Once annotated, always annotated." Curation is a living process. Reviews of individual proteins, such as the accumulated decades of work on the calcium-binding protein S100A6 and its expression, localization, and binding partners, show how much of a protein's localization story remains open even after long study [11]. Entries get revised as methods improve and new behaviors are demonstrated, which is an argument for recording when you read an annotation, not just what it said.
Tracking Localization Annotations Over Time and Across Project Lifecycles
Long projects outlive annotations. A localization table assembled at the start of a two-year study can diverge silently from the Knowledgebase as curators revise entries in light of new literature, and the divergence is invisible unless you look for it.
Three habits keep long projects aligned. First, record the accession, the database release, and the retrieval date whenever localization data enters a project file, so any figure built on the data can be traced to a specific version of the annotation. Second, schedule a re-retrieval before manuscript submission or pipeline publication, and diff the new location lines against the old ones; any changed entry deserves a fresh look at its evidence, because a revision often means a new experiment overturned or refined the earlier picture. Third, treat revisions as information rather than noise. When an entry gains a second compartment with its own evidence, that change usually reflects a demonstrated translocation or a newly appreciated multi-compartment behavior, and such findings frequently matter directly to the biology a project is studying.
This maintenance discipline also belongs in teaching. Students who learn UniProt as a static lookup tool carry that model into their postdocs, where it fails quietly. Students who learn it as a curated, versioned, evidence-labeled resource that changes under their feet are prepared for the actual texture of the data, and the small cost of checking entry history is repaid every time a reviewer asks how old an annotation is.
Training Exercises for Building Localization Judgment
Judgment in this domain comes from repetition, and the following exercises take a student or new lab member from passive reading to active evaluation within a few working sessions.
Exercise 1: Trace three evidence tags. Choose one protein with an experimental location, one with a similarity transfer, and one with a predicted location. For each, click the evidence indicator, identify the source, and write a single sentence stating exactly what the evidence supports and what it does not. The discipline of the single sentence exposes vague thinking faster than any rubric.
Exercise 2: Reconstruct a prediction. Take a predicted-only protein and list every feature in the entry that could support the call: signal peptide, transmembrane helices, targeting motifs, domains. If the prediction rests on nothing visible in the entry, write down what the model may have seen that you cannot, and mark the call as model-only in any table you build [13].
Exercise 3: Write a disagreement memo. Find a protein where prediction and experiment point to different compartments, or where two experimental sources differ. Write a half-page memo stating both claims, their evidence, the most likely biological or technical explanation, and what single experiment would resolve the question. This is the core interpretive skill, practiced in miniature.
Exercise 4: Batch and tier. Download location annotations for a set of one hundred proteins using the batch or API route [2], write a parser that assigns each entry to an evidence tier, and report the tier distribution. Then rerun a simple downstream summary with predicted tiers down-weighted, mirroring the logic by which annotation quality shapes network-based disease gene prioritization [1]. Most trainees are surprised by how prediction-dominated their sets are, and the surprise is the lesson.
Exercise 5: Read a methods section critically. Take the placental AhR study [7] or the SVCT2 study and list what would have been lost if only one of its methods had been used. This trains the instinct that experimental strength comes from design, not from tag color.
Exercise 6: Cross the resources. Pick one protein and assemble a one-paragraph picture of it from UniProt's location line [2], its expression profile in the Expression Atlas [3], any compartment-level proteomics observations in resources browsable by localization and condition [9], and tissue-level staining context of the kind used for SVCT2 [8]. Where the four agree, say so. Where they diverge, name the reason. A student who can do this for one protein can do it for a thesis worth of them.
Each exercise is deliberately small, because the goal is not coverage but habit formation: read the claim, then read the evidence behind the claim, then decide what weight the claim can bear in the analysis at hand. That loop, repeated across dozens of proteins, is what turns the experimental versus predicted distinction from a piece of database trivia into a working instrument.
Frequently Asked Questions
What does uniprot experimental vs predicted localization mean?
It is the difference between a subcellular location supported by a published laboratory measurement and one assigned by computational sequence analysis. UniProt labels each location claim with an evidence tag and color code so you can see which is which directly in the entry.
How do I tell whether a UniProt localization annotation is experimental or predicted?
Open the Subcellular location section and check the evidence indicator beside each location, then click it to expand the source. Experimental evidence links to a cited publication, predicted evidence links to the computational method, and "By similarity" indicates transfer from an ortholog.
Can I trust predicted localization in UniProt for a novel protein?
You can use it as a strong starting hypothesis, with realistic expectations. Sequence-only deep-learning predictors reach good but imperfect accuracy, around 78 percent for 10 categories, so a predicted location should guide experiments rather than end them, especially for fine-grained compartment calls or unusual proteins.
Why do experimental and predicted localization disagree for the same protein?
Common reasons include condition-dependent translocation, isoform-specific differences, weak training examples for the predictor, artifacts in the experimental method, or genuine multi-compartment behavior that a single-category prediction cannot represent. Check the evidence sources on both sides before deciding which claim to keep.
Should I cite UniProt or the original paper for localization data?
Cite the original paper whenever UniProt marks the annotation as experimental, because the paper contains the method and conditions that justify the claim. For predicted annotations, cite UniProt itself, since the Knowledgebase is the source that commissioned and recorded the computation [2].
How do I download localization annotations for many proteins at once?
Search UniProt for your protein set, choose the tab-separated-values download, and select "Subcellular location" as one of the output columns, or query the REST API for the same fields programmatically. Batch retrieval of location lines with their qualifiers is a standard, documented feature of the resource.
Sources
- Breast Cancer Candidate Gene Detection Through Integration of Subcellular Localization Data With Protein-Protein Interaction Networks
- UniProt: a worldwide hub of protein knowledge
- Expression Atlas in 2026: enabling FAIR and open expression data through community collaboration and integration
- Experimental supporting data on TKS5 and Cortactin expression and localization in human pancreatic cancer cells and tumors
- Semi-quantitative Determination of Protein Expression using Immunohistochemistry Staining and Analysis: An Integrated Protocol
- Gene Tagging Strategies To Assess Protein Expression, Localization, and Function in Drosophila
- Expression, Localization, and Activity of the Aryl Hydrocarbon Receptor in the Human Placenta
- Data on SVCT2 transporter expression and localization in cancer cell lines and tissues
- MOPED: Model Organism Protein Expression Database
- Normalizing and denoising protein expression data from droplet-based single cell profiling
- S100A6 Protein-Expression and Function in Norm and Pathology
- Computer-Aided Prediction of Protein Mitochondrial Localization.
- DeepLoc: prediction of protein subcellular localization using deep learning.