Scaling Snakemake to Thousands of Jobs: Best Practices
By Dr. Zubair Khalid, DVM, MS, PhD ·

The difference between a Snakemake workflow that runs 50 jobs and one that runs 5,000 is a change of executor and operating discipline, not a rewrite of the workflow. The rule of thumb for choosing an approach: on a site that runs SLURM, use the SLURM executor plugin with declared resources and job grouping. On raw cloud infrastructure without a batch scheduler, use Kubernetes pods or serverless functions. If the cluster queue itself is the bottleneck, merge small jobs into groups before you add concurrency.
The demand is real. A targeted mass spectrometry platform processes 96 samples in three days with fully automated sample handling and profiles thousands of samples across drug perturbation studies [1]. Structural biology groups distribute protein structure comparisons across clusters [2]. Work at that scale generates thousands of per-sample jobs, and a bioinformatics workflow manager is the tool that turns them into a reproducible, schedulable pipeline [3]. Snakemake, a Python-based workflow engine, is one of the two most widely used workflow managers in genomics, alongside Nextflow [3]. This article explains what actually changes at the thousand-job mark, compares the scaling options with their pros and cons, and lists the mistakes that cost teams days of runtime.
What Changes When You Scale Snakemake to Thousands of Jobs on a Cluster
Snakemake runs as a single control process on one machine. That process parses your Snakefiles, builds a directed acyclic graph (DAG), the dependency map in which every node is one job with defined inputs, outputs, threads, and resources, and starts jobs in dependency order. Where each job actually runs is decided by the executor. In Snakemake 8, executors are plugins: local (the default), slurm, cluster-generic, kubernetes, and others install as separate packages and are selected with the executor flag.
Three systems have to survive a thousand-job run, and each one fails differently.
The first is Snakemake's own scheduler, which decides which ready jobs to launch given your thread and resource caps. It holds the whole DAG in memory, so a graph with hundreds of thousands of nodes takes real time and RAM to evaluate.
The second is the cluster's workload manager, such as SLURM, PBS, or LSF, which decides where submitted jobs run and in what order. Scheduling research on GPU clusters with thousands of servers documents the strain on this layer: running a single scheduler that handles all arriving jobs in a timely and effective manner is challenging at that workload scale [4]. Your thousand-job run shares that infrastructure with everyone else on the machine.
The third is the filesystem. Thousands of jobs writing logs, checkpoints, and outputs generate millions of metadata operations on shared filesystems, and an output file can become visible to the control process seconds after the job that wrote it has exited.
The same Snakefile runs everywhere. What changes is the launch command:
# one machine, 64 cores
snakemake --cores 64

# SLURM cluster, up to 500 concurrent jobs
snakemake --executor slurm --jobs 500 \
    --default-resources "mem_mb=8000" "tmpdir=/scratch" \
    --latency-wait 120 --retries 3
Four settings carry almost every scaling decision: the executor (where jobs run), the jobs limit (how many run concurrently), declared resources (what they may consume), and grouping (how many jobs share one submission).
Scaling Options at a Glance
The table compares the seven practical ways to scale a Snakemake workflow. The sections after it explain each option on its own terms, and the criteria section compares them on what actually decides the choice.
| Option | What Snakemake does | Command sketch | Sweet spot | Main drawback |
|---|---|---|---|---|
| Local multithreading | Runs every job as a process on one machine, bounded by a core cap | snakemake, cores 64 | Hundreds of short tasks on one large node | Memory and core ceiling of a single machine |
| SLURM executor plugin | Submits one sbatch per job or group, tracks status, supports cancellation | snakemake, executor slurm, jobs 500 | University and national HPC clusters running SLURM | Per-user queue limits and submission throttling |
| Cluster-generic executor | Calls any submit command you provide | snakemake, executor cluster-generic, cluster-generic-submit-cmd "qsub ..." | PBS, LSF, SGE, and custom schedulers | You own the status script |
| Classic cluster interface | Fills a template string with per-job placeholders | snakemake, cluster "sbatch, parsable ..." | Full control, Snakemake 7.x and custom sites | More moving parts to debug |
| Kubernetes executor | Runs each job as a pod with a container image | snakemake, executor kubernetes, jobs 200 | Elastic cloud with autoscaling node pools | Storage plumbing and per-pod startup cost |
| Serverless functions | Hands data-parallel steps to a functions platform | Lithops or a serverless executor plugin | Short, stateless, embarrassingly parallel steps | Runtime and memory caps, data staging |
| Grouping plus resources | Merges small jobs per submission and caps global usage | group: in rules, -group-components, -resources | Any run with many tiny jobs | Coarser failure granularity |
Option 1: Local Parallel Execution
Local execution runs every job as a process on one machine, bounded by the core cap. It is the default executor and the right choice up to surprisingly high job counts. A single node with 128 cores can chew through hundreds of short tasks, such as quality control on 500 files, faster than a cluster round trip per task, because there is no queue wait.
The ceiling is memory, not cores. Snakemake counts threads but knows nothing about a job's memory footprint unless you declare it, so 64 parallel alignments can exhaust a 512 GB node. Declare memory per rule and cap the total:
snakemake --cores 64 --resources mem_mb=400000Local mode also stays useful after you scale out. The control process itself runs locally, and the aggregation rules that merge thousands of per-sample outputs are often happiest on the machine that already holds the workflow metadata. Keep it in the toolbox even when the cluster does the heavy lifting.
Option 2: HPC Cluster Execution
Most thousand-job Snakemake runs happen on clusters managed by a workload manager. Sites differ more than newcomers expect, and operational reports from Cray installations describe running different workload managers across platforms [5]. The first practical question is which manager your site runs. Snakemake 8 answers with two mechanisms: the SLURM executor plugin for SLURM sites, and the cluster-generic executor for everything else. On Snakemake 7, the classic cluster interface covers both cases.
The SLURM Executor Plugin
SLURM is the most common workload manager on academic clusters. The plugin, installed with pip as snakemake-executor-plugin-slurm, translates each job, or each group of jobs, into an sbatch submission and tracks it through the queue:
pip install snakemake-executor-plugin-slurm

snakemake --executor slurm --jobs 500
Declared resources map onto SLURM directives. A rule asking for threads 8 and mem_mb 32000 becomes an sbatch request for 8 CPUs and 32 GB of memory. SLURM settings such as account, partition, quality of service (QOS, the site's job class with its own limits), and extra sbatch arguments travel through rule resources, for example slurm_account or slurm_extra.
Three settings matter at the thousand-job scale. The jobs limit should match what your QOS allows rather than the maximum imaginable. The latency wait, 60 seconds by default, tells Snakemake how long to wait for an output file to appear after a job finishes, and busy shared filesystems justify 120 seconds or more. Retries resubmit jobs that die on node loss, which is routine on clusters with thousands of nodes.
Ask your administrators for the per-user numbers before launch: maximum running jobs, maximum submitted jobs, and CPU and memory ceilings per QOS. Exceeding a submission limit is the most common reason a large run stalls after a few hundred jobs.
The Cluster-Generic Executor and the Classic Cluster Interface
Non-SLURM sites running PBS, LSF, SGE, or a homegrown scheduler use the cluster-generic executor, which calls a submit command you provide:
snakemake --executor cluster-generic \
    --cluster-generic-submit-cmd "qsub -N smk-{rule}-{jobid}" \
    --jobs 300
The older and still supported interface gives full control through a template string with placeholders:
snakemake --cluster "sbatch --parsable -c {threads} --mem={resources.mem_mb} \
    --time={resources.time_min} -p main -J smk-{rule}-{jobid} \
    -o logs/{rule}/{jobid}.out" \
    --jobs 300 --cluster-status my-status.py --cluster-cancel scancel
The placeholders fill per job, which is why resources such as time_min belong in the rules. The status script is the piece people skip and then need: it translates scheduler states such as NODE_FAIL or TIMEOUT into signals Snakemake understands, so a dead node triggers a retry instead of a silent hang. The Snakemake documentation ships a working SLURM status script to copy, and a custom jobscript covers sites with exotic requirements such as module loads.
Whatever the backend, your jobs queue behind everyone else under the site's policy. Comparative evaluations of the schedulers in Hadoop YARN show that policy choice changes wait times and utilization substantially [6]. Research on dispatch policies for clusters with thousands of servers, from join-the-shortest-queue variants to cost-based policies, formalizes what operators tune [7]. You do not control that policy, so design around it: fewer, larger submissions touch the queue less often than thousands of tiny ones.
Option 3: Kubernetes and Cloud Executors
Cloud infrastructure without a batch scheduler maps onto Kubernetes, where the executor runs each job as a pod with its own container image:
snakemake --executor kubernetes --jobs 200Three practical requirements follow. Every job needs a container image containing its software, so pair the executor with conda or container-based deployment (-software-deployment-method conda apptainer in Snakemake 8,, use-conda and, use-singularity in 7.x). Data must live somewhere pods can reach, typically object storage, which Snakemake supports through remote file providers such as, default-remote-provider S3 with a bucket prefix. And instance sizes cap per-job resources, so, max-threads keeps the scheduler from building a job no node can fit.
Kubernetes adds per-pod startup overhead, seconds rather than milliseconds, and image pulls can dominate short jobs. It rewards the same grouping discipline as HPC: pack small steps into one pod with, group-components.
For teams that prefer managed infrastructure over operating a cluster, executor plugins in the Snakemake ecosystem target managed cloud services (for example Tibanna on AWS). The broader pattern matters more than any single plugin: cloud platforms can expose massive parallelism without you owning a scheduler, and the executor abstraction is what lets the same Snakefile move between them.
Autoscaling cuts both ways. A thousand-pod burst that runs for one minute still bills for a minute of a thousand vCPUs, and one straggler pod holds the DAG open. Set the jobs limit to your budget, not to the workflow's theoretical width.
Option 4: Serverless Execution
Serverless platforms, also called functions-as-a-service, run code in short-lived cloud functions with no cluster to manage. The Lithops system shows the scale available: it spawns hundreds to thousands of cloud functions in seconds and scales single-machine code to thousands of cores for data-parallel tasks such as Monte Carlo simulation and hyperparameter tuning.
For Snakemake users the pattern fits a subset of steps. Serverless suits embarrassingly parallel, short-lived, stateless work: per-sample quality summaries, format conversions, parameter sweeps. It fits poorly for long jobs (platforms cap execution time), for jobs needing more local scratch than the function's memory and disk allowances, and for software with exotic dependencies.
The honest
Weighing the Pros and Cons of Each Scaling Option
The quick-reference table compresses each option into one row, but real decisions need the full trade. Here is the honest version for every option, including the ones the table treats briefly.
Local multithreading. Pros: zero setup, instant job startup, trivial debugging because stderr appears in your terminal, and no queue policy between you and your work. Cons: hard ceilings on cores and memory, one careless rule can take down the node you are also using to run the control process, and no fault isolation, because a kernel panic kills the whole run. It remains the correct choice for development, for the aggregation tail of a cluster run, and for anything that finishes in minutes.
SLURM executor plugin. Pros: the shortest path from Snakefile to a working cluster run on the most common academic scheduler, automatic translation of threads and memory into scheduler directives, built-in job tracking and cancellation, and retries that handle node loss. Cons: it hides the sbatch call, so when a site's local wrappers, prologue scripts, or partition quirks interfere you are debugging through a layer rather than at the submission command; per-user limits still bind you; and site-specific things like module systems need a jobscript.
Cluster-generic executor. Pros: works with anything that has a submit command, which covers PBS, LSF, SGE, and the custom schedulers that old installations accumulate; operational reports from large installations describe running different workload managers across platforms, and this executor absorbs that variety [5]. Cons: you supply the status logic yourself, status scripts are the single most under-tested component of these setups, and a subtly wrong status script converts node failures into silent multi-hour hangs.
Classic cluster interface. Pros: maximum transparency, because the submit line is visible and editable in one string; every site-specific flag goes exactly where you put it; it is well documented and battle-tested. Cons: more moving parts (submit command, status script, cancel command, jobscript), placeholders are easy to get subtly wrong, and teams on Snakemake 8 should treat it as a legacy path unless a site requirement forces it.
Kubernetes executor. Pros: elastic parallelism without operating a scheduler, per-job container isolation that makes software environments trivially reproducible, and clean integration with object storage remotes. Cons: per-pod startup cost of seconds rather than milliseconds punishes short jobs, image pulls can dominate runtime for small tasks, storage plumbing (persistent claims, bucket mounting, staging) is real engineering work, and autoscaling means a runaway jobs limit becomes a runaway bill.
Serverless execution. Pros: effectively unlimited fan-out for the right kind of step, no cluster to provision, and per-invocation billing. The Lithops system demonstrates the ceiling: it spawns hundreds to thousands of cloud functions in seconds and scales single-machine code to thousands of cores for data-parallel tasks. Cons: platforms cap per-function runtime, memory, and disk, so long alignments and large scratch requirements disqualify most genomics cores; data staging in and out of object storage adds latency; and debugging a failed function invocation is harder than debugging a failed pod with a retained log.
Grouping plus resources. Pros: this is not an executor but a multiplier on every other option; merging small jobs slashes queue-touch overhead, reduces per-submission scheduler load, and often cuts wall time more than raising the jobs limit does. Cons: a failure inside a group retries the whole group, so long groups mix cheap re-execution with expensive re-execution; over-grouping can strand a group waiting for one oversized member's resource request; and grouping makes per-job logs and per-job scheduler accounting coarser.
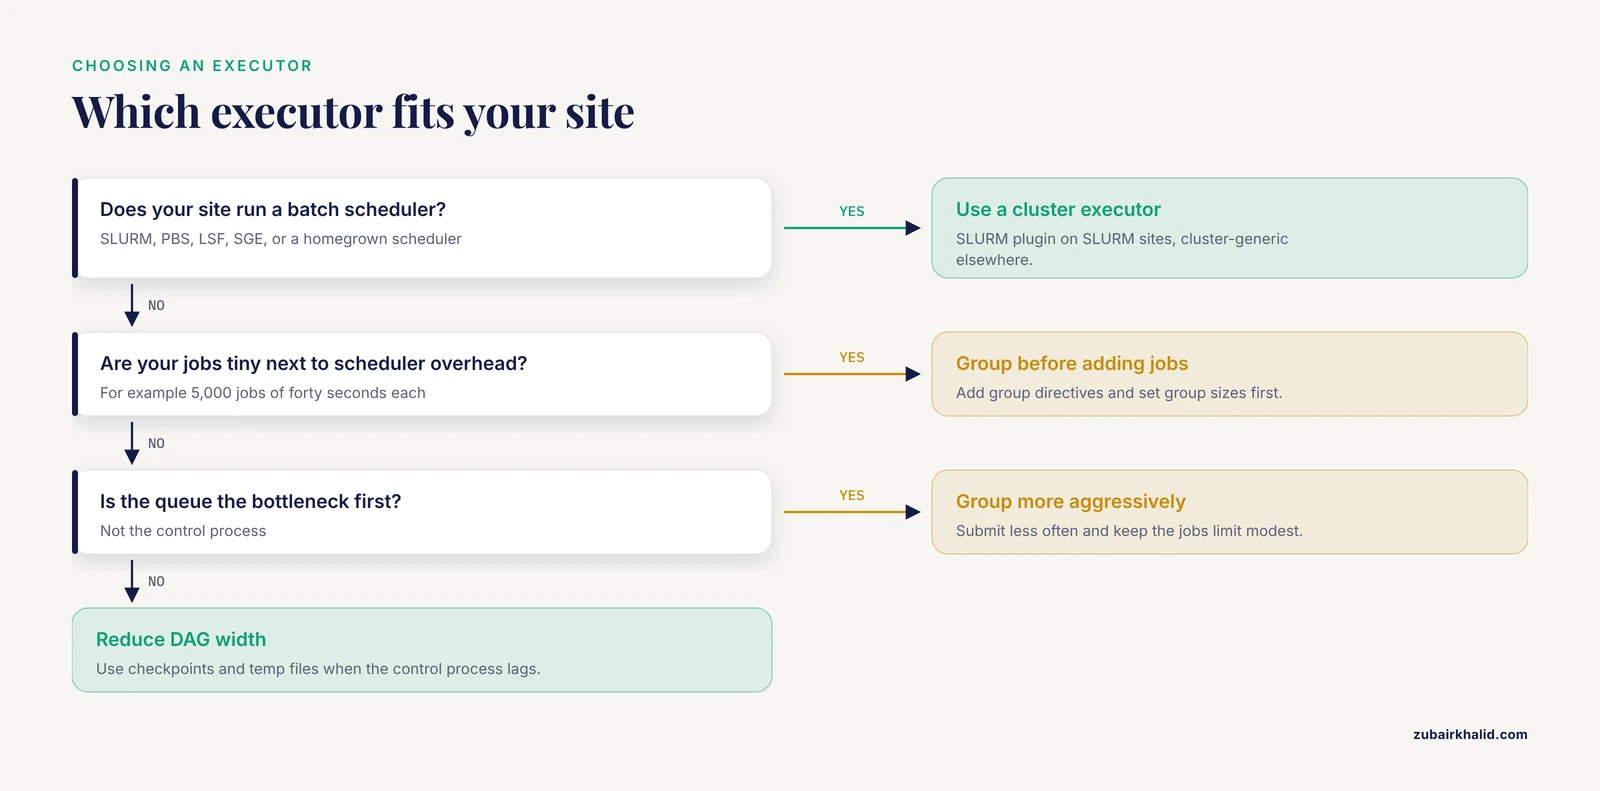
One framing helps teams choose quickly. Ask three questions. Does your site run a batch scheduler? If yes, the executor question is answered. Are your jobs tiny relative to scheduler overhead? If yes, grouping is your first lever, before concurrency. Does the control process or the queue become the bottleneck first? If the queue, group more aggressively and submit less often; if the control process, reduce DAG width with checkpoints and temp files, which the next sections cover.
Grouping, Resources, and the Job Width Problem
A workflow that produces 5,000 jobs, each running for forty seconds, is the classic scaling failure mode. Submitted one at a time, those 5,000 jobs generate 5,000 scheduler round trips, 5,000 queue entries, and often hours of pure scheduling overhead against minutes of actual compute. Comparative scheduler evaluations show that policy choices change wait times and utilization substantially under exactly this kind of load [6], and you sit downstream of that policy whether you like it or not. The fix is to change what a submission means.
Declaring Groups in the Snakefile
Attach a group to a rule, and every job of that rule becomes a candidate for grouping:
rule fastqc:
    input:
        "reads/{sample}.fastq.gz"
    output:
        "qc/{sample}_fastqc.html"
    group:
        "per_sample_qc"
    shell:
        "fastqc {input} -o qc/"
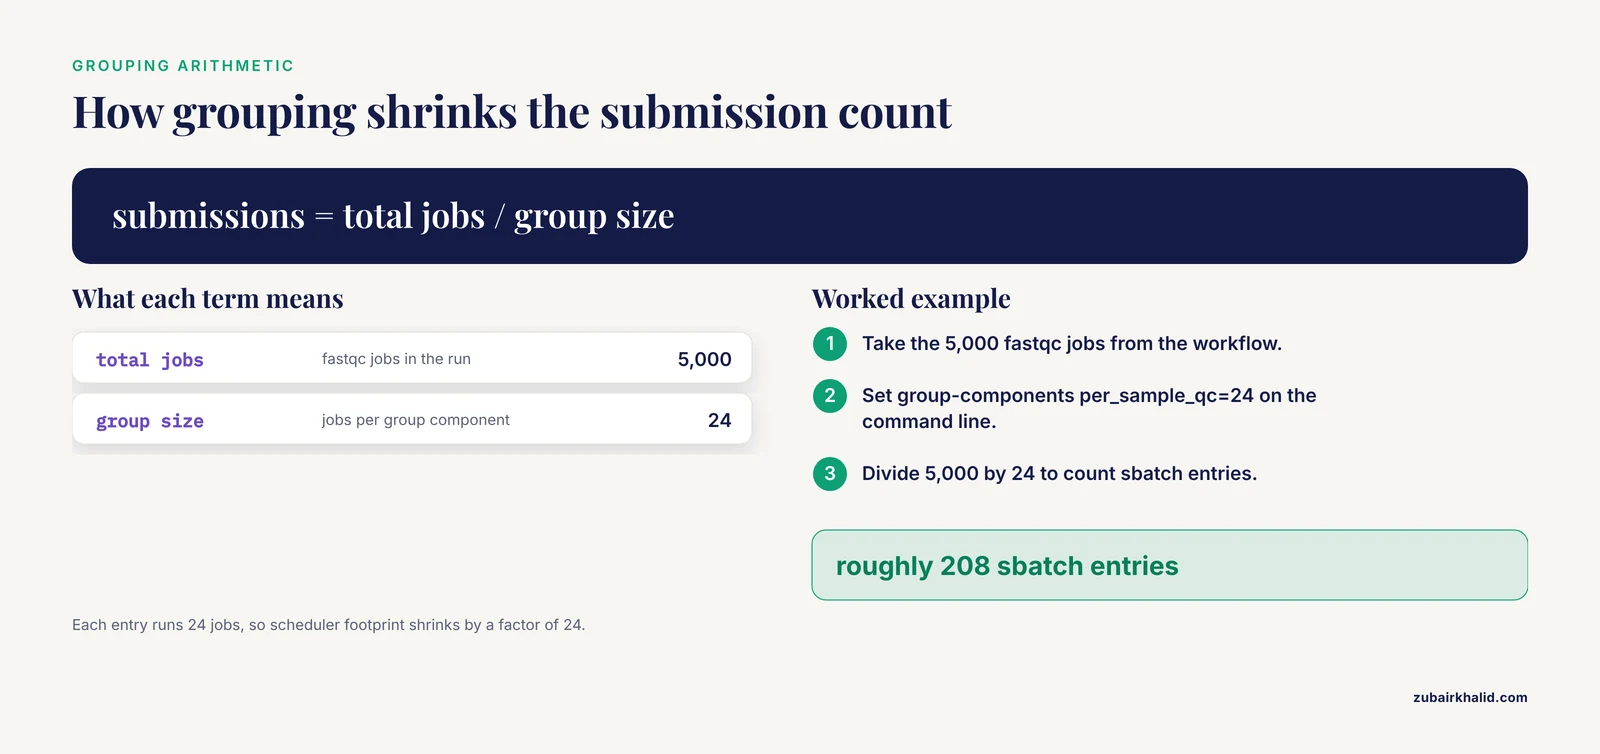
Then set the group size on the command line or in a profile:
snakemake -executor slurm -jobs 500 \
    -group-components per_sample_qc=24
With 5,000 fastqc jobs and a group size of 24, Snakemake submits roughly 208 sbatch entries instead of 5,000. Each entry runs 24 jobs sequentially or as a nested fan inside one allocation, and your scheduler footprint shrinks by a factor of 24. The rules of thumb for choosing group sizes:
- Group until the group's runtime approaches the granularity your site tolerates, typically tens of minutes to a few hours. A group of 24 forty-second jobs runs for about 16 minutes, which is a healthy submission size on most sites.
- Do not group across a step with heterogeneous resource needs unless you accept the whole group running at the highest requested memory. Snakemake does account for resources within groups, but coarse grouping still makes failure handling coarser.
- Group downstream of fan-outs first. The steps after an aggregation are where job counts explode.
Global Resource Caps
The jobs limit counts jobs, not resources. Without resource caps, 500 concurrent jobs each requesting 8 threads is a 4,000-core request that your site will throttle into a slow trickle. Declared resources give the scheduler real accounting:
snakemake -executor slurm -jobs 500 \
    -resources mem_mb=1000000 cpus=1000
Now Snakemake will not have more than 1,000 threads' worth of work in flight or more than 1 TB of declared memory, even if the jobs limit would otherwise allow it. Declare per-rule resources the same way you declare threads, including site-specific ones:
rule bwa_mem:
    input:
        reads="reads/{sample}.fastq.gz",
        ref="refs/genome.fa"
    output:
        "bam/{sample}.bam"
    threads: 8
    resources:
        mem_mb=32000,
        time_min=120,
        slurm_partition="main"
    shell:
        "bwa mem -t {threads} {input.ref} {input.reads} > {output}"
Two related flags round out the toolkit. The jobs-per-second cap throttles submission rate, which matters on sites whose schedulers rate-limit submissions per user; a burst of 400 sbatch calls in two seconds can trip a limit and leave you diagnosing partial submissions. The max-threads flag bounds any single job's thread request, which matters on Kubernetes and cloud nodes with fixed sizes, where a rule asking for 32 threads cannot fit on any available node.
Temp Files and Disk Arithmetic
Thousands of jobs produce thousands of intermediate files, and at this scale disk is a first-class scheduling resource. Mark intermediates with temp() so Snakemake deletes them as soon as their consumers finish:
rule trim:
    output:
        temp("trimmed/{sample}.fastq.gz")
A workflow with 96 samples can easily generate 50 intermediates per sample; without temp() that is 4,800 files you are paying to store and, on shared filesystems, to back up and to stat. With it, the working set stays proportional to the frontier of active jobs rather than to the size of the DAG. Teams that skip this usually discover it when the filesystem quota halts the run at 70 percent completion.
Step-by-Step: Taking a 50-Job Snakefile to 5,000 Jobs
The following sequence is the practical path from a small prototype to a thousand-job production run. It is ordered so that each step catches a class of failure while that failure is still cheap.
Step 1: Audit the DAG before changing anything. Run the workflow with a dry-run flag and inspect the job counts per rule. If one rule accounts for 90 percent of the jobs, that rule determines your scaling strategy and everything else is noise. Record the numbers; you will compare against them after optimization.
Step 2: Declare resources everywhere. Walk every rule and add threads, mem_mb, and time_min. This is tedious and non-negotiable: undeclared resources make both your local caps and your scheduler requests meaningless. As a starting heuristic, set memory from the largest input file a rule touches, then verify empirically from a real run's accounting before the production run.
Step 3: Add temp() to every intermediate. Do this before scaling, not after the first disk-quota halt. Aggregation steps should consume and delete, not accumulate.
Step 4: Group the small rules. Identify rules whose jobs run in minutes or less, add group directives, and set group sizes. Re-run the dry-run and confirm that the submission count drops to a number your queue policy tolerates, ideally in the low hundreds.
Step 5: Build the launch command in a profile (detailed in the next section). Never type the full production command by hand; a profile is versioned, reviewable, and identical between the two team members who will inevitably run this at 2 a.m.
Step 6: Stage a pilot run. Run on a subset of samples with the full production configuration. This exercises the executor, the queue policy, the resource requests, and the log layout without committing thousands of jobs. A pilot that surfaces a bad memory estimate has cost you minutes; the full run would have cost you a day and an annoyed administrator.
Step 7: Validate the failure path deliberately. On the pilot, kill a job mid-run (or let a deliberately over-constrained rule hit its time limit) and confirm that retries fire, that logs land where you expect, and that resuming the run picks up cleanly. Teams that skip this step discover their first real failure mode during the production run, when it costs the most.
Step 8: Scale the jobs limit gradually. Start with 100 concurrent jobs, watch one full wave of jobs through the queue, check for systematic failures (path problems, environment problems, permission problems all show up as waves of identical failures), and only then raise the limit. Raising the limit multiplies whatever problem exists.
Step 9: Keep the run resumable. Everything above is designed around one assumption: the run will be interrupted. The workflow should be restartable from any point with the same command, which is Snakemake's default behavior as long as you do not delete metadata or outputs indiscriminately between attempts.
Teams routinely compress this sequence into an afternoon for a well-built workflow. Teams that skip steps 2, 3, and 6 typically spend more time troubleshooting the production run than the whole sequence takes.
Profiles, Configuration, and Reproducible Launch Commands
A thousand-job run driven by a 300-character command line pasted from a chat message is not reproducible; it is a rumor. Snakemake supports workflow profiles, directories of configuration that the control process reads automatically at launch. A workflow-level profile lives in the workflow itself (workflow/profiles/default/ in Snakemake 8) and travels with the code, which means every invocation of the workflow from any directory, by any person, uses the same scaling settings.
A production profile for a SLURM site looks like this:
# workflow/profiles/default/config.yaml
executor: slurm
jobs: 500
default-resources:
  mem_mb=8000
  tmpdir="/scratch/{wildcards}latency-wait: 120
retries: 3
max-status-checks-per-second: 10
max-jobs-per-second: 10
printshellcmds: true
set-resources:
  bwa_mem:
    mem_mb=32000
    time_min=120
set-threads:
  fastqc: 2
With a profile in place, the launch command is just:
snakemakeThis has several practical consequences beyond tidiness. Code review now covers scaling decisions, because a pull request that raises the jobs limit from 500 to 2,000 is visible and can be challenged before it consumes the partition. Site-specific configuration (account, partition names, scratch paths) can live in a user-level or deployment-level profile layered over the workflow default, so the same workflow runs at two institutions with two profiles and no code edits. And debugging gets faster, because the exact production settings are written down instead of reconstructed from shell history.
Separate the three layers of configuration deliberately: workflow logic in the Snakefile, per-rule resources in the rule declarations, and site policy (executors, limits, partitions) in profiles. Teams that mix site policy into rule bodies end up maintaining site-forked workflows, which is the quiet enemy of reproducibility that a bioinformatics workflow manager is supposed to solve [3].
Monitoring, Logging, and Failure Recovery at Scale
At 50 jobs you can watch the terminal. At 5,000 jobs you need instrumentation, and the control process gives you more of it than most teams use.
Log layout. Redirect scheduler output per rule and per job into structured directories, as in the classic interface example earlier (logs/{rule}/{jobid}.out). A flat logs directory with 5,000 files named by timestamp is unusable during the exact incident when you need it. Pair this with the printshellcmds setting so the run log records exactly what was executed where.
Status checks. The control process polls job status on a interval, and the polling rate is configurable. On very large runs, aggressive polling hammers the scheduler; a modest cap on status checks per second keeps the control process polite while still noticing failures quickly enough for retries to matter.
Inspecting progress. The summary view lists every output file with its state, which is the fastest way to answer "how far along are we and what failed." The reason flag prints why each job in a dry-run would run, which is the fastest way to answer "why is it re-running everything" after an interruption.
Recovery commands. Three commands belong in every operator's notes:
# after an abnormal termination that left a stale lock
snakemake -unlock

# rerun only jobs that were marked incomplete by a crash
snakemake -rerun-incomplete

# clear metadata for a file whose tracking state is corrupted
snakemake -cleanup-metadata path/to/file
Retries belong in the profile, not in muscle memory. With retries set to 3, a node failure during a 12-hour run becomes a log line and an automatic resubmission rather than a pager alert. This is one of the largest single differences between a configured run and an unconfigured one, because node loss is routine, not exceptional, on clusters with thousands of nodes.
Metadata growth. The control process records job metadata on disk, and a run with hundreds of thousands of jobs accumulates a meaningful metadata footprint that also slows re-evaluation of the DAG. Plan periodic metadata maintenance for long-lived, repeatedly extended workflows, and treat the metadata directory as part of the workflow's state, backed up and never casually deleted.
Filesystem and I/O Pitfalls
The filesystem is the layer that fails most quietly at scale. Three pitfalls account for most of the pain.
Metadata operation storms. Thousands of jobs each writing logs, status files, conda environment checks, and outputs generate millions of metadata operations on shared filesystems. Symptoms are slow job startup (the prologue that stat()s a conda prefix takes minutes instead of seconds), latency-wait timeouts that appear and disappear with filesystem load, and aggregation steps that crawl while stat()ing thousands of input files. Mitigations: keep conda environments and containers on fast local or parallel scratch rather than a heavily loaded home filesystem, redirect logs to scratch, and prefer fewer larger output files over many small ones where the tooling allows.
Write visibility latency. On distributed filesystems, an output file can become visible to the control process seconds after the writing job exits, which is exactly why the latency-wait setting exists. The failure mode is unmistakable once you have seen it: jobs that completed successfully are reported as missing their outputs, and a re-run shows those jobs as already complete. If you see it, raise latency-wait substantially rather than debugging the tool that wrote the file.
Working directory placement. Run the control process on a node that shares the filesystem with the compute nodes, with the workflow directory on storage that both can reach at low latency. Running the control process on a laptop against a cluster filesystem, or the workflow on storage one of the parties cannot reach efficiently, produces the intermittent, unreproducible failures that consume support tickets.
Troubleshooting Field Guide
Symptoms, likely causes, and fixes, in roughly the order they are encountered.
The run stalls after a few hundred jobs and the queue shows nothing running. Almost always a per-user limit on running or pending jobs, or a QOS with a submission throttle. Check the site's limits with your administrators, set the jobs limit below the running-jobs limit (leaving headroom for pending jobs), and rely on grouping rather than raw concurrency to get throughput.
Jobs sit in the queue forever while the workflow waits. Resource requests too large for the partition, or a partition mismatch. Verify that per-rule resource requests fit within the partition's node sizes, and that partition and QOS directives are reaching the scheduler as intended.
Completed jobs are reported as missing outputs. Filesystem visibility latency. Raise latency-wait, then use rerun-incomplete to finish the run without redoing successful work.
The control process refuses to start, complaining about a lock. A previous run died without releasing its lock. Confirm nothing is genuinely running, then unlock and resume.
A wave of identical failures across many samples. Environmental, not algorithmic: a missing module, a wrong path, a full scratch, a permission change. Fix one job by hand, then re-run; Snakemake will retry only the failed jobs.
Individual jobs die with no useful error. Check the scheduler's own accounting for the job (out-of-memory kills and time-limit kills usually appear in scheduler accounting rather than in the job log). Then raise the rule's mem_mb or time_min and let retries cover the already-submitted remainder.
The control process itself is slow to start or to react. The DAG is too wide or too deep for comfortable in-memory evaluation. Reduce width with checkpoints so that downstream parts of the graph are built only when their upstream outputs exist, and split monolithic workflows into modules.
Everything finishes except a handful of stragglers, and the aggregation waits hours. Stragglers are inherent to fan-out workflows. Mitigate by grouping so that stragglers join a group rather than owning a whole node, by over-provisioning the jobs limit slightly so stragglers restart quickly, and by designing the final aggregation to be cheap.
Common Misconceptions
"Raise the jobs limit and the run gets faster." Only up to the first contended resource, which at thousand-job scale is usually scheduler policy, filesystem, or memory bandwidth rather than CPU count. After grouping and resource declaration, concurrency increases typically yield diminishing returns, and past a site's per-user limits they yield stalls.
"Threads is the same thing as memory." Snakemake schedules on threads by default; memory is invisible unless declared. A rule with threads: 8 and no mem_mb is scheduled as if memory were free, which is how 64 parallel jobs exhaust a node. Declare both, always.
"Snakemake replaces the scheduler." It composes with it. The control process decides which ready jobs to launch; the workload manager decides where and when they actually run. Fighting the site's policy fails; designing around it, with grouping and modest submission counts, works. The scheduling literature is blunt about how much policy matters at this scale.
"Scaling to the cluster means rewriting the workflow." The same Snakefile runs everywhere; the executor, resources, and profile change. Teams that hardcode site paths, thread counts, and submit commands into rule bodies create the rewrites themselves.
"Checkpoints and regular rules are interchangeable." A checkpoint re-evaluates the DAG after it completes, which is the only correct way to handle outputs whose number is unknown until runtime. Using ordinary rules for unknown-fanout aggregation either fails or forces you to pre-enumerate outputs, defeating the point.
"Retries hide real bugs." Retries hide transient infrastructure failures, which is their job. A job that fails deterministically will exhaust its retries and surface, correctly. The mistake is the opposite one: leaving retries off, so a single node loss kills a 12-hour run.
Snakemake vs Nextflow for Very Large Runs
Because these are the two most widely used workflow managers in genomics [3], teams scaling to thousands of jobs eventually compare them. An honest comparison at this scale:
Execution model. Snakemake runs a single control process that holds the DAG and drives the executor, whatever the backend. Nextflow similarly runs a launcher process that delegates job execution to executors ranging from local processes to batch schedulers and cloud platforms. Both architectures have the same consequence: one process must remain alive, connected, and responsive for the duration of the run, and long-running sessions need disciplined hosting. Neither system hands the whole DAG to the scheduler.
Delegation style. Snakemake's executor plugin system, formalized as plugins in Snakemake 8, and Nextflow's executor model both let one workflow target many backends. In practice, the difference teams feel is ecosystem weight: Nextflow's cloud and scheduler integrations are heavily used and well trodden, while Snakemake's strength is that the workflow is Python-native, which makes rules, grouping logic, and reporting extensible in the language most bioinformatics teams already write.
Language and team fit. Snakemake rules read like Python with a declarative layer; Nextflow uses a Groovy-based DSL. Teams with strong Python tend to maintain Snakemake workflows faster; teams that have already standardized on Nextflow pipelines rarely benefit from a port. At thousand-job scale, maintenance ergonomics matter more than marginal feature differences, because the workflow will outlive the person who wrote it.
What actually differs day to day at scale. Both systems require the same disciplines: declared resources, grouping or chunking of small jobs, latency tolerance, retries, profile-driven configuration, and log hygiene. Neither exempts you from the queue policy or the filesystem. Teams migrating between them are usually surprised at how much of their scaling setup, once written as profiles and resource declarations, transfers conceptually if not literally.
Selection guidance. If your site runs SLURM and your team writes Python, Snakemake with the SLURM executor plugin and grouping is the shortest path. If your organization has standardized on Nextflow, its cloud executors and ecosystem are a genuine advantage and switching costs outweigh marginal gains. If you are choosing greenfield, prototype the same ten-step workflow in both against your actual scheduler and judge the operational feel, not the feature matrix. The workflows you can debug at 2 a.m. are the ones that scale.
A Reference Configuration and Final Checklist
A production-ready setup for a 5,000-job run on a SLURM site, assembled from the pieces above:
- Rules declare threads, mem_mb, time_min, and any site resources; intermediates are marked temp().
- Small rules carry group directives, sized so groups run tens of minutes to a few hours.
- A workflow profile pins executor, jobs limit, default resources, latency-wait, retries, status-check rate, submission throttle, and printshellcmds.
- A per-site profile (user or deployment level) supplies account, partition, and scratch paths without touching workflow code.
- Logs land in per-rule directories on scratch; the metadata directory is treated as state.
- A pilot run on a sample subset validates the failure path before the full run.
- The jobs limit starts modest, rises after one clean wave, and respects the site's per-user limits with headroom.
Final pre-launch checklist: dry-run job counts recorded per rule; resources declared on every rule; temp() on intermediates; group sizes set; profile committed to version control; pilot passed; retries and latency-wait set for your filesystem; unlock, rerun-incomplete, and cleanup-metadata commands in the operator notes; and administrators aware of the run's expected footprint. A workflow prepared this way does not merely survive the thousand-job mark; it makes that scale routine, which is the entire point of using a bioinformatics workflow manager rather than a folder of shell scripts [3].
Sources
- Reduced-representation Phosphosignatures Measured by Quantitative Targeted MS Capture Cellular States and Enable Large-scale Comparison of Drug-induced Phenotypes*
- Studies on distributed approaches for large scale multi-criteria protein structure comparison and analysis
- Reproducible, scalable, and shareable analysis pipelines with bioinformatics workflow managers
- Large-Scale Machine Learning Cluster Scheduling via Multi-Agent Graph Reinforcement Learning
- Experiences running different work load managers across Cray Platforms
- A comparison study and performance evaluation of schedulers in Hadoop YARN
- Generalized Cost-Based Job Scheduling in Very Large Heterogeneous Cluster Systems