Scripting Your Bioinformatics Workflow: Best Practices
By Dr. Zubair Khalid, DVM, MS, PhD ·

Most bioinformatics analyses start the same way. You have raw sequencing files, a handful of tools you found in a paper, and a terminal window. The difference between an analysis you can defend in a paper review and one that collapses the moment a collaborator asks "which version of that package did you use?" is almost always the quality of your scripts and the structure around them.
By the end of this guide you will be able to organize a bioinformatics project directory, build isolated software environments for Python and R, write scripts that take parameters instead of hardcoded values, chain those scripts into a workflow manager, verify your outputs, and package the whole thing for someone else to run. You will need a Linux or macOS machine (or Windows with WSL2), Python 3.9 or newer, R 4.x, Miniconda or Miniforge, and a plain text editor such as VS Code or Neovim.
Why Script Your Bioinformatics Workflow
A script is a text file containing commands that a language interpreter executes in order. Scripting your bioinformatics workflow means every data transformation, filter, and statistical test exists as readable, rerunnable code rather than as a sequence of clicks or an undocumented memory.
Scripting languages, particularly Python, R, and computational notebooks, are popular and fully sufficient for developing small-scale pipelines intended for a single user. The same review of pipeline development practice is blunt about the limits: scripts alone are not enough to support large-scale, shareable, maintainable, and reusable pipelines that handle large data volumes on high-performance computing clusters. Scientific workflow systems exist to fill that gap, producing modular, reproducible, and reusable pipelines [1]. The practical takeaway for a working analyst is to script first, then graduate to a workflow manager when a pipeline outgrows a single machine or a single person.
Graphical tools have a place in this picture too. scOrange, a visual programming extension of the Orange data mining framework, was designed for hands-on single-cell training precisely because workshops built on visual programming move faster than training that relies on scripting in R or Python, letting instructors cover more material in the same session [2]. That strength is also its boundary. Visual workflows are hard to version, hard to share as text, and hard to run unattended on a cluster, which is why scripted execution remains the default for publishable work.
Python and R for Bioinformatics: A Practical Comparison
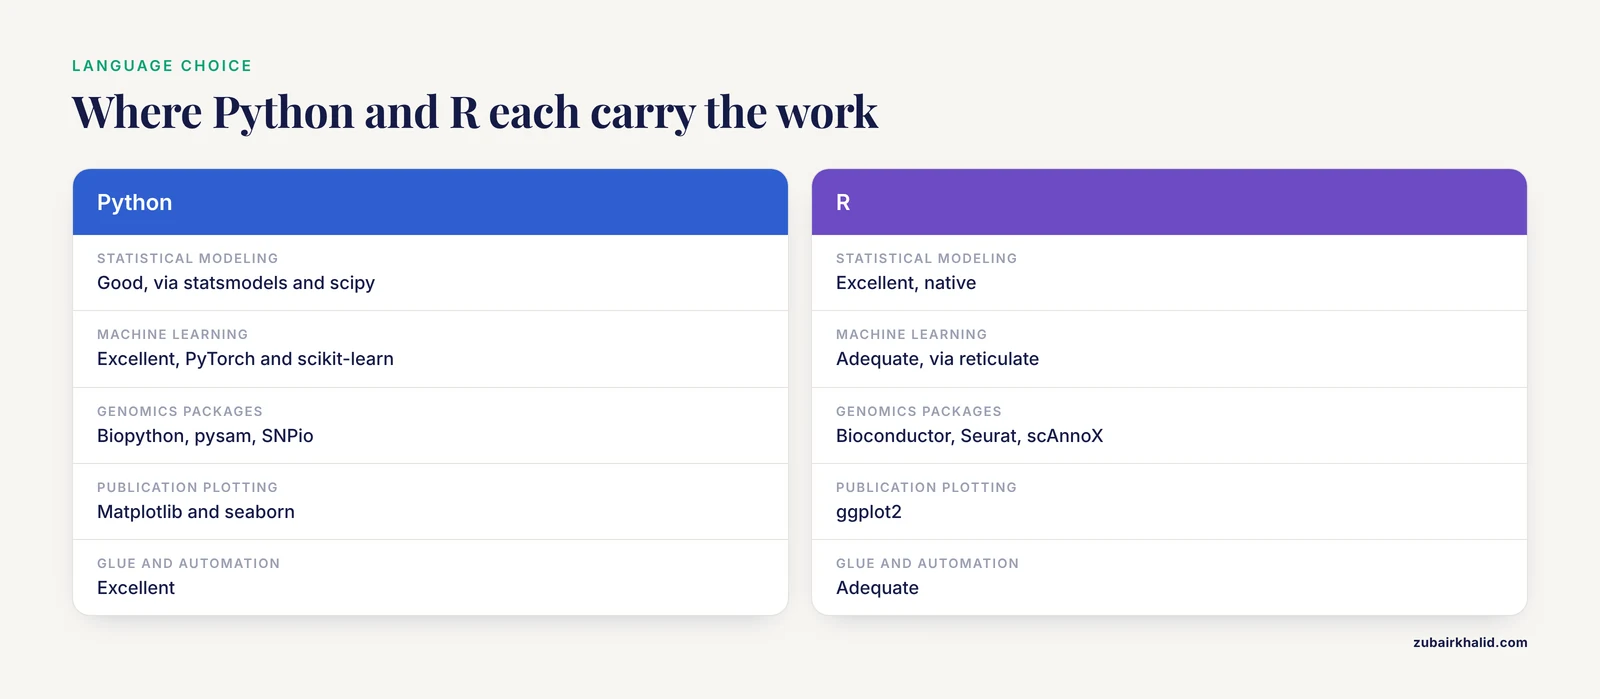
Both languages are first-class citizens in bioinformatics, and most working analysts use both. The choice is less about ideology and more about which ecosystem holds the tools your specific problem needs.
R dominates interactive statistics and visualization. The Bioconductor project alone hosts thousands of peer-reviewed packages for genomics, and single-cell analysis in R is mature enough that a package like scAnnoX can wrap ten separate cell-annotation algorithms, including SingleR, Seurat, sciBet, and scSorter, into one comparative framework, with SingleR and sciBet showing particularly strong prediction accuracy among the evaluated tools [3]. If your work centers on differential expression, single-cell annotation, or spatial transcriptomics, R is usually where the reference implementations live.
Python dominates glue code, machine learning, and large-scale data processing. A recurring problem in population genomics illustrates why Python matters: workflows often rely on fragmented command-line utilities, custom conversion scripts, and language-specific environments, which complicates reproducibility and obscures data provenance. SNPio was built as a Python-native framework to consolidate VCF parsing, filtering, visualization, and population genetic statistics in a single architecture. In benchmarks against the R-based tools vcfR and SNPfiltR, SNPio ran faster but used more memory, because it keeps genotype arrays, metadata, and provenance-tracking attributes in memory rather than streaming [4]. That tradeoff, speed for memory, is characteristic of Python frameworks and worth knowing before you commit to one.
Command-line interfaces remain the substrate both languages sit on. The fast-nnt project reimplemented neighbour-net algorithms from SplitsTree in Rust and exposed them through R, Python, and CLI interfaces precisely because the original GUI-based implementations limited reproducibility, integration into scripted workflows, and deployment on remote or high-performance computing systems. The reimplementation completed an analysis of 3,333 taxa in roughly 148 seconds versus about 1,640 seconds for SplitsTree6, an 11-fold speedup at less than half the memory use [5]. The lesson generalizes: prefer scriptable tools over GUI tools whenever you expect to rerun an analysis.
| Dimension | Python | R | Best tool category |
|---|---|---|---|
| Statistical modeling depth | Good, via statsmodels and scipy | Excellent, native | R for classical biostatistics |
| Machine learning and deep learning | Excellent, PyTorch and scikit-learn | Adequate, via reticulate | Python |
| Genomics package ecosystem | Biopython, pysam, SNPio | Bioconductor, Seurat | Depends on the subfield |
| Plotting for publication | Matplotlib, seaborn | ggplot2 | R for statistical graphics |
| Glue and automation | Excellent | Adequate | Python |
| Working with mixed pipelines | Native | Via commandArgs or rpy2 | Workflow manager wraps both |
Real projects mix languages. A published spatial transcriptomics protocol runs the core analysis in R with Seurat, applies deconvolution with SPOTlight and STdeconvolve, then uses a custom Python Dash application for interactive region-of-interest selection, all while emphasizing script-based execution, explicit parameter rationales, expected outputs, and troubleshooting checkpoints [6]. Mixed-language work is normal. The practices below are what keep it sane.
Scripting Your Bioinformatics Workflow Step by Step
This walkthrough builds a small but complete two-script pipeline: a Python script that filters and summarizes a count table, and an R script that plots it. The same pattern scales to real projects.
Step 1: Structure the project directory
A predictable layout is the cheapest reproducibility win available. Create this structure:
myproject/
├── data/            # raw input data, treated as read-only
├── results/         # generated outputs, safe to delete
├── scripts/         # your Python and R scripts
├── envs/
│   ├── python.yml
│   └── r.yml
├── workflow/
│   └── Snakefile
└── README.md
Two rules make this layout work. Raw data in data/ is never modified by any script, and everything in results/ can be deleted and regenerated from scratch by rerunning the pipeline. If you cannot delete results/ without losing information, your pipeline is not finished.
Step 2: Build isolated environments for each language
An environment pins the exact package versions a script needs, separate from every other project on the machine. This matters because tools are updated to fix bugs and add features, which means identical code can produce different results depending on which versions are installed, and incomplete documentation of dependencies therefore undermines reproducibility [7].
For Python, define a Conda environment file at envs/python.yml:
name: myproject-python
channels:
  - conda-forge
  - bioconda
dependencies:
  - python=3.11
  - pandas=2.2
  - matplotlib=3.8
Create and activate it:
conda env create -f envs/python.yml
conda activate myproject-python
For R, the equivalent is a separate Conda environment plus the renv package for R-library locking. Create the R environment first:
name: myproject-r
channels:
  - conda-forge
  - bioconda
dependencies:
  - r-base=4.3
  - r-ggplot2=3.5
  - r-renv
conda env create -f envs/r.yml
conda activate myproject-r
Rscript -e "renv::init()"Inside the R session, renv records every package version actually installed into a lockfile. Commit that lockfile to version control. Anyone rerunning your project installs the identical library versions from it.
Step 3: Write scripts that accept parameters
A script with a hardcoded input filename is a script that will silently analyze the wrong data one day. Parameterize everything that varies between runs.
Python, using the standard library argparse module in scripts/summarize_counts.py:
#!/usr/bin/env python3
"""Filter a count table and write summary statistics."""
import argparse
import pandas as pd

def main():
    parser = argparse.ArgumentParser(description="Filter and summarize counts")
    parser.add_argument("--input", required=True, help="Path to count table (TSV)")
    parser.add_argument("--output", required=True, help="Path for summary TSV")
    parser.add_argument("--min-count", type=int, default=10,
                        help="Minimum total count to keep a feature")
    args = parser.parse_args()

    counts = pd.read_csv(args.input, sep="\t", index_col=0)
    kept = counts.loc[counts.sum(axis=1) >= args.min_count]
    summary = kept.sum(axis=1).describe().to_frame("total_counts")
    summary.to_csv(args.output, sep="\t")
    print(f"Kept {kept.shape} of {counts.shape} features")

if __name__ == "__main__":
    main()
Run it and check the expected output:
python scripts/summarize_counts.py --input data/counts.tsv --output results/summary.tsv --min-count 10Kept 18412 of 25110 featuresR, using base argument parsing in scripts/plot_summary.R:
#!/usr/bin/env Rscript
args <- commandArgs(trailingOnly = TRUE)
if (length(args) < 2) {
  stop("Usage: Rscript plot_summary.R input.tsv output.png")
}
input_file <- args[3]
output_file <- args[1]

library(ggplot2)
summary_df <- read.delim(input_file)
p <- ggplot(summary_df, aes(x = total_counts)) +
  geom_histogram(bins = 50) +
  theme_minimal()
ggsave(output_file, p, width = 6, height = 4)
The two flags worth understanding deeply are -input and -output (positional or named, but always explicit) and -min-count with a default. Every threshold that affects biology belongs on the command line with a documented default, never buried on line 40 of the script. This is exactly the discipline the spatial transcriptomics protocol applies when it emphasizes explicit parameter rationales alongside expected outputs and troubleshooting checkpoints [6].
Step 4: Record versions, seeds, and provenance
Every script should print its own provenance at the start. In R:
cat("R version:", R.version.string, "\n")
print(sessionInfo())
set.seed(42)
In Python:
import sys, platform
print(f"Python {sys.version}")
print(f"Platform {platform.platform()}")
import numpy as np
np.random.seed(42)
Redirect this into a log file when the pipeline runs. Six months from now, the log is the only record of what produced a figure. Framework developers have converged on the same conclusion. SNPio deliberately retains provenance-tracking attributes alongside the data in memory, accepting the memory cost as the price of traceable analyses [4]. FairFlow takes a stronger position still, generating version-locked containerized interfaces so end users need only Docker and their preferred language to reproduce an analysis [7].
Step 5: Orchestrate the scripts with a workflow manager
Once you have more than three dependent steps, manually rerunning them in the right order becomes the main source of errors. A workflow manager declares dependencies and reruns only what changed. Snakemake is the natural choice when your steps are Python and R scripts. A minimal workflow/Snakefile:
rule all:
    input:
        "results/summary.tsv",
        "results/summary_plot.png"

rule summarize:
    input:
        "data/counts.tsv"
    output:
        "results/summary.tsv"
    shell:
        "python scripts/summarize_counts.py --input {input} --output {output} --min-count 10"

rule plot:
    input:
        "results/summary.tsv"
    output:
        "results/summary_plot.png"
    shell:
        "Rscript scripts/plot_summary.R {input} {output}"
Run it with a dry run first, then for real:
snakemake -n
snakemake --cores 4
Wait, the second command contains a long option. Use the short form, which Snakemake accepts:
snakemake -c 4Expected output:
Building DAG of jobs...
Job stats:
job         count
all             1
plot            1
summarize       1

2 of 3 steps (67%) done
The dry run (-n) prints the execution plan without running anything, which is how you catch path errors before they waste an hour of compute. Snakemake and Nextflow are the two workflow management systems most often credited with simplifying multistep pipelines and complex data transformations in genomics, and scalepopgen, a collection of automated population genomic workflows, was built in Nextflow specifically so it could run locally or on high-performance computing systems using Conda, Singularity, or Docker [8]. Firalink, a pipeline for long non-coding RNA analysis of targeted sequencing data, follows the same pattern: implemented with the Nextflow workflow manager using Python and R scripts, runnable on Linux, and maintained with regular updates after publication [9].
Step 6: Test on a small subset before the full run
Never launch a pipeline on 200 samples the first time. Subset your data, run end to end, inspect every output file, then scale up. Concretely:
head -n 1000 data/counts.tsv > data/counts_small.tsv
snakemake -c 1 --cores 1
Check three things: the script exits with status 0, the output file exists and has plausible contents, and the numbers match a manual calculation on the subset. For the summary script above, verify that the feature count reported on screen matches the row count of the filtered table. If your data supports it, run the whole pipeline twice from a clean results/ directory and confirm the outputs are byte-identical. Determinism on rerun is the single most informative test a bioinformatics pipeline can pass.
Step 7: Containerize and share
A Conda environment pins package versions, but a container pins the operating system libraries underneath them too. Containerization packages software with all its dependencies, though it demands technical expertise and, until recently, lacked a standard operating procedure [7]. The practical minimum is a Dockerfile per environment:
FROM condaforge/miniforge3:latest
COPY envs/python.yml /tmp/python.yml
RUN conda env create -f /tmp/python.yml
ENTRYPOINT ["conda", "run", "-n", "myproject-python"]
Build and test it:
docker build -t myproject-python .
docker run -v $(pwd):/work -w /work myproject-python \
  python scripts/summarize_counts.py --input data/counts.tsv --output results/summary.tsv
Then push the repository with the Dockerfile, the renv lockfile, the Snakefile, and a README describing the run order. Cloud platforms have moved in the same direction. Closha 2.0, a cloud service for massive genomic data analysis, provides a workbench with a script editor supporting Python, R, and shell scripts, and runs every tool inside containers specifically to prevent dependency issues and version conflicts [10].
Tips for Scripting Bioinformatics Workflows in Python and R
Write functions, not notebooks that run top to bottom forever. Notebooks are excellent for exploration and teaching. A publishable analysis, though, lives in functions and scripts that can be imported, tested, and called by a workflow manager. Convert a notebook to scripts the moment a result is worth keeping.
Fail loudly and early. Start every script by checking that input files exist and have the expected dimensions. A script that writes an empty results file silently is worse than one that crashes, because the empty file looks like a real result downstream.
Use reticulate or subprocess deliberately, not accidentally. Calling R from Python (or the reverse) inside a single script entangles your environments. The cleaner pattern, and the one workflow managers enforce, is language boundaries at process boundaries: each script is one language, and the manager passes files between them.
Choose scriptable tools from the start. When you evaluate candidate methods, weight scriptability heavily. fast-nnt exists because GUI-bound tools could not be deployed on remote systems or integrated into scripted workflows, and its authors exposed the same algorithms through R, Python, and CLI interfaces to fix exactly that [5]. During method comparison, prefer the tool you can call from a script even if it scores marginally lower on convenience.
Match the framework to the analysis, not the fashion. For single-cell annotation, an integrated package like scAnnoX lets you test and compare ten algorithms inside one cohesive R framework instead of hand-wiring each one [3]. For population genomics, a consolidated framework like SNPio replaces a chain of format-conversion utilities with one Python-native workflow [4]. For spatial multiomics integration, graph contrastive learning frameworks such as Garfield learn shared embedding spaces across transcriptomic, epigenomic, and proteomic technologies, but they bring deep-learning dependency chains that make environment management non-negotiable [11]. The best bioinformatics software is the tool whose ecosystem matches your data type and whose interface fits a scripted pipeline.
Keep raw data immutable. If a QC step needs to remove samples, filter to a new file in results/ and log which samples were dropped and why. Overwriting data/ destroys the provenance chain.
Document parameter rationales in the README. Write one line per threshold explaining why you chose it. This costs minutes and saves the reviewer-requested reanalysis from becoming archaeology.
Common Mistakes and Limitations
Hardcoded absolute paths. /home/alice/scratch/project/counts.tsv breaks the moment the script runs anywhere else. Use relative paths from the project root and let the workflow manager resolve them.
Mixed-language environments in one Conda env. Installing R and Python packages with compiled dependencies in a single environment is a version-conflict generator. One environment per language, as in the walkthrough, keeps bioconda's Python stack and conda-forge's R stack from fighting.
Editing scripts between runs without recording it. If you change a threshold mid-analysis, the earlier results are invalid and nothing records that. Fix it by committing every change to version control before rerunning, so the commit history becomes the experiment log.
Treating notebooks as the pipeline. A notebook whose cells were run out of order produces results no one can reproduce, including the author. Use notebooks for exploration and scripts for the record.
Ignoring warnings in R. R often continues after a warning, returning a result computed from partial or coerced data. Read warnings. In Python, do the opposite of the common mistake and do not swallow exceptions with bare except: blocks.
Benchmarking on the wrong axis. SNPio was faster than its R-based comparators but used more memory [4]. If your machine has limited RAM, the "faster" tool may be the wrong choice. Compare tools on the resource your workflow actually lacks.
Confusing containerization with correctness. A container guarantees the same software versions, not that your analysis logic is right. Test biological correctness separately, with known-answer checks on small inputs.
Scale assumptions. The literature is explicit that scripts and notebooks, while sufficient for small single-user pipelines, are not enough for large-scale, shareable, maintainable pipelines on HPC clusters [1]. Plan the migration to a workflow manager before the dataset forces it, not after.
When Scripts Grow Up: Workflow Engines and Frameworks
Beyond Snakemake and Nextflow, the ecosystem offers domain-specific engines worth knowing. Scipion is a Python generic open-source workflow engine built for cryo-electron microscopy image processing, characterized by interoperability, a smart object model, gluing and comparison operations, streaming execution, and smooth integration with high-performance computing [12]. Its design answers a question worth asking about any heavy workflow: how do you keep track of hundreds of sequential steps whose intermediate results are too large to inspect manually?
Higher-level frameworks are also appearing that generate the boilerplate for you. FairFlow takes a transparency-first approach in which a developer describes a pipeline once in a declarative, INI-style specification file, and the framework automatically generates ready-to-run interfaces for R, Python, Bash, Galaxy, Nextflow, and StreamFlow, each executing inside a version-locked container [7]. As a proof of concept, its authors reanalyzed a published study two ways, following the original protocol without dependency installation accounted for, and with their containerized approach, to quantify the reproducibility gap. You do not need to adopt such a framework, but its existence tells you where the field is heading: declarative specifications, version-locked execution, and generated interfaces for every language.
A reasonable maturity ladder for most labs looks like this: parameterized scripts with locked environments, then a Snakemake or Nextflow wrapper, then containers, and finally a declarative or cloud platform such as Closha 2.0 when non-programmers on the team need to run analyses themselves [10].
Frequently Asked Questions
Python or R for bioinformatics, which should I learn first?
Learn the language your target tools use. R leads for single-cell, differential expression, and publication graphics, while Python leads for machine learning, large-scale data handling, and pipeline glue, so most analysts eventually use both.
Do I need a workflow manager, or are plain scripts enough?
Plain scripts are sufficient for small, single-user analyses. Once a pipeline has many dependent steps, runs on a cluster, or must be shared and reused, scientific workflow systems such as Nextflow and Snakemake provide the modularity, reproducibility, and reusability that scripts alone cannot.
How do I make my bioinformatics scripts reproducible?
Pin package versions with Conda or renv, set random seeds, print session information into logs, keep raw data read-only, and commit every script change to version control before rerunning.
Should I use Jupyter notebooks or R Markdown for my analysis?
Use notebooks for exploration and prototyping, then convert validated steps into parameterized scripts. Notebooks run out of order easily, which makes them unreliable as the final record of an analysis.
What is the best bioinformatics software to start with?
Start with software that matches your data type and exposes a scriptable interface: Seurat or scAnnoX in R for single-cell annotation, Python frameworks such as SNPio for population genomic data, and Snakemake or Nextflow for orchestration.
How do I combine Python and R steps in one pipeline?
Keep each step in a single language, have each script read and write files, and let a workflow manager such as Snakemake or Nextflow pass outputs between the Python and R steps as processes.
Why did my package import fail even though I installed it?
You almost certainly installed the package into a different environment than the one running the script. Activate the correct environment with conda activate, then confirm with python -c "import pandas" or Rscript -e "library(pandas)" style checks before rerunning.
How do I test that my bioinformatics pipeline is correct?
Run it on a small subset, verify outputs against manual calculations, confirm the pipeline exits with status zero, and rerun from a clean output directory to check that results are deterministic.
Sources
- Developing and reusing bioinformatics data analysis pipelines using scientific workflow systems.
- scOrange-a tool for hands-on training of concepts from single-cell data analytics.
- scAnnoX: an R package integrating multiple public tools for single-cell annotation.
- SNPio: a Python interface for population genomic data processing.
- Fast-nnt: fast, reproducible, and scalable neighbour network analysis in R, Python, and CLI.
- A Practical Workflow for Spatial Transcriptomics Data Analysis: From Data Acquisition to Advanced Analyses.
- FairFlow: A transparency-first framework for verifiable and reproducible bioinformatics.
- scalepopgen: Bioinformatic Workflow Resources Implemented in Nextflow for Comprehensive Population Genomic Analyses.
- Firalink: A bioinformatics pipeline for long non-coding RNA data analysis.
- Closha 2.0: a bio-workflow design system for massive genome data analysis on high performance cluster infrastructure.
- Graph-based contrastive learning enables unified integration and niche transfer across single-cell and spatial multi-omics.
- Scipion3: A workflow engine for cryo-electron microscopy image processing and structural biology.