Why Are My RNA-seq Reads Not Mapping?
By Dr. Zubair Khalid, DVM, MS, PhD ·

The single most common reason RNA-seq reads fail to align is a mismatch between the reads and the reference you are mapping them against. The genome build is wrong, the index was built from a different FASTA than the GTF you expect, the reads belong to a different species, or the library is dominated by adapter and contaminant sequence that no aligner can place. Before you question your RNA quality or your aligner parameters, check two things. First, open the alignment summary log from STAR or HISAT2 and read the overall mapping percentage. Second, run FastQC on the raw reads and look at the adapter content and overrepresented sequences modules. Those two artifacts resolve the majority of cases where someone asks why their RNA-seq reads are not mapping.
This article walks through the causes in order of frequency, explains the mechanism behind each failure mode, gives you a concrete diagnostic sequence, and ends with prevention practices that keep the problem from recurring. The framing applies to bulk short-read RNA-seq first, with separate treatment for small RNA, spatial, single-cell, and long-read data, because those protocols fail in distinctive ways.
The Five-Minute Diagnostic Sequence
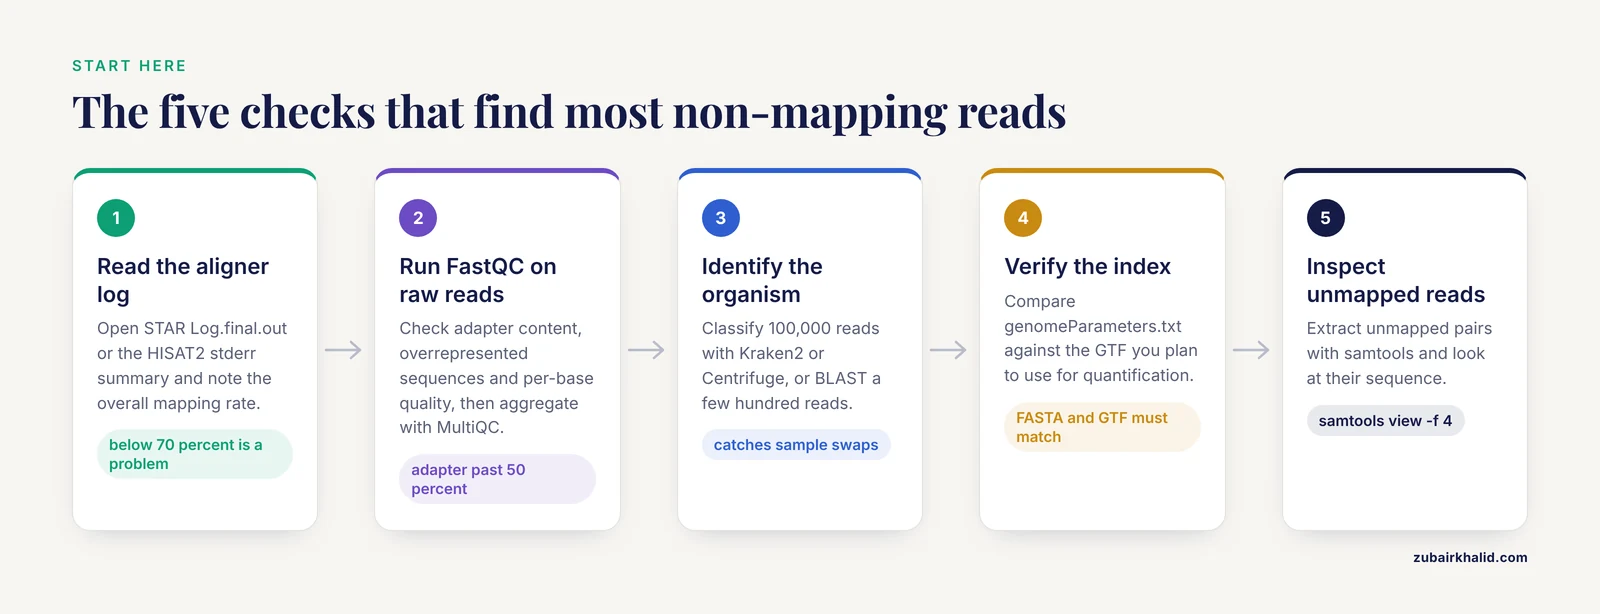
Run these checks in order. Most readers find their culprit by step three.
- Read the aligner log. STAR writes
Log.final.outwith the overall mapping rate, the uniquely mapped fraction, the multimapper fraction, and the splices-per-read statistics. HISAT2 prints a summary to stderr that you should always tee into a file. An overall rate below 70 percent for a clean bulk RNA-seq library signals a fundamental problem rather than a parameter-tuning problem. - Run FastQC or fastp on a handful of raw FASTQ files and aggregate with MultiQC. Look at per-base quality, adapter content, overrepresented sequences, and per-tile quality. Adapter content climbing past 50 percent of reads at the 3-prime end means the library had short inserts and read-through.
- Identify the organism from the reads themselves. Take 100,000 reads and run them through Kraken2 or Centrifuge against a broad database, or BLAST a few hundred reads on the NCBI website. This catches sample swaps, cross-species contamination, and mislabeled FASTA files faster than any other method.
- Verify your index. Most aligners write a
genomeorgenomeParameters.txtfile into the index directory that records the exact FASTA used, the date of the build, and the command line. Compare that against the GTF annotation you plan to use for quantification. A GTF for GRCh38 paired with an index built from hg38 plus nonstandard contigs, or an index built from mm9 paired with an mm10 GTF, produces alignable reads but unassignable genes. - Count unmapped reads directly and look at them. With samtools you can extract unmapped pairs and inspect their sequence.
samtools view -c -f 4 aligned.bam          # count unmapped reads
samtools view -f 4 aligned.bam | head -n 100 | cut -f 10 > unmapped_seqs.fa
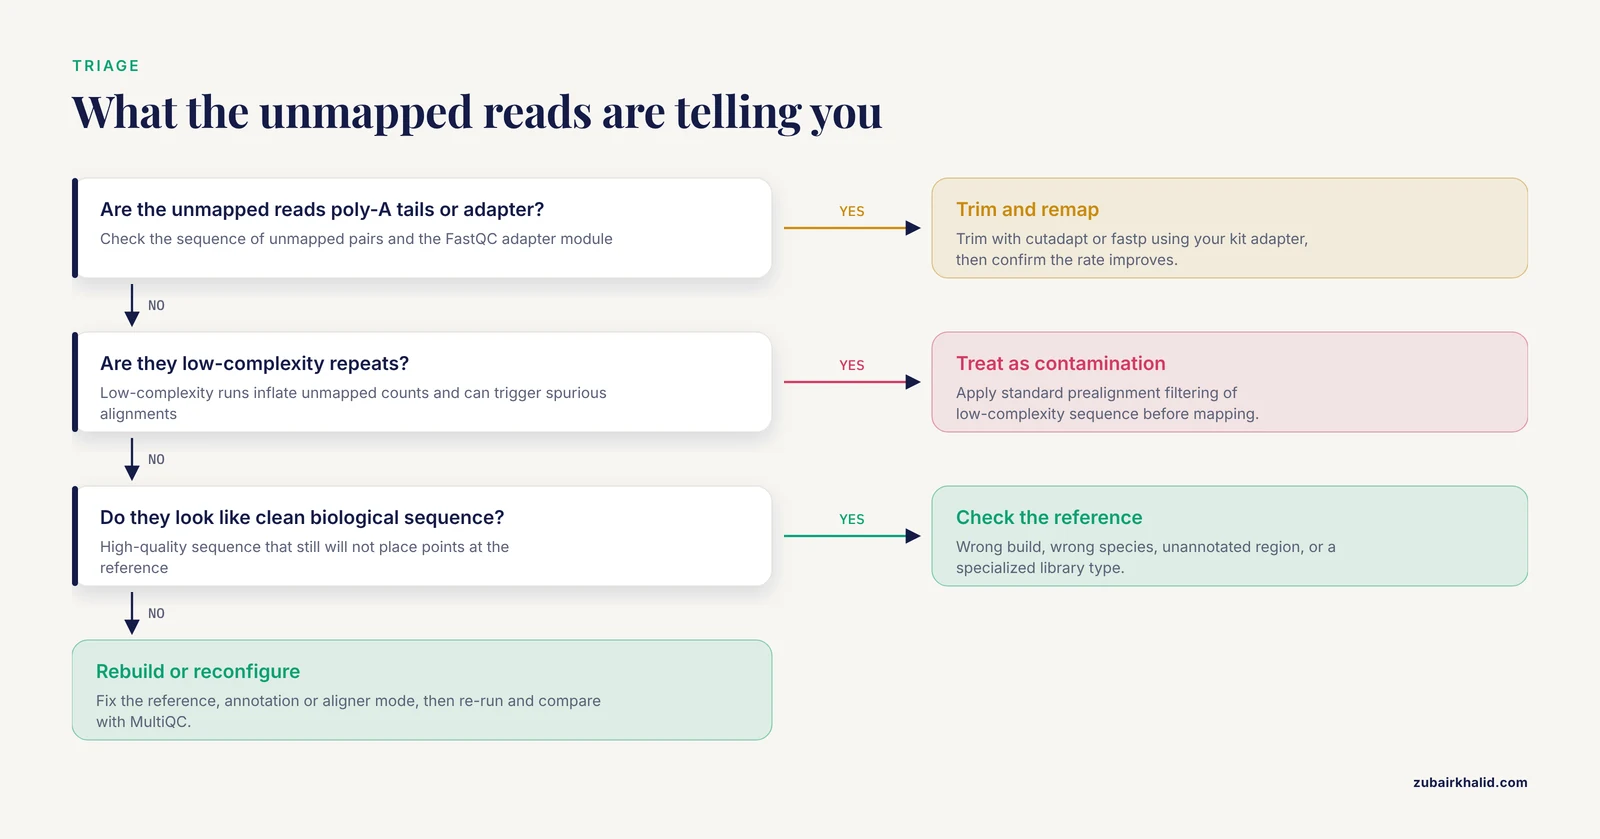
If the unmapped reads are poly-A tails, you are looking at adapter and read-through problems. If they are low-complexity repeats, you are looking at contamination. If they look like clean, high-quality biological sequence, you are looking at the wrong reference, an unannotated region, or a specialized library type the aligner was not configured for.
Troubleshooting Table
This table is the core of the workflow. Work top to bottom, since the rows are ordered from most to least common.
| Symptom | Likely cause | How to confirm | Fix |
|---|---|---|---|
| Overall alignment rate near zero for every sample | Wrong reference genome or wrong species | BLAST 1,000 unmapped reads, check index metadata file | Rebuild the index from the correct genome FASTA |
| Alignment rate was fine last week, terrible now | Index overwritten, path changed, or FASTA swapped | Compare index checksums and command-line logs across runs | Rebuild the index, pin versions in a workflow manager |
| FastQC shows adapter content rising to high levels at the 3-prime end | Adapter read-through from short inserts | Check insert size distribution and overrepresented sequences | Trim with cutadapt or fastp before alignment |
| Large fraction of reads flagged as rRNA or mitochondrial | rRNA or mtRNA carryover contamination | Align a subset to rRNA and mtDNA reference sequences | Filter rRNA reads, verify depletion protocol worked |
| Reads map well but featureCounts or HTSeq assigns very few | Annotation GTF does not match the genome build or lacks the relevant features | Compare GTF contig names and coordinates against the index | Use a GTF built for the exact same FASTA and build |
| Splice junction counts absurdly low, many soft-clipped reads | Splice-aware alignment disabled or wrong settings | Check the aligner log for junction statistics | Enable splice-aware mode and supply the GTF as a junction database |
| Alignment rate differs drastically between sample groups | Batch effect, degraded RNA subset, or different library prep | Plot alignment metrics against batch and RIN values | Treat affected samples separately, re-extract degraded RNA |
| Nearly all reads multimapping in repetitive regions | Genuine biology (repeats, paralogs, pseudogenes) rather than an error | Inspect multimapper genomic locations in IGV | Choose an explicit multimapper policy, consider EM-based quantifiers |
| Spatial or single-cell data aligns but cell or spot assignment is low | Barcode quality or whitelist mismatch | Check barcode QC module and whitelist version | Verify whitelist matches the kit chemistry version |
| Small RNA data aligns at very low rates | miRNA adapters differ from mRNA adapters, tiny inserts | Inspect read length distribution, check 3-prime adapter position | Use small-RNA-specific trimming settings and a sncRNA-aware quantifier |
Cause 1: The Wrong Reference Genome or Build
This is the failure mode that eats entire afternoons. It takes two flavors. The first is straightforward: the reads are human and the index is mouse, or the index is mouse and the reads are human, and the log shows an alignment rate in the single digits. The second is subtler and far more common: the reads and the reference are both human, but the reference assembly is a poor match for the sample's ancestry or for the biology you care about.
The choice of reference assembly has measurable consequences for mapping. In a study of breast cancer RNA-seq from Chinese patients, the authors compared the standard GRCh38 reference against T2T-CHM13 and the East Asian-matched T2T-YAO assembly. Mapping to YAO reduced multi-mapped reads approximately three-fold and increased confidently exon-assigned reads compared with GRCh38. When YAO-assigned reads were re-mapped to GRCh38, 19.91 percent changed gene assignment, with a mean of 1,016 genes per sample showing more than ten-fold expression differences, and 8,432 genes across the cohort showed such discrepancies. Those genes were enriched for receptor, ion channel, and drug metabolism functions, and the reference-dependent differences propagated into differential expression, immune cell inference, fusion detection, and classifier performance [1].
The lesson for troubleshooting is direct. If your alignment rate and your gene assignments both look poor, and the biology involves a population or ancestry underrepresented in the standard reference, the reference itself may be the limiting factor. Check which assembly version your index was built from, confirm that your annotation matches it exactly, and consider whether an alternate assembly or a population-matched variant-aware reference would change the picture.
A related and easily overlooked variant is index and annotation version mismatch. Every aligner index should carry provenance metadata. STAR's genomeParameters.txt records the genome FASTA filename and the full command line used to build the index. If you cannot reconstruct which FASTA built your index, rebuild it. Reference version hygiene is the cheapest form of insurance against an entire class of rna seq error reports that look like alignment failures but are actually assignment failures.
Cause 2: Adapter, rRNA, and Other Contaminant Sequence
Sequencing by synthesis does not stop at the insert boundary. When the insert is shorter than the read length, the sequencer reads into the adapter, and the tail of every such read is synthetic sequence that will not align to anything. On a library with many short fragments, this can drag the alignment rate down by tens of percentage points.
FastQC flags this in the adapter content module, and the fix is deterministic trimming with a tool such as cutadapt or fastp.
cutadapt -a AGATCGGAAGAGC -A AGATCGGAAGAGC \
  -m 25 -o sample_R1.trim.fastq.gz -p sample_R2.trim.fastq.gz \
  sample_R1.fastq.gz sample_R2.fastq.gz
The standard Illumina TruSeq adapter sequence shown above is a starting point. Confirm the actual adapter against your library preparation kit documentation, because the correct sequence differs between kits, and a wrong adapter string produces the same symptom you started with.
The second major contaminant class is ribosomal RNA. In poly-A-selected libraries, rRNA carryover is usually small. In rRNA-depleted (total RNA) libraries, a failed or partially effective depletion can leave rRNA as the dominant species. A distinctive symptom is a library where the alignment rate looks reasonable but the vast majority of mapped reads land on a handful of rRNA and mitochondrial features, leaving the protein-coding portion starved. The composition of rRNA-derived reads carries real biological information in some contexts. Work on Ribo-seq datasets has shown that rRNA reads follow reproducible patterns that reflect ribosome composition and that protocol factors influence the rRNA read distribution across libraries [2]. For standard RNA-seq troubleshooting, though, an excess of rRNA reads is a wet-lab QC signal. Quantify it by aligning a subset of reads to an rRNA reference with Bowtie2, or by running featureCounts against an annotation that includes rRNA genes, and flag samples whose rRNA fraction deviates from the rest of the cohort.
Poly-A tails and low-complexity runs are the third contaminant class. These inflate the unmapped read count and can also trigger spurious alignments if the aligner's seed settings are permissive. Standard prealignment filtering of low-complexity sequence is cheap and harmless for bulk RNA-seq.
Cause 3: Aligner Mode and Reference Type Mismatch
RNA-seq reads cross splice junctions. A junction-spanning read has its left half matching one exon and its right half matching another exon that may be megabases away in the genome. A DNA-style aligner in contiguous-alignment mode cannot place such a read. This is why RNA-seq requires a splice-aware aligner such as STAR or HISAT2, or a pseudoalignment quantifier such as Salmon or kallisto that works against a transcriptome.
Within this framework, the reference type itself creates a tradeoff. RiboFlow v2, a ribosome profiling pipeline that added genome alignment and configurable multimapper handling to an existing transcriptome workflow, illustrates the issue cleanly. Alignment to a curated transcriptome captures most signal, but it misses ribosome activity when expressed exons are absent from the selected transcript sequences. Genome alignment expands the detectable sequence space, but it exposes ambiguity between homologous loci. Using 24 human ribosome profiling libraries with matched RNA-seq, the authors found that nucleotide-level coverage and translation efficiency estimates were broadly concordant between alignment strategies under stringent filters, yet individual genes showed substantial differences, driven by alternative exons absent from the chosen transcripts and by ambiguous alignments between protein-coding genes and processed pseudogenes [3].
The troubleshooting implication: if your alignment rate is decent but your coverage looks wrong in specific genes, check whether those genes' exons are fully represented in the transcriptome or annotation you are using. A gene whose expression is real but whose exon structure is incompletely annotated will show low or zero assignment under a transcriptome-only strategy. Conversely, a suspiciously high signal at a pseudogene under genome alignment is more likely to be ambiguous mapping than genuine expression.
Cause 4: Degraded or Low-Quality Input RNA
RNA degradation shows up in the reads before it shows up in the alignment log. Fragmented RNA produces short effective inserts, heavy adapter read-through, and a skewed coverage profile that decays toward the 3-prime end of transcripts. In severe cases, per-base quality collapses and the aligner's seed matches fail outright.
The Bioanalyzer or TapeStation RIN (RNA Integrity Number) is the standard pre-sequencing check. Degraded samples will not be rescued by trimming or parameter changes, and pretending otherwise wastes sequencing money. For the subset of samples in a cohort with poor RIN values, extract fresh RNA if the material allows, or analyze affected and unaffected samples separately and report the limitation.
A safety note on the extraction step, since it is where the fix happens. Many RNA extraction protocols use phenol- and guanidinium-based reagents such as TRIzol, sometimes with beta-mercaptoethanol added. Phenol is corrosive and readily absorbed through skin, and beta-mercaptoethanol is toxic by inhalation. Handle both in a certified chemical fume hood with nitrile gloves, lab coat, and eye protection, and collect phenol waste in a dedicated halogenated organic waste container according to your institution's chemical hygiene plan.
Cause 5: Strandedness Mismatch
RNA-seq library kits differ in whether the sequencing read reflects the mRNA strand (antisense, the common case for dUTP-based methods) or the sense strand. If you tell the aligner or quantifier the wrong strandedness, reads still map, but feature assignment collapses, and in some pipelines reverse-stranded settings against a forward-stranded library produce apparent failures at the annotation stage that are misdiagnosed as mapping failures.
You can infer strandedness empirically. Run RSeQC's infer_experiment.py against a reference annotation, or examine the read distribution across genes annotated on both strands. MultiQC aggregates these outputs across a project, which makes a systematic strandedness error in one batch obvious. Fix the setting, re-run quantification, and document the correct value in the project metadata so the same mistake does not recur.
Cause 6: Multi-Mapping to Repeats, Paralogs, and Pseudogenes
Not every alignment failure is a low alignment rate. A frequent and harder-to-spot failure is that reads align fine but to the wrong place, or to many places at once, and the downstream treatment of those multimappers silently distorts the counts.
Three biological features drive this.
Transposable elements. Repeats are scattered across the genome, so a read derived from a transcribed TE maps to many loci simultaneously. A recent comparison of TE quantification tools found that Telescope, a locus-level TE quantifier, attributed over 40 percent of total TE signal to the 1.1 percent of loci that overlap gene exons, because reads from overlapping genes and TEs were indistinguishable. The MAJEC method addresses this with a joint Expectation-Maximization framework over genes, isoforms, and TE loci, reducing exon-overlap contamination from 43 percent of total signal to 5 percent while preserving subfamily-level concordance with TEtranscripts [4]. If your region of interest is repetitive, your multimapper policy is not a technical footnote. It is the analysis.
Pseudogenes. Processed pseudogenes are reverse-transcribed copies of functional genes that can share 90 percent or more sequence identity with their parent. A clinical example makes the stakes concrete. Biallelic HYDIN variants cause primary ciliary dyskinesia, but HYDIN diagnosis is difficult because a 98 percent homologous pseudogene, HYDIN2, confounds short-read mapping. RNA-seq from patients' cultured nasal epithelium, with genome-aligned reads inspected manually in IGV, resolved 11 of 13 diagnostically ambiguous cases by detecting aberrant splicing events that genetic testing alone could not [5]. The generic lesson: for genes with close pseudogene paralogs, examine multimapping read placement directly rather than trusting a single best alignment, and consider pair-ended constraints, longer reads, or locus-specific quantification.
Small RNAs. Small non-coding RNA-seq faces the same problem in an extreme form, because mature microRNAs and other sncRNAs can be identical or near-identical across many genomic loci. Conventional gene-centric pipelines either discard multi-mapping reads or impose arbitrary one-locus assignments, which biases quantification. The PerSeqPIPE workflow takes a sequence-centric approach, quantifying each unique read sequence and annotating it with all compatible genomic and transcriptomic features, which revealed multi-mapped sncRNAs and isomiR diversity that standard approaches obscured [6]. If your small RNA alignment rates look low, part of the answer may be that the data are behaving normally and your pipeline is discarding signal by policy.
Decide your multimapper policy explicitly, in writing, before quantification: unique-only, random assignment, fractional EM assignment, or locus-level probabilistic modeling. Each choice is defensible for a different question. No choice is defensible if it was made by a tool default that nobody read.
Cause 7: Barcode and Adapter Plumbing in Specialized Assays
Spatial and single-cell assays add another layer of sequence between your biological insert and the reference. In Visium HD, transcript positions come from sequenced barcodes matched against a list of coordinate barcodes mapping to capture locations. An analysis of Space Ranger's per-read output found that where two coordinate barcodes overlap, the shorter being the longer without its first base, Space Ranger records the shorter barcode even though the longer one matches with fewer edits, placing 0.5980 percent of decodable reads at a location that is not among the closest matches, and leaving 0.2916 percent of reads unplaced [7]. Those percentages are small, but they are systematic, and in a troubleshooting context they matter. If your spatial or single-cell data show low per-cell or per-spot assignment with reasonable overall alignment, audit the barcode handling step before blaming the aligner. Confirm that the barcode whitelist matches your kit chemistry version exactly, since an outdated whitelist produces a clean-looking but deeply lossy assignment.
Cause 8: Low-Abundance Targets That Cannot Be Recovered by Mapping Alone
Sometimes the reads are not mapping to your target of interest because the target barely exists in the library. The clearest example is immune repertoire recovery. Reviews of head-to-head benchmarking studies that performed matched RNA-seq and TCR-seq on the same samples found that standard bulk RNA-seq typically recovers only 3 to 5 percent of the unique TCR clonotypes identified by dedicated TCR sequencing, with low-frequency clones heavily underrepresented. Tools such as MiXCR and TRUST4, optimized for TCR-enriched samples, remain limited on bulk and single-cell RNA-seq due to low transcript abundance and sparse coverage, though in T cell-rich tissues with high sequencing depth and optimized pipelines, most high-frequency clonotypes can be captured [8]. If your goal is a low-abundance sequence class rather than transcriptome-wide expression, low recovery is a property of the assay, not a mapping error, and the remedy is enrichment, depth, or a dedicated assay.
Cause 9: Protocol-Driven Read Length and Content Problems
Some protocols generate reads that are intrinsically hard to map. Chemical conversion methods are a good example. GLORI-seq quantifies m6A modification by converting unmodified adenosine to inosine, which produces short reads dominated by only three kinds of nucleotides. Applied to chromatin-associated RNAs, which contain large fractions of intronic and intergenic sequence, the native protocol mapped poorly. An optimized library construction that enriched longer cDNA fragments significantly improved read length and mapping accuracy on those samples [9]. Two general lessons follow. First, when a protocol chemically alters sequence or enriches repetitive and non-exonic fractions, expect degraded mappability and design the fragment length accordingly. Second, read length is a mappability lever. If your insert sizes ran short and the resulting alignment rate is poor, no computational fix fully restores what the library prep lost.
Cause 10: Non-Model Organisms with Incomplete References
In non-model organisms, low alignment rates frequently reflect the reference, not the reads. A draft assembly with fragmented contigs, unrepresented heterochromatic regions, and incomplete annotation will absorb fewer reads than a mature reference. The remedy is investment in the reference. A recent king penguin genome resource illustrates what that looks like in practice: a haplotype-resolved, chromosome-level assembly with 95 percent of the sequence assigned to chromosomes, a primary haplotype with 97.2 percent BUSCO completeness, and gene prediction supported by an extensive multi-tissue RNA-seq dataset, yielding 18,081 predicted protein-coding genes with 17,081 functionally annotated [10]. For a project on a species at an earlier stage, the practical sequence is to assess assembly completeness with BUSCO, quantify how much of your RNA-seq aligns, and if the gap is large, invest in better assembly and annotation rather than in ever more aggressive aligner tuning.
Cause 11: When Short Reads Are Fundamentally Ambiguous and Long Reads Are the Answer
Some ambiguity cannot be fixed by any short-read pipeline, because the information simply is not in a 100 to 150 base read. Long-read RNA-seq addresses this directly. In a rare disease cohort, long-read RNA sequencing produced an average of 13.4 million full-length non-chimeric reads per individual and yielded more uniform coverage across transcripts than paired short-read RNA-seq, with 20.2 percent of long-read transcripts exceeding 10 kb versus under 5 percent from short reads. The long reads resolved ambiguously or incorrectly mapped short-read signal, identified a mean of 24,439 isoforms per sample of which 18.5 percent were unannotated in GENCODE, and located 74.3 percent of those unannotated isoforms within disease-associated genes [11].
Multi-sample long-read studies add a reconstruction-level decision that parallels the mapping decisions above. A benchmark across PacBio and ONT datasets defined two strategies: Join and Call, where reads from all samples are combined before transcript reconstruction, and Call and Join, where reconstruction runs per sample before annotations are combined. Join and Call was generally preferable for discovering novel isoforms, while Call and Join often worked better for highly replicated datasets where novelty discovery is secondary, and the optimal choice depended on the reconstruction tool [12]. If your long-read data map oddly across samples, check whether your reconstruction strategy is appropriate for your replication level and objective.
Worked Example: Reading a Real Alignment Log
Here is the decisive content of a STAR Log.final.out for a healthy human bulk RNA-seq sample, with typical values for a clean poly-A library:
Number of input reads                       | 42,000,000
Uniquely mapped reads number                | 36,500,000
Uniquely mapped reads %                     | 86.90
Average mapped length                       | 148.20
Number of splices: Total                    | 14,200,000
Number of splices: Annotated (sjdb)         | 13,900,000
Mismatch rate per base                      | 0.28%
Deletion rate per base                      | 0.01%
An overall mapping rate around 90 percent or above, with splices overwhelmingly annotated, is what a well-behaved sample looks like. The corresponding failure patterns are easy to name once you know what healthy looks like:
- Overall rate near zero. Wrong species, wrong build, or a catastrophic library problem.
- Overall rate fine but unique fraction low, multimapper fraction high. Repetitive content, pseudogene ambiguity, or a degraded reference match. Examine where the multimappers go.
- Overall rate moderate, splices mostly unannotated. Potentially novel biology, but also possibly a wrong or stale annotation. Cross-check against a current GENCODE or Ensembl release.
- Overall rate fine for controls, terrible for treated samples. Check RNA integrity and library prep batch for the affected group before suspecting the biology.
Run MultiQC over every sample so these numbers are compared across the project, not eyeballed one file at a time. The most informative diagnostic is a deviation of one sample or one batch from its peers, and MultiQC makes that visible in a single plot.
Common Mistakes and Limitations
- Diagnosing from a single sample. One sample with a low alignment rate tells you almost nothing. Aggregate metrics across the project with MultiQC and look for patterns by batch, RIN, and library prep.
- Aggressive trimming as a reflex. Over-trimming shortens reads, which reduces mappability. Trim what FastQC demonstrates is present, verify the alignment rate improves, and stop.
- Treating multimappers as trash by default. Discarding them is sometimes correct, but for repeat-rich biology, pseudogene-adjacent genes, and small RNAs it silently biases results. Decide the policy per project.
- Comparing alignment rates across different references. A higher alignment rate on assembly A does not mean A is better. The YAO comparison showed that reference choice shifts both mapping and gene assignment in ways that propagate into downstream interpretation [1].
- Confusing alignment with assignment. Reads can align beautifully and still be assigned to the wrong or no gene because the GTF does not match the genome FASTA. Check both stages separately.
- Assuming the aligner is at fault. In practice the aligner is the last thing to blame. The reference, the annotation, the adapters, the contamination, and the metadata are each more likely culprits.
- Ignoring that individual experimental cases need domain-specific judgment. The patterns here cover the common failure modes, but a specific project may combine several at once, and the diagnosis should follow the evidence in that project's logs.
Prevention Practices
- Record index provenance. Store the genome FASTA filename, version, MD5 checksum, and build command alongside every index, in a README inside the index directory. STAR already writes
genomeParameters.txt. Never delete it. - Pair FASTA and GTF by construction. Download the genome and annotation from the same source and release in a single scripted step, so a mismatch cannot creep in between them.
- Use a workflow manager. Snakemake or Nextflow makes every command, parameter, and reference version part of the executed specification rather than shell history. Container images (Docker or Apptainer) pin tool versions.
- Run MultiQC on every project from day one. Early detection of an adapter or quality shift in one batch is a one-line note in the lab book. Late detection is a re-sequencing request.
- Pilot with a small subset. Map 500,000 reads from one sample before committing to a full-scale run. Most reference, species, and adapter problems are visible at pilot scale within minutes.
- Write down the multimapper policy, the strandedness, and the annotation release before quantification, and keep those three facts with the results.
- Keep raw FASTQ files. Annotation revisions are continuous, and downstream decisions about assignment and multimapping should be revisitable against the original reads rather than against a frozen count matrix.
Frequently Asked Questions
What alignment rate is acceptable for RNA-seq?
For clean bulk RNA-seq from a well-annotated model organism, expect roughly 90 percent or more of reads to align overall, with the majority uniquely placed. Well below 70 percent signals a reference, contaminant, or quality problem rather than normal biology, and deserves investigation before analysis proceeds.
Should I trim adapters before mapping?
Yes, if FastQC or fastp shows adapter content, which happens whenever inserts are shorter than the read length. Trim with cutadapt or fastp using the adapter sequence from your kit documentation, then confirm the alignment rate improves. Do not trim aggressively beyond what the QC data show.
Why do my reads map but to the wrong genes?
Reads usually land on the wrong genes because of multi-mapping into paralogs, pseudogenes, or repetitive elements, or because the annotation GTF does not match the genome build of the index. Check where multimappers go, verify FASTA and GTF compatibility, and set an explicit multimapper policy for quantification.
Can I map RNA-seq reads to a transcriptome instead of the genome?
You can, and pseudoalignment quantifiers such as Salmon and kallisto do exactly that. The tradeoff is that a transcriptome-only strategy misses signal from expressed sequence absent from the selected transcripts, while genome alignment exposes ambiguity between homologous loci. Choose based on whether your question needs locus resolution or transcript-level counts.
What should I do with multi-mapping reads?
Decide explicitly: discard them, assign them randomly, distribute them fractionally with an Expectation-Maximization model, or quantify at a level that models the ambiguity. The right choice depends on your question. Repeats, pseudogenes, and small RNAs each call for different treatment, and an unexamined tool default is the one unacceptable answer.
Why are my reads not mapping to the expected species?
Run a taxonomic classifier such as Kraken2 or Centrifuge on a subset of reads, or BLAST a few hundred reads directly. Common explanations are sample swaps, cross-species contamination, a mislabeled reference FASTA, or a genuinely divergent sample. The classifier result tells you which.
How do I tell adapter contamination from rRNA contamination apart?
FastQC distinguishes them for you. Adapter contamination appears in the adapter content module and in overrepresented sequences that match known adapter sequence. rRNA contamination shows up as a large mapped fraction landing on rRNA gene features, which you can quantify by aligning a subset of reads against an rRNA reference or counting features with an annotation that includes rRNA genes.
When should I switch to long-read sequencing?
When short-read ambiguity is the bottleneck rather than quality or contamination. Full-length long reads resolve ambiguously mapped short-read signal, recover isoforms unannotated in GENCODE, and produce uniform coverage across transcripts including transcripts longer than 10 kb. It is the appropriate tool when isoform structure, pseudogene-adjacent genes, or fusion context matters more than raw depth.
Sources
- Reference Genome Choice Shapes RNA-Seq Quantification and Downstream Interpretation in Chinese Breast Cancer Patients.
- Ribo-seq rRNA reads reveal co-predicted signatures of ribosome heterogeneity and collisions.
- RiboFlow v2: a configurable ribosome profiling pipeline reveals measurements sensitive to read-mapping methodology.
- MAJEC: unified gene, isoform, and locus-level transposable element quantification from RNA-seq.
- RNA sequencing significantly improves HYDIN diagnosis and defines the effects of common deletions in primary ciliary dyskinesia.
- PerSeqPIPE: Nextflow workflow for per-sequence analysis of small RNA-sequencing data.
- STARgrid: an open-source pipeline from Visium HD sequencing reads to count matrices.
- Recovering CDR3 sequences from RNA-seq data: a critical assessment of computational and experimental strategies.
- Optimized GLORI-Seq of Chromatin-Associated RNAs.
- A chromosome-level genome of the king penguin (Aptenodytes patagonicus): a resource for linking genotype to fitness in a long-lived vertebrate.
- Long-read RNA sequencing improves isoform and splicing outlier detection in whole blood from rare disease trios.
- Handling biological replicates in long-read RNA sequencing data by joining or not joining.