Why Do My RNA-seq and Microarray Results Disagree?
By Dr. Zubair Khalid, DVM, MS, PhD ·

You ran the same biological comparison on two platforms. The microarray gives you one differential expression list. The RNA-seq gives you another. The overlap looks thin, a few genes even point in opposite directions, and now you are wondering which platform failed. The most likely answer is neither. RNA-seq and microarray differential expression discrepancies are usually caused by measurement differences between the platforms themselves, including different signal scales, different probe chemistries, and different dynamic ranges, rather than by a mistake in your pipeline [1].
The first thing to check is not the gene lists. It is the direction of change. Take every gene that is called differentially expressed on both platforms and ask one question: do the log fold changes have the same sign? If 80 to 90 percent of shared calls agree in direction, your data are fine and your threshold-based lists are simply drawn at different points on two different scales. If directions disagree for a large fraction of shared genes, then you have a real problem, and the usual suspects are annotation mismatch, batch effects, or genuinely different biological material.
This guide walks through the causes from most common to rarest, explains the mechanism behind each one, gives you a short diagnostic sequence, and finishes with concrete fixes and prevention practices. It is written for the bench scientist or analyst who has both datasets in hand and needs a decision, not a lecture.
Start Here: A Ten-Minute Diagnostic Sequence
Run these checks in order before touching anything else. Each one takes minutes and eliminates or confirms an entire class of causes.
- Check per-platform QC first. For the microarray, look at relative log expression (RLE) and normalized unscaled standard errors (NUSE) plots. For the RNA-seq, check mapping rate, duplication rate, and library size distribution. A single failed array or a single low-complexity library can dominate your impression of platform disagreement.
- Harmonize gene identifiers. Convert both datasets to the same identifier system, ideally Ensembl gene IDs or up-to-date Entrez IDs, using a current annotation build. A large fraction of apparent non-overlap is simply identifier drift.
- Recompute both analyses from raw data. For RNA-seq, start from the count matrix, filter low-count genes, and use DESeq2 or edgeR. For the microarray, start from CEL files, background correct, quantile normalize, and use limma. A common RNA-seq error is rerunning the comparison on a pre-filtered or pre-normalized object left over from an earlier analysis.
- Test direction concordance. For all genes significant on both platforms, calculate the fraction with matching fold-change sign. Also compute the Spearman correlation between the fold changes of all genes measured on both platforms.
- Scatter the effect sizes. Plot log2 fold change from RNA-seq against log2 fold change from the microarray for all shared genes. A tight diagonal with scatter means agreement with different sensitivity. A flat cloud means real disagreement that needs a mechanistic explanation.
- Look at the genes that disagree. Are they low abundance? Are they genes with many isoforms? Are they probe-poor on the array? The pattern of disagreement usually tells you the cause.
If step 4 shows strong direction concordance, stop troubleshooting the biology and start troubleshooting your reporting thresholds. If it does not, work down the cause list below.
The Core Troubleshooting Table
| Symptom | Likely cause | How to confirm | Fix |
|---|---|---|---|
| Gene lists barely overlap, but shared genes point the same way | Significance thresholds applied to incomparable scales, plus platform sensitivity differences | Rank-overlap analysis, Spearman correlation of fold changes on shared genes | Report direction-concordant genes, compare ranks instead of p-value cutoffs [2] |
| Same gene shows opposite fold-change signs | Probe maps to the wrong transcript, multiple probes disagree, or isoform-specific regulation the probe cannot resolve | BLAST each probe sequence against the current transcriptome, inspect per-probe signal | Reannotate probes, drop cross-hybridizing probes, summarize at the isoform level [3] |
| RNA-seq calls many more differentially expressed genes | Higher dynamic range and detection of low-abundance transcripts, plus the array's expression ceiling | Compare number of genes expressed above background on each platform, MA plots | Filter low counts, compare within matched dynamic range, report both whole-transcriptome and high-confidence subsets |
| Fold changes look compressed on the microarray | Intensity saturation and background compression of fluorescence measurements | MA plots, distribution of fold-change magnitudes by expression level | Use rank-based or probabilistic cross-platform methods [1][2] |
| Samples cluster by batch or platform, not by condition | Batch effects from library prep, lab, date, or scanner | PCA colored by batch, RLE plots | Include batch in the design matrix, use ComBat or similar removal on matched designs only |
| Bulk tissue calls vanish when you look at the right cells | Cell-composition differences between the compared samples | Cell-type deconvolution, spatial or single-cell validation | Use matched samples, deconvolve, or validate at cellular resolution [4] |
| The same comparison flips direction depending on tissue | Context-dependent biology, not a platform artifact | Stratify by tissue and rerun | Analyze per tissue, never pool tissues that behave differently [5] |
| Tag-based RNA-seq misses genes the array finds | Missing tag sites in an incomplete reference transcriptome | Check whether each gene has an unambiguous tag site in the reference | Use full-length transcriptome references or non-tag-based workflows [6] |
Why RNA-seq and Microarray Differential Expression Discrepancies Happen
Cause 1: The Platforms Measure Different Things
This is the most common cause and the one researchers most often underestimate. A microarray does not measure RNA. It measures the fluorescence of labeled cDNA or cRNA hybridized to immobilized probes, and the raw signal is an intensity whose relationship to transcript abundance is nonlinear and compresses at both ends of the range. RNA-seq counts sequencing reads, and the raw signal is an integer count whose precision grows with depth. Differences in measurement scales, probe chemistries, and signal distributions create systematic discrepancies across platforms even when the underlying biology is identical [1].
Three consequences follow. First, fold-change magnitudes are not comparable, so a log2 fold change of 2 on an array and a log2 fold change of 2 in RNA-seq do not describe the same biological effect size. Second, the platforms differ in sensitivity at the extremes. Arrays saturate for very highly expressed genes and drown in background for very low abundance genes, while RNA-seq retains usable signal across a wider span. Third, the noise structure differs. Microarray noise is dominated by hybridization and background, RNA-seq noise by sampling variability that depends on count depth. A statistical model tuned for one noise structure will misjudge the other, which produces different significant gene lists even from identical fold changes.
The practical implication is that you should almost never compare p-value thresholds or fold-change magnitudes across platforms. You should compare directions, ranks, and categories. Modern cross-platform methods are built around exactly this insight. PXN, a probabilistic machine learning framework for cross-technology integration, learns a unified representation of biological signal and can translate data between platforms, and in benchmarking it bridges even the microarray to RNA-seq divide while outperforming existing normalization methods in cross-platform accuracy [1].
Cause 2: Probes and Annotations Point at Different Transcripts
Microarray probes are short oligonucleotides designed against transcript sequences that were current when the array was manufactured, often twenty years ago. Genome annotations have changed since then. Some probes now map to genes that no longer exist under the same name, some map to multiple genes, and some sit in regions that were once believed to be exons. When you summarize a probe set to a gene symbol using a stale annotation table, you can silently merge measurements from different genes or split one gene across several probe sets, and either error can flip a fold-change sign.
The isoform problem is deeper than stale annotation. A probe set typically targets a limited set of exons, often near the 3-prime end, and cannot distinguish transcript isoforms that share those exons. RNA-seq reads span the transcript and can, in principle, resolve isoforms. When a gene has isoforms with opposite regulation, the two platforms are not measuring the same quantity at all. This is not a hypothetical edge case. In colorectal cancer cell lines engineered to express individual hepatocyte nuclear factor 4-alpha isoforms, the P1-driven isoform HNF4-alpha2 acted as a tumor suppressor while the P2-driven isoform HNF4-alpha8 did not, and the two isoforms regulated distinct sets of genes and recruited the Wnt mediator TCF4 to distinct binding sites [3]. A microarray probe that cannot tell those isoforms apart, paired with RNA-seq quantification that can, will produce contradictory results for every HNF4 target gene.
Diagnosis is straightforward. Pull the probe sequences for your discrepant genes, BLAST them against the current transcriptome, and check whether each gene has multiple probes and whether those probes agree with each other. If the probes disagree with one another, your discrepancy is annotation, not biology.
Cause 3: Incomplete References and Missing Features
A subtler version of the annotation problem affects RNA-seq itself. Quantification is only as good as the reference sequences the reads are mapped to, and workflows differ in how much of the transcriptome their reference actually contains. The siphonophore study by Siebert and colleagues is the cleanest demonstration in the literature. They compared three short-read expression workflows, Illumina mRNA-Seq, which samples reads randomly along each transcript, and two tag-based approaches, SOLiD SAGE and Helicos DGE, which sample reads only at particular tag sites. When all assembled reference sequences were considered, Illumina mRNA-Seq detected more than twice as many differentially expressed reference sequences as the tag-based workflows, and the discrepancy was largely caused by missing tag sites in the partial references, which produced false negatives in the tag-based workflows. When the analysis was restricted to reference sequences that unambiguously possess tag sites, the workflows showed broad concordance [6].
The lesson generalizes far beyond marine invertebrates. If your RNA-seq experiment used a tag-based or 3-prime-end-biased protocol, genes whose tag sites or annotated regions are missing from your reference will look non-expressing or non-differential for purely technical reasons, while the microarray, which probes its own curated set of sequences, will still detect them. The fix is to restrict the comparison to genes unambiguously measurable on both platforms, or to rebuild the reference so both platforms can see the full gene set.
Cause 4: Statistical Models Treat Noise Differently
Differential expression is a model output, not a direct measurement, and the two platforms are analyzed with different model families by default. Microarray analysis uses limma's empirical Bayes moderated linear models on log-scale intensities, where variance is shrunk toward a global value. RNA-seq analysis uses negative binomial models such as DESeq2 and edgeR that estimate a dispersion parameter per gene from the counts. These models answer slightly different questions under slightly different noise assumptions, so they do not rank genes identically even on identical truth.
This matters most for genes with moderate, consistent signals. An analysis method that requires a large fold change or a small p-value in one dataset will miss genes that are moderately but reproducibly changed. Integration methods designed for this problem combine the significance of differential expression with consistency across platforms, and a rank-based semi-parametric model evaluated on simulation data, the MAQC/SEQC benchmark datasets, and a synthetic microRNA dataset detected more biologically relevant differentially expressed genes with higher discriminative power than eBayes, DESeq2, and common meta-analysis approaches [2]. The mechanism is simple. A gene with a modest signal on each platform, pointing the same direction on both, carries more evidence than either platform alone, and only an integrative model can credit that evidence.
For your troubleshooting, the implication is that a gene significant on one platform and borderline on the other is not necessarily a conflict. It may be a consistent signal that one model had the power to resolve and the other did not. Look at its effect size and direction on both platforms before adding it to a conflict list.
Cause 5: Batch Effects and Processing Differences
Batch effects are systematic differences between groups of samples processed at different times, by different operators, in different libraries or lots. RNA-seq batches differ in library preparation kits, sequencing lanes, and depth. Microarray batches differ in lot numbers, scanner settings, and hybridization dates. When your RNA-seq and microarray datasets were generated in different labs, on different sample cohorts, or years apart, the platform effect and the batch effect are completely confounded, and no amount of normalization will separate them.
The diagnosis is a principal component analysis of each dataset colored by batch variables, plus RLE plots. If a principal component separates samples by processing date more strongly than by biological condition, you have a batch problem. The fix depends on the design. If batch is crossed with condition, meaning each batch contains both conditions, include batch in your design matrix and let the model absorb it. If batch is confounded with condition, meaning every sample in condition A was processed on one day and every sample in condition B on another, no computational method can rescue the comparison, and the honest solutions are a balanced subset or new data. ComBat and related empirical Bayes removal methods help with platform and batch shifts on balanced designs, but they can distort the very signal you are testing when the design is confounded, so they belong after careful design review, not before.
Cause 6: Cell Composition Inside Bulk Tissue
When both platforms profile bulk tissue, neither measures a pure cell population, and differences in tissue composition between your compared groups can create or destroy differential expression signals. This cause is easy to dismiss and expensive to ignore. In colorectal cancer, the majority of differentially expressed circular RNAs identified in bulk tumor versus adjacent normal comparisons were not differentially expressed when cancer cells were compared directly with normal epithelial cells. The discrepancy had a specific mechanism. Circular RNAs are highly stable and accumulate to high levels in quiescent muscle cells, while fast-proliferating cancer cells dilute them to low levels because of slow biogenesis. High circRNA content in muscle cells also confounded bulk analyses in bladder and prostate cancers [4].
Although that study focused on circular RNAs, the mechanism applies to any transcript whose abundance is strongly cell-type or proliferation-state dependent. A gene expressed almost exclusively in stromal or muscle cells will appear differentially expressed in a bulk comparison whenever the stromal fraction differs between tumor and normal samples, and it will do so identically on both platforms, which means both platforms can agree with each other and still be wrong about the cancer cells you actually care about. Confirm this cause with cell-type deconvolution on the bulk profiles, with spatial methods, or with single-cell data from the same tissue.
Cause 7: Biology That Genuinely Differs by Tissue or Context
The rarest cause, and the one to consider last, is that the two datasets are not actually asking the same biological question. Comparisons that hold in one tissue can reverse in another, and merging them produces a contradiction that looks like a platform artifact but is real biology. The export protein XPO5 illustrates the pattern. Across tumor types, XPO5 expression was higher in malignant than normal tissue in breast, bladder, lymph-node, lung, esophagus, and ovary tumors, but significantly lower in kidney and brain tumors, and functional work in breast and kidney cancer cell lines supported a dual role that depends on tissue type [5]. An analyst who pooled those tissues and saw direction inconsistency between two datasets might blame the platforms when the platforms were reporting accurately.
Diagnose this by stratifying your comparison by tissue, cell line, or condition and rerunning the differential expression analysis within each stratum. If the discrepancy disappears within strata and only appears when strata are pooled, the platforms agree and the biology is context dependent.
How to Fix RNA-seq and Microarray Differential Expression Discrepancies: A Worked Workflow
The fixes below assume R, Bioconductor, and the two most common analysis stacks, limma for arrays and DESeq2 or edgeR for RNA-seq. Adapt the package versions to your environment and record them in your session information for reproducibility.
Step 1: Harmonize Identifiers and Annotation
Convert both datasets to a shared, current identifier system. For microarray platforms, fetch the probe sequences and remap them to the current genome build rather than trusting the packaged annotation. A typical remapping pipeline uses Bioconductor:
library(GEOquery)
library(hgu133plus2.db)
eset <- exprs(getGEO("GSE12345")[[1]])
mapped <- AnnotationDbi::select(hgu133plus2.db,
    keys = rownames(eset),
    columns = c("ENSEMBL", "SYMBOL"),
    keytype = "PROBEID")
Collapse multiple probes per gene only after checking that they agree. If probes for the same gene differ in sign of change, keep them separate or drop the gene, because averaging contradictory probes manufactures a false neutral. Genes measured by multiple probes that disagree are a signature of isoform or annotation problems, which connects directly to Cause 2 [3].
Step 2: Normalize Each Platform on Its Own Terms
Normalize within each platform before attempting any comparison. For the array:
library(affy)
raw <- ReadAffy(filenames = celFiles)
eset.norm <- rma(raw)
For RNA-seq, start from the raw count matrix, filter genes with negligible counts, and normalize within the RNA-seq framework:
library(DESeq2)
keep <- rowSums(counts(dds) >= 10) >= 3
dds <- dds[keep, ]
dds <- DESeq(dds)
res <- results(dds, alpha = 0.05)
Do not convert counts to FPKM or TPM and then run a limma-style test as though the values were array intensities. TPM, transcripts per million, is useful for comparing expression levels across genes and samples at the descriptive level, but it removes the count-based mean-variance relationship that the differential expression model depends on, so differential testing should use raw counts with an appropriate model.
Step 3: Assess Direction Concordance Before Anything Else
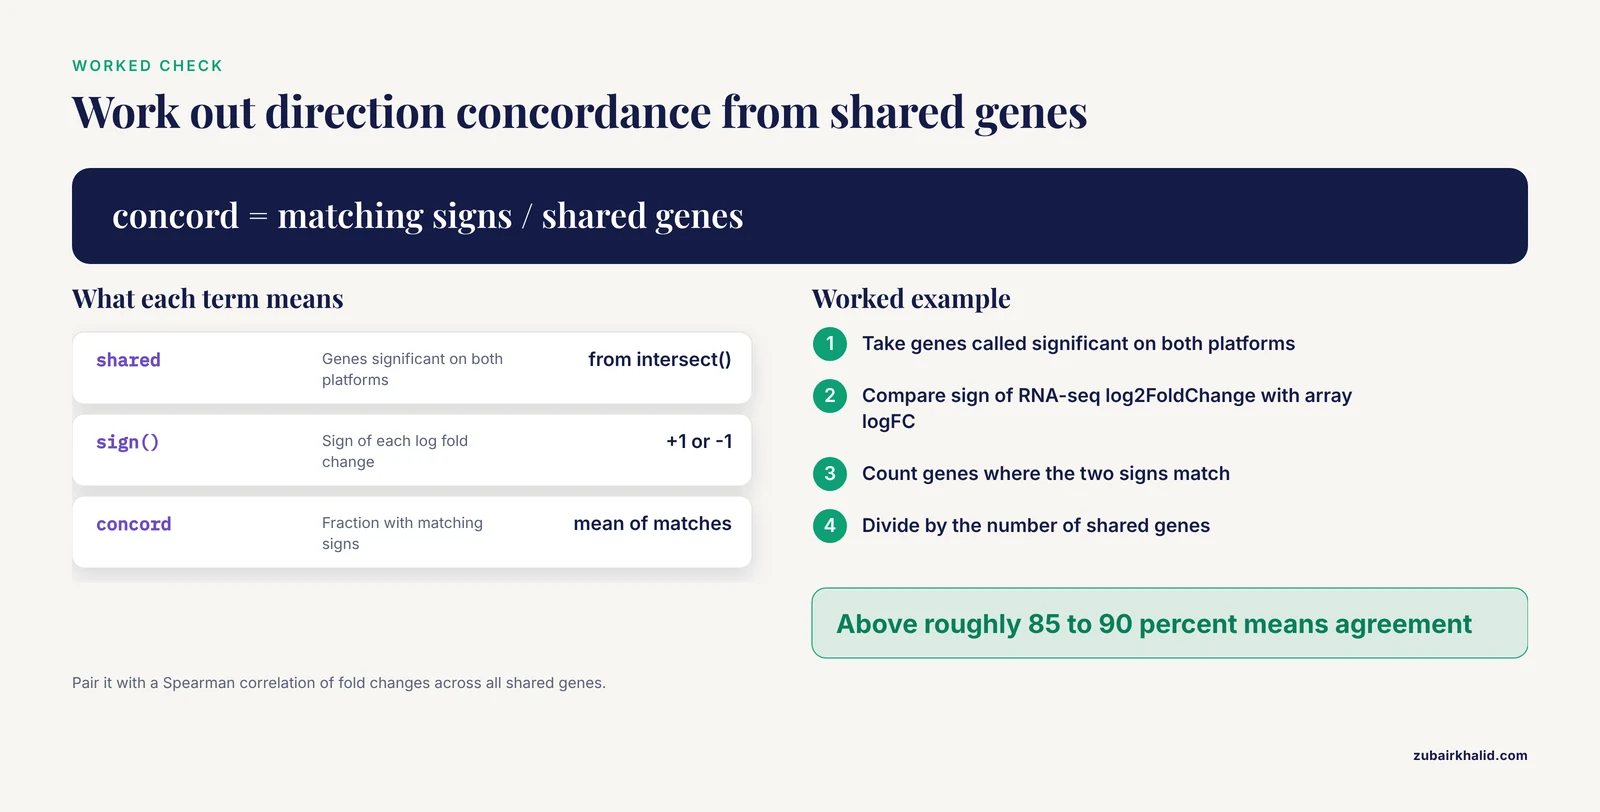
This is the single most informative check in cross-platform troubleshooting:
shared <- intersect(rownames(resSeq), rownames(resArray))
seq.fc <- resSeq$log2FoldChange[shared]
arr.fc <- resArray$logFC[shared]
concord <- mean(sign(seq.fc[!is.na(arr.fc)]) ==
                sign(arr.fc[!is.na(seq.fc)]))
spearman <- cor(seq.fc, arr.fc,
    method = "spearman", use = "complete.obs")
A concordance above roughly 85 to 90 percent among genes called significant on both platforms, together with a strong positive Spearman correlation of fold changes across all shared genes, indicates platform agreement. In that case, your discrepancy is threshold sensitivity, and the solutions are reporting strategies, such as ranking genes by the consistency and magnitude of their cross-platform effect, rather than data processing [2].
Step 4: Model Each Platform Correctly
Keep the noise model matched to the data type. Arrays get limma with empirical Bayes moderation on log2 intensities. Counts get DESeq2 or edgeR with per-gene dispersion. If you want a single statistical framework across both platforms, limma's voom transformation converts RNA-seq counts to precision-weighted log counts per million, which lets you run both datasets through linear models and compare them on the same scale. That is a legitimate solution for cross-platform work, provided each platform is still quality controlled on its own terms.
Step 5: Handle Batch and Unwanted Variation Explicitly
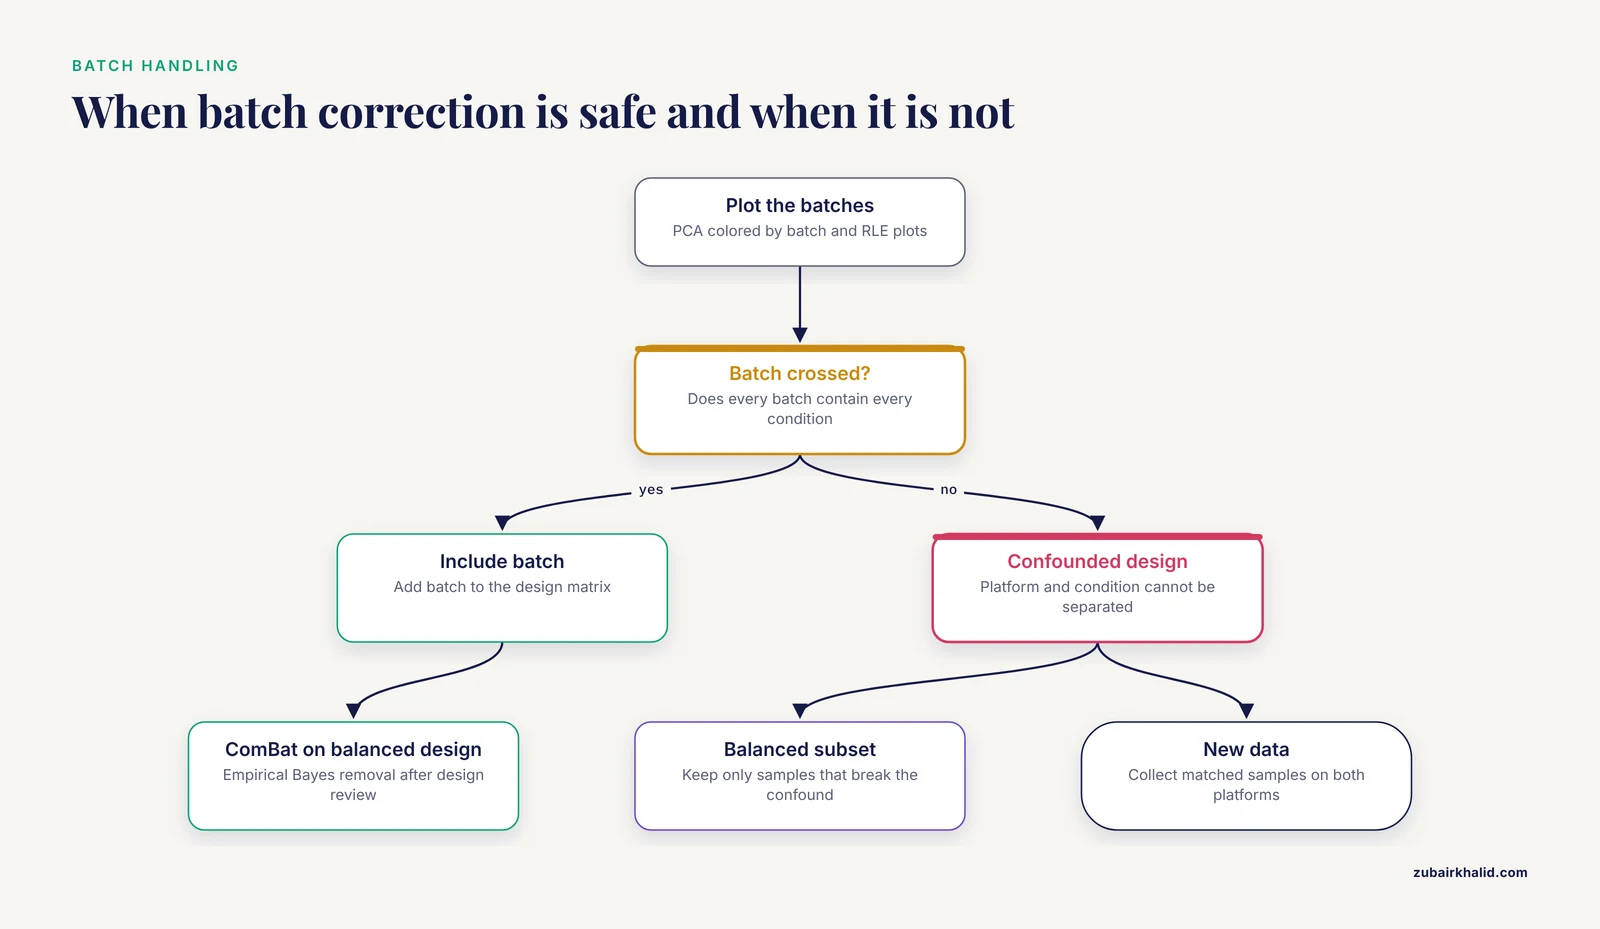
Plot first, remove second:
library(sva)
mod <- model.matrix(~condition, data = coldata)
adjusted <- ComBat(dat = combinedMatrix,
    batch = platformVector, mod = mod)
Only apply ComBat or similar methods when every batch contains every condition. Never apply batch removal to a matrix in which platform is the variable you want to test, because the method will remove the signal along with the noise. For RNA-seq with unknown unwanted variation, surrogate variable analysis in the same sva package can identify latent factors that you then include in the design matrix.
Step 6: Integrate the Platforms Deliberately
If the goal is a single trustworthy gene list rather than an explanation of disagreement, use a method built for integration. The rank-based semi-parametric approach combines per-platform significance with cross-platform consistency and was validated against the MAQC/SEQC benchmark datasets, outperforming single-platform eBayes, DESeq2, and standard meta-analysis in discriminative power [2]. For full translation between platforms, trained probabilistic models such as PXN map one platform's data into the other's representation, preserving biological variation while removing technology-specific bias, and were specifically benchmarked on the microarray to RNA-seq transition [1]. Both strategies share a principle worth adopting even without the software: genes whose signal is consistent across platforms deserve priority, and genes with strong single-platform signals that the other platform cannot confirm should be flagged, not discarded.
A Short Safety Note
If your workflow reaches back into the wet lab, for example to re-extract RNA or rerun a hybridization, handle the standard reagents with care. Phenol-chloroform extraction reagents such as TRIzol are corrosive and toxic and require a fume hood, nitrile gloves, and eye protection. Formamide, a common component of microarray hybridization buffers, is a reproductive hazard and should be handled under the same conditions with proper disposal. Beta-mercaptoethanol, used in some RNA extraction buffers, is volatile and toxic and must never be opened on the open bench. Follow your institution's chemical hygiene plan and the manufacturer safety data sheets for every reagent.
Common Mistakes and Limitations
- Comparing significance lists instead of effect directions. The overlap of genes passing p less than 0.05 on two platforms is a poor measure of agreement, because the p-value scales are not calibrated to each other. Direction concordance and rank correlation are better measures and are almost always higher than list overlap.
- Trusting packaged array annotations. Probe annotation files shipped with array packages can be more than a decade out of date. Reannotate from probe sequences, especially before declaring a conflict.
- Comparing datasets from different samples and calling it a platform comparison. If the RNA-seq cohort and the microarray cohort differ in tissue handling, disease stage, or composition, you are measuring cohort differences too. The circRNA colorectal cancer work shows how strongly cell composition can dominate bulk signals [4], and the XPO5 work shows how strongly tissue choice can dominate direction [5]. Matched samples on both platforms remain the gold standard for troubleshooting.
- Fixing batch effects on a confounded design. No computational correction can separate condition from processing date when they are perfectly aligned. Redesign or subset before reaching for ComBat.
- Averaging contradictory probes. Probes within a probe set that disagree often reflect isoform biology. Averaging hides real signal and produces false negatives.
- Ignoring reference completeness in RNA-seq. Tag-based and end-biased protocols silently drop genes whose measured regions are absent from the reference, an effect demonstrated to halve the detected differential gene count in a controlled multi-workflow comparison [6]. Restrict cross-platform comparisons to genes unambiguously measurable on both platforms.
- Assuming one platform is always right. Each platform fails in its own way. Arrays fail at the dynamic range extremes and with stale probes. RNA-seq fails with incomplete references, low-count noise, and alignment artifacts. The correct response is to identify which failure mode explains each specific discrepancy, not to declare a winner.
- Over-reading magnitude agreement. Even when directions agree, fold-change magnitudes are not interchangeable between platforms because of differences in scale and compression [1]. Report platform-specific effect sizes and a shared rank or direction statistic.
Prevention Practices for Future Studies
Design the comparison so the discrepancies you would have to troubleshoot never arise. These practices cost little at the planning stage and save weeks later.
- Use matched samples on both platforms whenever possible. Splitting the same RNA aliquots between an array and an RNA-seq library prep turns a cross-cohort comparison into a true platform comparison and removes composition, batch, and cohort confounding in one move.
- Balance your batches. Process samples so that every preparation day, lane, and lot contains samples from every condition. Balanced batch effects are modeled away. Confounded batch effects are permanent.
- Validate probe mappings at purchase time. If you are reusing a legacy array platform, remap its probes to the current annotation once, document the mapping, and reuse the mapping file for every downstream analysis.
- Predefine the concordance analysis. Decide before looking at the data that agreement will be assessed by direction concordance and rank correlation among shared genes, and record the thresholds. This prevents the retrospective search for a threshold that makes the platforms look good.
- Keep raw data. Archive raw counts and CEL files with full metadata, including library prep kit, sequencer, flow cell, scanner, and dates. Most bioinformatics troubleshooting is impossible without them, and public repositories such as those maintained by NCBI exist precisely so that raw data can be reanalyzed under a common framework [1].
- Report which genes each platform can measure. A short table listing the number of genes with reliable measurements on each platform, and the size of their intersection, tells reviewers and colleagues immediately whether an apparent discrepancy is a sensitivity difference or a conflict.
- Stratify by context before pooling. Analyze each tissue, stage, or cell type separately, then integrate. Context-dependent biology is the most common reason pooled analyses contradict single-platform expectations.
Frequently Asked Questions
Is low overlap between my two differential gene lists a sign that one platform failed?
Usually not. Significance thresholds applied to two incomparable measurement scales will naturally produce different gene lists, even when the platforms agree closely. Check direction concordance and rank correlation among shared genes before judging either platform.
Can I directly compare TPM values with microarray intensity values?
No. The two quantities live on different scales with different noise properties and different dynamic ranges. Compare ranks, directions, or outputs from a purpose-built cross-platform method instead [1].
Which platform is more accurate for differential expression?
Neither is universally more accurate. RNA-seq offers a wider dynamic range and isoform resolution, while microarrays are mature, inexpensive, and highly standardized. Each fails in different ways, so accuracy depends on which failure modes matter for your genes of interest.
How do I test whether my two platforms agree on the direction of change?
Take the genes called significant on both platforms, compute the log fold change from each, and calculate the fraction of genes where the signs match. Then compute the Spearman correlation of fold changes across all genes measurable on both platforms. High values on both indicate agreement.
Should I reannotate microarray probes before comparing with RNA-seq?
Yes. Array annotations age badly, and remapping probe sequences to the current transcriptome routinely resolves apparent conflicts and exposes probes that cross-hybridize or target outdated models of genes [3].
Why do the same genes show opposite fold-change signs on the two platforms?
The most common reasons are probes that measure a different transcript or isoform than the RNA-seq reads, contradictory probes averaged into a single gene value, and context-dependent biology when datasets come from different tissues [3][5].
What is the quickest way to fix batch effects between two platforms?
If every batch contains every condition, include batch in your design matrix or apply an empirical Bayes correction such as ComBat. If batch is confounded with condition, no computational fix works, and you need a balanced subset or new samples.
When should I integrate both platforms instead of choosing one?
When you need maximum confidence in a gene list rather than platform purity. Integration methods that reward cross-platform consistency detect moderately and reproducibly changed genes that single-platform analyses miss [2], and modern translation models can even bridge the microarray to RNA-seq divide directly [1].
Sources
- PXN Unlocks the Power of Public Gene Expression Data Through Cross-Technology Integration.
- A semi-parametric statistical model for integrating gene expression profiles across different platforms.
- Differential Effects of Hepatocyte Nuclear Factor 4α Isoforms on Tumor Growth and T-Cell Factor 4/AP-1 Interactions in Human Colorectal Cancer Cells.
- Spatial Profiling of Circular RNAs in Cancer Reveals High Expression in Muscle and Stromal Cells.
- Evaluating the Oncogenic and Tumor Suppressor Role of XPO5 in Different Tissue Tumor Types.
- Differential gene expression in the siphonophore Nanomia bijuga (Cnidaria) assessed with multiple next-generation sequencing workflows.