Why Are My Samples Clustering by Library Preparation Date?
By Dr. Zubair Khalid, DVM, MS, PhD ·

You opened your PCA plot, colored the points by treatment, and the treatment groups ignored you. The samples split cleanly into two lobes, and the only variable that explains the split is the day the libraries were prepared. This is one of the most common RNA-seq errors a lab encounters, and in most cases the cause is a batch effect, which is any technical variable that systematically shifts expression measurements for a subset of samples. The single most common specific cause is that everything processed on the same day shared reagent lots, an operator, incubation timing, and a sequencing run, so the prep date acts as a label for every one of those unrecorded differences at once.
The first thing to check is whether prep date is confounded with your biological condition. Look at your sample sheet and ask one question: do all replicates of any treatment sit in the same prep batch? If yes, no amount of downstream computation can separate the batch effect from the biology, and the fix is a design conversation, not a script. If the batches are balanced across conditions, the effect is usually removable, and this article walks through how to confirm it, which methods to use, and how to prevent it next time.
What Clustering by Prep Date Actually Looks Like
A batch effect from library preparation date shows up in specific, recognizable ways. Knowing the pattern helps you distinguish it from biology before you spend a day chasing the wrong variable.
On a principal component analysis (PCA) plot, which projects your samples onto the axes of greatest variance, the samples form clusters that align with prep date rather than with treatment. Often the first principal component (PC1) captures the date, and PC1 typically explains far more variance than a clean experiment would show. A well-behaved experiment usually has biological condition driving the top components. When a technical label dominates PC1 and accounts for a large share of total variance, treat that as a red flag.
On a sample-to-sample correlation heatmap, samples from the same prep date group together even when they come from different treatments. Within-batch correlations sit noticeably higher than between-batch correlations, regardless of the biology.
In a multidimensional scaling (MDS) plot or a dendrogram from hierarchical clustering, the same pattern appears. The tree splits first by date, then by condition inside each date.
A related and often louder signature appears in read-level metrics. If the prep date also tracks with a sequencing run or a flowcell lane, you may see differences in per-base sequence content, adapter contamination, duplication rates, or insert size distributions when you compare MultiQC reports across dates. Those read-level shifts point at library construction or sequencing rather than at the RNA itself.
None of these patterns alone proves a batch effect. A genuine biological variable that happens to correlate with prep date (for example, samples collected on different days from different animal groups) produces the identical picture. That is why the confounding check comes first.
Why Library Prep Date Absorbs So Many Variables
Prep date is rarely a cause in itself. It is a container. Everything that varied between your processing days hides inside it, and the usual suspects are:
- Reagent lots. A new lot of library prep kit, reverse transcriptase, ligase, or beads can change efficiency of specific steps. Lot-to-lot variation in enzymatic kits is a recognized issue in manufacturer technical documentation, which is why most kit vendors recommend validating a new lot against the old one before switching mid-project.
- Operator. If two people prepped libraries on different days, differences in pipetting, timing of incubations, and handling of beads contribute variation that the date perfectly tracks.
- Sequencing run and lane. Libraries made on the same day are often pooled and sequenced together. Flowcell, lane, and run-date effects are well documented in sequencing facility practice, and the ENCODE project explicitly requires that biological replicates from a tissue culture batch not be barcoded and sequenced in the same lane, precisely to avoid confounding biology with these technical layers.
- Input RNA quality. Samples extracted earlier and stored longer may have degraded slightly before prep, so prep date correlates with RNA integrity number (RIN), a standard 1-to-10 measure of RNA integrity where higher values indicate more intact RNA.
- Protocol drift. Thaw-refreeze cycles of reagents, a warmed thermocycler block, a different magnetic rack, or an extended incubation because someone stepped away all land on one date and not another.
The practical consequence is that "cluster by library prep date" is almost always "cluster by an unnamed technical variable that happened to change between prep days." Your job is to name that variable, because the fix depends on what it is.
Troubleshooting Table: Symptoms, Causes, Confirmation, Fixes
This table is the core diagnostic for an RNA-seq cluster-by-library-prep-date problem. Work top to bottom. The most common causes sit at the top.
| Symptom | Likely cause | How to confirm | Fix |
|---|---|---|---|
| Samples cluster by date AND every replicate of a treatment is in one date | Design confounding: batch and condition cannot be separated | Cross-tabulate condition vs prep date in your sample sheet. If any cell contains only one condition, you are confounded | Rebalance and re-prep samples across dates if the question matters, or reframe the analysis with the explicit caveat that treatment and batch are inseparable. No computational method can fix this |
| Balanced design, but PCA still splits by date, and PC1 dominates | Reagent lot switch between prep days | Check kit lot numbers recorded in your lab notebook or LIMS against prep dates | Include batch in the statistical model. For future preps, mix lots within conditions or validate new lots before switching |
| Cluster by date matches cluster by sequencing run or lane | Run or lane effect | Compare per-sample alignment, duplication, and base-composition metrics from FastQC and MultiQC across dates | Add run or lane as a batch term. Check index hopping by comparing reads assigned to unused index combinations |
| Two operators split cleanly by date | Operator effect | Check bench records for who ran each date | Include batch in the model. Standardize incubation times and pipetting, and interleave operators in future runs |
| Earlier prep dates have lower RIN, more degradation, or lower mapping rates | RNA quality drift with storage time | Plot RIN (from Bioanalyzer or TapeStation) against prep date. Look at percent of intronic and endogenous collapsed reads with Picard CollectRnaSeqMetrics or RSeQC | Include RIN as a covariate. For low-RIN samples, consider methods designed for degraded RNA in interpretation |
| Split by date is driven by a handful of genes with extreme counts | Library method bias, often in 3' tag or QuantSeq-style preps | Examine the genes driving PC1. Check whether they sit at transcript 3' ends or share GC content | Use methods that model gene-level bias, and treat the split as a known property of the library chemistry rather than a correctable batch term alone |
| Cluster by date appears only after normalization, not before | Normalization artifact | Compare PCA on raw counts, variance-stabilized counts, and alternative normalization schemes | Re-examine your normalization choice and whether zero-count or low-count genes were filtered before clustering |
| Split by date only at the very top or bottom of the count distribution | Contamination or barcode cross-talk | Run FastQC overrepresentation analysis and BLAST top overrepresented sequences. Check for reads with unexpected index combinations | Identify the contaminant. Exclude affected libraries or lanes, or demultiplex more stringently |
Causes From Most Common to Rarest
1. Batch Is Confounded With Your Biological Condition
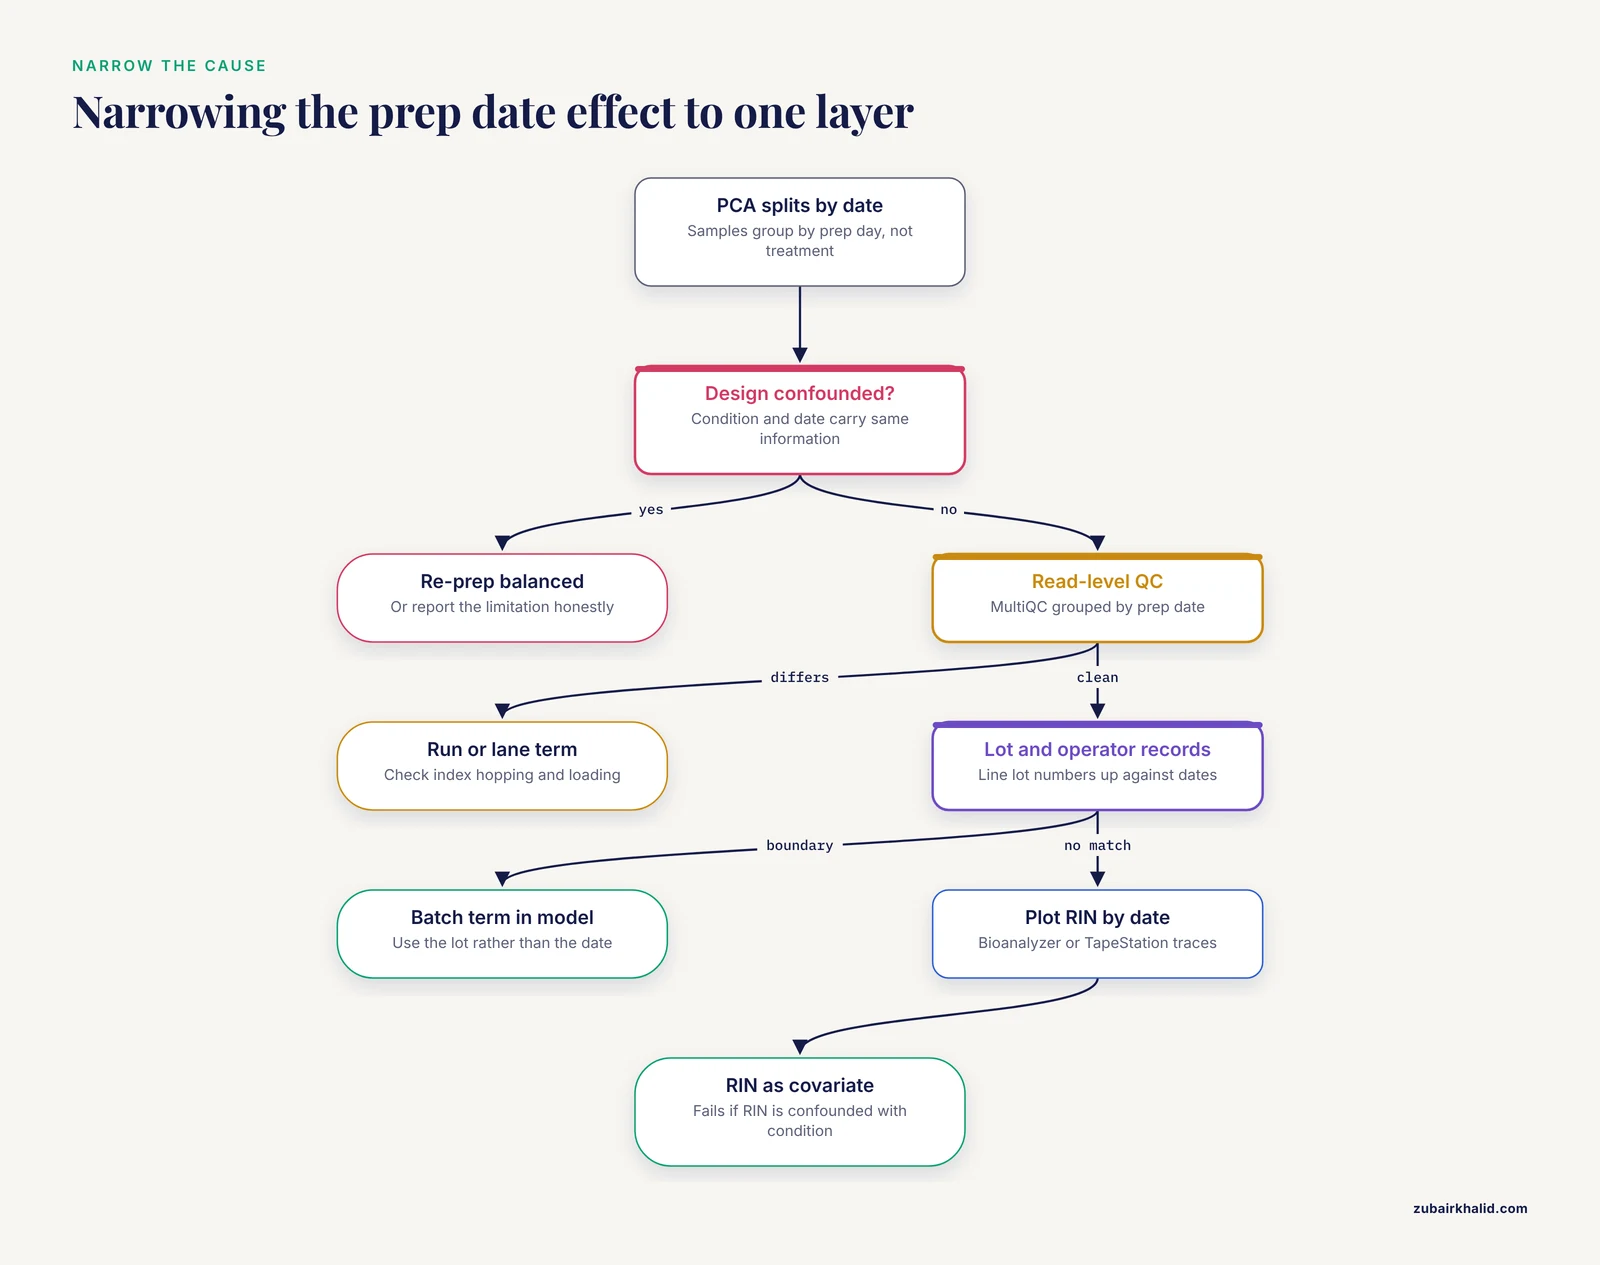
This is the most common cause and the only one with no computational fix. Confounding means batch and condition carry the same information: knowing the prep date tells you the treatment, and knowing the treatment tells you the prep date. In a linear model, the two effects cannot be estimated separately because there is nothing to compare them against. Every differential expression tool, whether DESeq2, edgeR, or limma-voom, will warn you when the design matrix is not full rank, which is the mathematical statement of this problem. NCBI's Gene Expression Omnibus documentation and standard texts such as Bioconductor's RNA-seq workflow (Love, Anders, Huber) both treat batch structure in the design formula as a first-order design question that precedes any analysis.
The check takes two minutes. Build a two-way table of condition against prep date. If any prep date contains only one condition, or any condition exists in only one prep date, you are confounded. Mixed designs, where each date contains samples from every condition, allow the model to average away the batch. Confounded designs do not.
The honest fixes, in order of preference, are:
- Re-prep a subset of samples from each condition on a new date so that the design becomes balanced, then include batch in the model.
- Re-extract and re-prep everything in a randomized, balanced layout if the finding is central to the project.
- Reframe the result honestly: report that treatment and prep date are inseparable in this dataset, present the observed differences as candidates, and label them unconfirmed.
What you should never do is report the confounded differential expression as if the batch term had been handled. Reviewers and collaborators can rebuild your design matrix, and the failure is visible in it.
2. Reagent Lot Changes Across Prep Days
When the design is balanced but samples still cluster by date, reagent lot changes are the next most common cause. Enzymatic library prep kits, reverse transcription reagents, fragmentation reagents, and purification beads all show lot-to-lot variation. Manufacturer technical documentation for common library prep kits routinely advises lot validation and warns against switching lots partway through a comparative study for exactly this reason.
The mechanism is usually a shift in efficiency of a specific step. A ligase lot with slightly different activity changes adapter ligation rates, which changes the observed abundance of certain transcript regions. Beads with different binding capacity change cleanup yields, which can shift overall library complexity. Fragmentation reagents with different buffer composition shift insert size distributions, which changes mapping behavior.
Confirmation is bookkeeping, not statistics. Pull the lot numbers from your records and line them up against prep dates. If a lot boundary falls on your batch boundary, you have your answer, especially if the split by date is broad (many genes move modestly) rather than sharp (a few genes move dramatically).
The fix in analysis is to include a batch term in the model, using either the prep date or the reagent lot itself as the batch variable. Using the lot rather than the date is often more precise because it names the actual difference. The fix in practice for future work is to order enough of a single lot for the whole study, or to validate a new lot by prepping a common reference sample with both lots and comparing profiles before the switch.
3. Sequencing Run, Lane, and Flowcell Effects
Libraries prepared on the same day are frequently pooled and sequenced on the same run, which means the date effect and the run effect are perfectly aligned. Sequencing runs differ in cluster density, phasing behavior, and per-cycle quality profiles. Lanes within a run can differ through loading variation and, on patterned flowcell instruments, through index hopping, which is the misassignment of reads to the wrong sample index. Illumina's own technical notes describe index hopping on patterned flowcells and recommend balanced index combinations to mitigate it.
Confirm the layer the effect lives at by comparing read-level QC across dates. If per-tile quality, per-base content, or duplication differs by date, look at sequencing. If read-level metrics are clean but expression profiles still split, look upstream at library construction or RNA.
Fixes in analysis include adding a run or lane term to the design. Fixes in practice include balancing index combinations across lanes, randomizing sample-to-lane assignments, and asking the facility to spread a study across lanes rather than concentrating each prep day in one lane. The ENCODE project's batch guidelines, which explicitly require biological replicates from the same tissue culture batch to be distributed across lanes, exist because this failure mode is common enough to write a rule about.
4. Operator and Protocol Drift
When the same protocol is run by two people on two days, small differences accumulate. Incubation that runs nine minutes one day and seven the next, bead cleanup resuspended thoroughly one day and briefly the next, and pipetting differences at low volumes all shift library composition. This is standard knowledge in molecular bench practice, and it is why good lab records capture the operator alongside the date.
Confirmation is straightforward: compare the operator column of your metadata with the clustering pattern. If a single person's samples form a cluster, you have found the variable.
The fix in analysis is the batch term, as before. The fix in practice is interleaving operators within conditions, standardizing incubation timing with timers, and using a written checklist so that every step runs to the same specification regardless of who holds the pipette.
5. Input RNA Quality That Declines With Storage Time
If samples extracted for an early prep date sat in a freezer longer than samples prepped later, RNA integrity can differ systematically. Lower RIN values shift measured expression toward shorter transcripts and increase apparent intronic signal, because partially degraded RNA reads map in patterns that reflect fragmentation of the transcript before library prep. RIN, measured on an Agilent Bioanalyzer or TapeStation, ranges from 1 to 10 with 10 indicating highly intact RNA.
Confirm by plotting RIN against prep date. If RIN declines across dates, or if a date boundary aligns with a RIN boundary, RNA quality is contributing to the split. Picard's CollectRnaSeqMetrics and RSeQC can quantify degradation signatures from the aligned reads themselves, which is useful when no Bioanalyzer trace exists.
The fix in analysis is to include RIN as a continuous covariate in the design formula. This works when RIN varies within the batch structure. It fails when RIN is confounded with condition, the same trap as cause one.
Safety note. If you are re-extracting RNA to fix this problem, remember that TRIzol and similar reagents contain phenol and guanidinium thiocyanate, which are corrosive and toxic. Handle them in a chemical hood with appropriate gloves and eye protection, and follow your institution's chemical hygiene plan for disposal. Formamide, present in many loading buffers and some library prep reagents, is a reproductive hazard and requires glove changes after contact.
6. Library Type and Sequence Bias
Certain library methods carry a strong, reproducible sequence bias that can masquerade as or amplify a batch effect. QuantSeq-style and other 3' tag methods measure signal near transcript ends, so their profiles depend heavily on the exact position of the fragment and on poly(A) site usage. Degradation timing during prep changes which 3' fragments are recovered. These biases are properties of the chemistry, documented in the methods literature on 3' RNA-seq and in the protocol notes of the kit vendors.
The signature is distinctive: the genes driving the split sit at transcript ends or share GC content patterns, and the split direction can differ between library methods applied to the same RNA. If your project switched library protocols partway through, the protocol itself is likely the dominant variable, and prep date is only its label.
The fix in analysis is partial. Some gene-level biases can be modeled, and tools in the limma and RUVSeq families can help, but a mid-study protocol switch that aligns with condition is another confounding case. The fix in practice is to never switch library protocol, kit version, or read length mid-study without re-prepping a bridging set of samples across both protocols.
7. Rarest: Instrument Maintenance, Chemistry Version Changes, and Barcode Cross-Talk
The rare end of the distribution includes a sequencer that received maintenance or a new chemistry version between your prep dates, a carrier or storage event that exposed one batch to warmer temperatures, and barcode cross-talk that systematically shifted a subset of libraries. Genuine contamination shows up in FastQC overrepresentation analysis, and the overrepresented sequence can often be identified by a BLAST search against common contaminants such as rRNA, adapter dimers, or bacterial genomes.
These causes are rare, but they are the ones to consider when everything above checks out and the split persists. Confirmation usually requires the facility's run logs and a direct look at the raw reads of the outliers.
A Diagnostic Sequence You Can Follow in One Afternoon
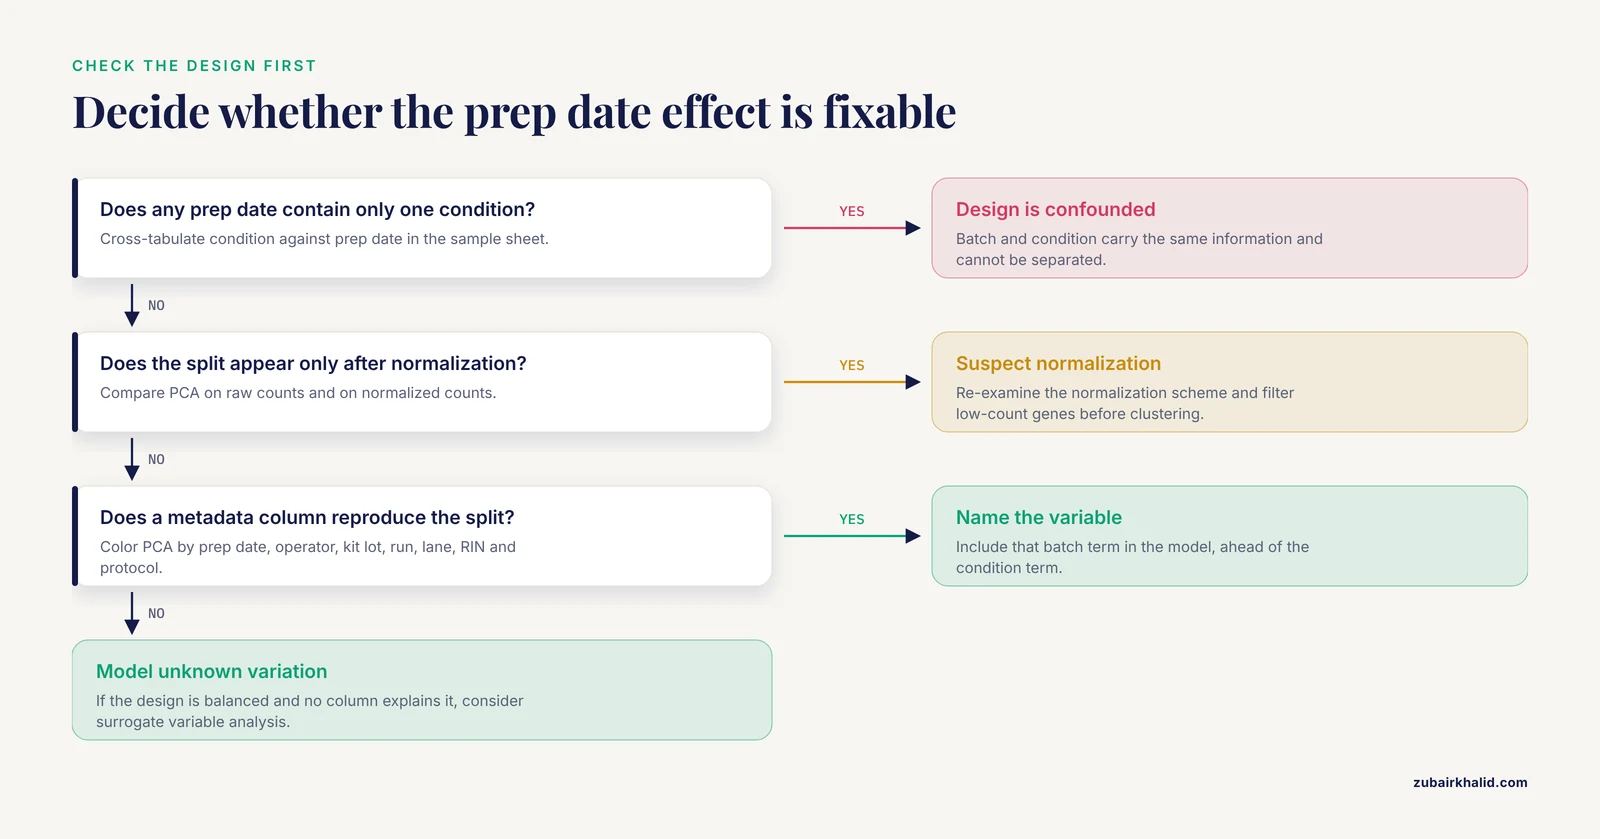
Work through this sequence in order. Each step either names the cause or eliminates one.
- Cross-tabulate condition against prep date. In R,
table(sampleSheet$condition, sampleSheet$prep_date). If any cell is zero or the table is nearly diagonal, you are confounded, and the afternoon ends with a design conversation rather than an analysis. - Recompute PCA on unnormalized and normalized counts separately. If the split exists before normalization and after, the cause is upstream of normalization. If it appears only after, suspect the normalization scheme.
- Color the PCA by every metadata column you have: prep date, operator, kit lot, sequencing run, lane, RIN, extraction date, and library protocol. The column whose colors reproduce the clustering pattern is your leading suspect.
- Build a sample-to-sample correlation heatmap using variance-stabilized counts. Note whether within-date correlations exceed between-date correlations uniformly across conditions.
- Inspect read-level QC with MultiQC across all samples, grouped by prep date. Differences in adapter content, duplication, insert size, or per-base content localize the effect to sequencing or library construction rather than the RNA.
- List the genes driving PC1. Look up where they sit in their transcripts and check their GC content. Terminal clustering suggests 3' tag bias or degradation. GC-driven clustering suggests library or PCR bias.
- Compare RIN against prep date if traces exist. Confirm or exclude RNA quality drift.
- Check your demultiplexing report for reads assigned to unexpected index combinations, which indicates index hopping or barcode bleed-through.
- If a candidate batch variable is found and balanced across conditions, proceed to the modeling fixes below. If no variable explains the split and the design is balanced, consider surrogate variable analysis, which can detect and remove unwanted variation even when you cannot name its source.
How to Fix RNA-Seq Clustering by Library Prep Date
When You Can Fix It in Analysis
If the design is balanced, meaning each prep date contains samples from every condition, batch effects are removable with standard methods. The approaches below are documented in the Bioconductor documentation for each package and are the consensus tools for this problem.
Include batch in the design formula. In DESeq2, a design such as design(dds) <- ~ prep_date + condition models the prep-date effect and tests condition effects after accounting for it. The batch term must precede the condition term in the formula, because DESeq2 estimates effects in the order written. The same principle applies in edgeR and limma-voom, where the batch factor enters the linear model directly.
Remove batch for visualization. A model with a batch term handles the statistics, but your PCA will still show the split, because the raw dispersion of the data has not changed. Use limma's removeBatchEffect() on variance-stabilized or log-count-per-million values before plotting. This function adjusts the expression matrix for plotting and clustering only. Differential expression must still be run on the original counts with batch in the model, never on the adjusted values.
Model unknown unwanted variation. When no metadata column explains the split, sva's surrogate variable analysis (svaseq for RNA-seq counts) estimates unwanted variation directly from the data, and RUVSeq (Remove Unwanted Variation for RNA-Seq) offers related approaches, including RUVg, which uses spike-ins or control genes, and RUVs, which uses replicate structure. These methods carry a real risk when the unwanted variation correlates with biology, so treat their output as supportive and check that known positive and negative control genes behave sensibly afterward.
ComBat. The sva package's ComBat function applies an empirical Bayes adjustment to expression values. Like removeBatchEffect, it is appropriate for visualization and for some downstream analyses, and it should not feed adjusted values into a differential expression model that assumes raw counts.
A practical warning applies to all of these. Batch correction works by removing the variation aligned with the batch label. If any real biology also aligns with that label, the correction removes the biology too. This is why balanced design is the only genuinely safe fix, and why the computational methods are described in their documentation as complements to good design rather than substitutes for it.
When You Cannot Fix It in Analysis
When batch and condition are confounded, no method can separate them, and any tool that appears to do so is making an untestable assumption. The options are the design fixes from cause one: add samples to break the confounding, re-prep in a balanced layout, or report the limitation honestly. A partial fix is sometimes possible if you can add even a few samples per condition in a new batch, which converts the design from fully confounded to partially confounded and gives the model some information to work with. Statistical colleagues can advise on how much new data the specific design needs.
Normalization Problems That Mimic Prep Date Effects
Some of what looks like a batch effect is actually a normalization artifact, which matters because the fix is entirely different. If one prep date produced libraries with very different depth or composition, certain normalization schemes will scale them in ways that create or exaggerate a split. Conversely, failing to filter low-count genes before PCA lets noise dominate the top components.
The diagnostic is to repeat the PCA on raw counts, on counts normalized with a robust method such as DESeq2's median-of-ratios or edgeR's trimmed mean of M-values (TMM), and on variance-stabilized counts. If the pattern changes materially between these views, normalization is part of the story. Established practice, described in the Bioconductor RNA-seq workflow, is to filter genes with very low counts before analysis, use a robust normalization for between-sample scaling, and apply variance stabilization before PCA and clustering, because those methods assume roughly constant variance across the expression range.
Prevention Practices for Future Runs
Prevention costs far less than a re-prep, and every practice below exists because a batch effect like this one caused it to be written down.
- Randomize the physical layout. Assign samples from every condition to every prep day, every operator, and every lane before anything is pipetted. A randomized sample sheet made in advance is the single highest-value document in the project.
- Buy one lot of every reagent for the whole study, and order enough plus 10 to 20 percent overage to absorb failures. If a lot change is unavoidable, validate it against a common reference sample before switching.
- Record everything in the sample sheet: prep date, operator, kit lot for each reagent, extraction date, RIN, sequencing run, and lane. Unrecorded variables cannot be modeled later.
- Follow the ENCODE batch guidance for replicate placement, which requires spreading biological replicates across lanes rather than concentrating them together.
- Use balanced index combinations so that index hopping, when it occurs, distributes evenly rather than concentrating between specific sample pairs.
- Run a bridging sample. Include the same reference RNA sample in every prep batch. If the bridge samples agree across dates, the prep is reproducible. If they do not, you have caught the batch effect with a control rather than with your experiment.
- Check QC at every handoff. Review Bioanalyzer traces before prep and MultiQC reports after sequencing, grouped by the variables in your metadata, so a split surfaces in hours rather than after analysis.
- Freeze analysis inputs. Save the count matrix, the sample sheet, and the session information for every analysis. When a reviewer asks how batch was handled, you answer from records rather than memory.
Common Mistakes and Limitations
- Treating the batch term as optional. If the metadata shows a balanced batch structure, that structure belongs in the model whether or not the PCA shows a split. Silent batch variation is common and does not always reach the top principal component.
- Running differential expression on batch-corrected values.
removeBatchEffectand ComBat output is for visualization and selected downstream uses. Differential expression runs on raw counts with batch in the design formula. Mixing these up produces statistics that look plausible and are not. - Blind trust in a single batch-correction method. Different methods make different assumptions. Running two approaches and confirming that the biological signal survives both is a reasonable robustness check, per the guidance in the RUVSeq and sva documentation.
- Conflating "batch" with "prep date." The date is a label. Confirm which underlying variable actually changed. Adding prep date to the model when the real driver is reagent lot leaves part of the effect in place.
- Skipping read-level QC. An expression-level batch effect and a sequencing artifact can produce similar plots. MultiQC reports by prep date distinguish them in minutes.
- Forgetting that a real biological variable can correlate with date. If sample collection itself differed by day, the "batch effect" may be partly real. Context matters, and the design table is only the first question, not the last.
- Assuming a balanced design guarantees a clean result. Balance makes the effect estimable and removable, but severe lot or quality differences can still leave residual structure. Check the corrected PCA and the residual correlations.
- A note on scope. This article covers the general diagnostic and computational practice for batch effects in bulk RNA-seq. Individual projects, particularly those with unusual designs, small sample counts, or mixed protocols, need case-specific statistical advice from a bioinformatician or biostatistician before decisions are finalized.
Frequently Asked Questions
Why are my samples clustering by library preparation date if I used the same kit?
Using the same kit does not mean using the same conditions. Lot numbers, operator, incubation timing, and the sequencing run can all differ between dates, and the prep date labels all of them at once. Check lot numbers and metadata first, because a lot switch between dates is the most frequent culprit after confounding.
How do I tell a batch effect from real biology?
Build a table of condition against prep date. If the batches are balanced across conditions and the biological groups still separate in the way your prior knowledge predicts, biology and batch can both be estimated. If batch and condition carry the same information, they cannot be distinguished, and the clustering pattern is uninterpretable.
Can I remove batch effects after sequencing?
Yes, when the batch structure is balanced across conditions. Methods including a batch term in DESeq2 or edgeR, limma's removeBatchEffect for visualization, ComBat, and RUVSeq can remove or model the variation. When batch is confounded with condition, no post-sequencing method can fix it.
Is it bad to include batch in the DESeq2 design formula?
No, it is the correct approach. Including a balanced batch term absorbs technical variation and improves the power of the condition test. The batch term goes before the condition term in the formula. Omitting it when batch structure exists is the mistake, not including it.
What is the difference between a batch effect and confounding?
A batch effect is technical variation aligned with a batch label that is spread across all conditions. Confounding is when the batch label and the condition carry identical information, so their effects cannot be separated. Batch effects are correctable. Confounding is not, and it invalidates the comparison.
Should I re-sequence or re-extract?
Neither, if the design is balanced and the effect is removable computationally. Re-extract and re-prep when the design is confounded and the result is central to the project, because new sequencing of confounded libraries reproduces the same problem. Re-sequencing alone helps only when the effect originates at the sequencing layer, such as a bad lane or run.
Does normalization remove batch effects?
Not by itself. Standard between-sample normalization methods such as DESeq2's median-of-ratios or edgeR's TMM correct for library size and composition differences, not for systematic library-prep differences. Batch removal requires the batch structure to be modeled explicitly, and some apparent batch effects are actually normalization artifacts that appear only after a particular scheme is applied.
How many samples per batch do I need to detect a batch effect?
You need at least some samples from every condition in every batch, so the design is estimable. Practical RNA-seq designs commonly run three or more biological replicates per condition, and that structure repeated in each batch lets both effects be modeled. With fewer than two samples in any condition-by-batch cell, the design matrix loses rank and the model cannot estimate the terms.