How to Remove Doublets from Single-Cell RNA-seq Data
By Dr. Zubair Khalid, DVM, MS, PhD ·

By the end of this guide you will be able to detect and remove doublets from a 10x Genomics single-cell RNA-seq dataset inside a Seurat workflow, choose sensible detection parameters for your own sample, verify that the removal worked, and troubleshoot the errors that most often stop this step cold. The workflow centers on Seurat and DoubletFinder in R, with notes on Scrublet and newer marker-based alternatives so you can pick the right tool for your project.
Before you start, have the following ready:
- R 4.2 or newer with Seurat 5.x installed
- DoubletFinder, installed from GitHub with
remotes::install_github("chris-mcginnis-ucsf/DoubletFinder") - A raw or filtered count matrix from one 10x run (the
.h5file or thefiltered_feature_bc_matrix/folder), ideally one sample per analysis - Roughly 8 to 16 GB of free RAM for a typical sample of 5,000 to 10,000 cells
What a doublet is and why it corrupts downstream results
A doublet is a single droplet or well that captured two cells instead of one. The sequenced barcode therefore reports a synthetic cell whose expression profile is the sum of two real cells. When the two captured cells come from the same cell type, the doublet is homotypic and usually harmless, because its profile still resembles that cell type. When the two cells come from different cell types, the doublet is heterotypic and appears in your data as an impossible intermediate cell, for example a cell co-expressing T cell markers and monocyte markers at high levels.
Doublets form at a predictable rate tied to how many cells you load into a 10x channel. As a practical rule used across the field, roughly 0.8 percent of recovered cells become multiplets for every 1,000 cells loaded, so a channel loaded to recover 8,000 cells carries an expected doublet burden near 6 percent. DoubletFinder formalizes this relationship in its expected-doublet tables, and the same logic drives Scrublet's expected_doublet_rate argument.
Unremoved heterotypic doublets cause several familiar problems in downstream analysis:
- Phantom intermediate clusters that look like continuous differentiation trajectories between unrelated cell types
- Spurious "co-expression" of lineage markers, which misleads marker gene scoring and cell-type annotation
- Inflated apparent diversity in low-cell populations, because a handful of doublets can form their own cluster
- Deformed trajectory inference, since a doublet sitting between two lineages pulls pseudotime through a path no real cell follows
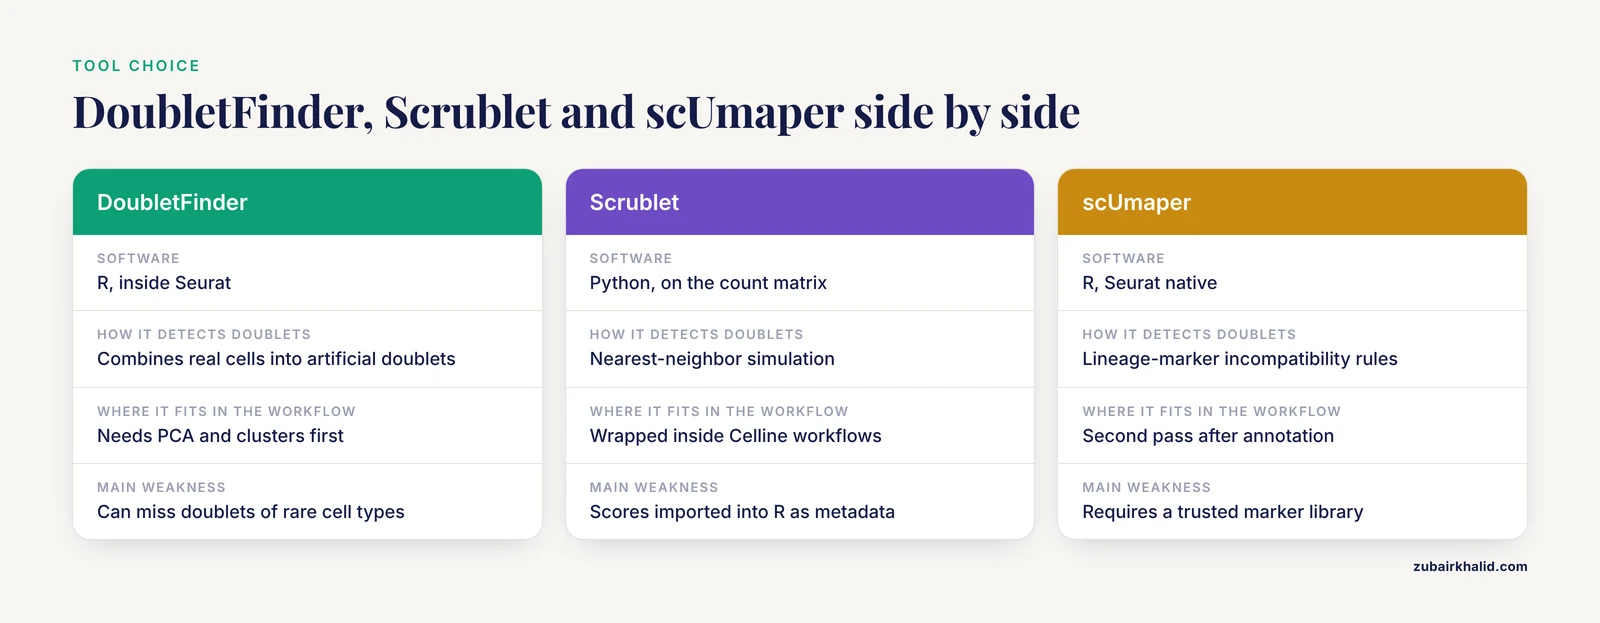
Marker-based annotation pipelines are especially vulnerable. A recent Seurat-native framework, scUmaper, was built specifically because simulation-based doublet detection leaves behind heterotypic doublets that carry implausible cross-lineage marker combinations, and its lineage-marker incompatibility rules removed additional high-confidence doublets that simulation-based tools had retained across six public human organ datasets [1]. The lesson for daily practice is that doublet removal is not a single tool call but a policy: you want at least one simulation-based pass and a sanity check based on biology.
Choosing a doublet removal strategy
Three strategy families dominate current practice, and most careful pipelines use more than one.
| Strategy | Representative tools | How it works | Strengths | Weaknesses |
|---|---|---|---|---|
| Simulation based | DoubletFinder (R), Scrublet (Python), scDblFinder (R) | Artificially combine pairs of real cells, then flag real cells whose profiles resemble artificial doublets | Sensitive, well validated, per-sample rates | Needs clustering to be reasonable first, can miss doublets of rare cell types |
| Marker or rule based | scUmaper | Applies lineage-marker incompatibility rules and re-clusters within lineages to find anomalous cross-lineage co-expression | Interpretable, catches doublets simulation methods retain, Seurat native | Requires a trusted marker library, tuned to the tissue |
| Workflow embedded | Celline (wraps Scrublet), full pipelines | Doublet removal embedded as one step in an end-to-end workflow | Reduces manual curation across many public datasets | Less control over per-sample tuning |
Celline is worth knowing about if you process many public datasets. It retrieves raw scRNA-seq data from public repositories, standardizes metadata, and wraps established tools, including Scrublet for doublet removal, Seurat and Scanpy for quality control and annotation, and Harmony and scVI for batch correction, into one-line commands per step [2]. For a single in-house sample, the manual Seurat and DoubletFinder route below gives you more visibility into each decision.
Order matters too. A published single-cell atlas pipeline for the late-gestation macaque fetal brain ran SoupX ambient RNA correction, empty droplet removal, doublet exclusion, and only then Seurat aggregation, clustering, and annotation [3]. That sequence is the right template: clean the count matrix of ambient RNA and empty droplets first, because ambient RNA and cell-free mRNA inflating background counts will distort both doublet scores and the clustering that doublet tools depend on.
Step-by-step Seurat and DoubletFinder workflow
The walkthrough below assumes one 10x sample. If you have multiple samples, run every doublet-detection step per sample before merging. Section notes explain why.
Step 1: Load the count matrix and apply quality control
library(Seurat)
library(DoubletFinder)

obj <- CreateSeuratObject(
  Read10X_h5("filtered_feature_bc_matrix.h5"),
  project = "sample1",
  min.cells = 3,
  min.features = 200
)

obj[["percent.mt"]] <- PercentageFeatureSet(obj, pattern = "^MT-")

VlnPlot(obj, c("nFeature_RNA", "nCount_RNA", "percent.mt"), ncol = 3)

obj <- subset(obj, subset = nFeature_RNA > 200 & nFeature_RNA < 6000 & percent.mt < 15)
For a human or mouse sample you will typically see violin plots where most cells sit between 500 and 4,000 detected genes and below 10 percent mitochondrial reads. Expected console output from the subset call looks like this:
An object of class Seurat
13714 features across 7802 samples within 1 assay
Active assay: RNA (13714 features, 0 variable features)
The exact cell count depends on your data. Write the number down, because it feeds the doublet calculation in Step 3.
Step 2: Normalize, reduce dimensions, and cluster
DoubletFinder compares each real cell to artificial doublets in the same expression space, so it needs normalized data, principal components, and clusters that reflect real biology. Note that Seurat 5 merged objects can hold multiple layers. If you loaded more than one sample with merge(), run JoinLayers() before this step.
obj <- NormalizeData(obj)
obj <- FindVariableFeatures(obj, selection.method = "vst", nfeatures = 2000)
obj <- ScaleData(obj, verbose = FALSE)
obj <- RunPCA(obj, npcs = 30, verbose = FALSE)

ElbowPlot(obj, ndims = 30)

obj <- FindNeighbors(obj, dims = 1:15)
obj <- FindClusters(obj, resolution = 0.5)
obj <- RunUMAP(obj, dims = 1:15)

DimPlot(obj, label = TRUE)
Use the elbow plot to choose the number of principal components. For most well-behaved samples the curve bends between 10 and 20, so dims = 1:15 is a reasonable default. Expected UMAP output is a plot where clusters are visually separated and labeled 0 through roughly 10 at resolution 0.5 for a mixed tissue sample.
If you use SCTransform instead of the log-normalization path, set sct = TRUE in every DoubletFinder call and skip ScaleData. Mixing the two normalizations is one of the most common sources of wrong doublet calls.
Step 3: Calculate the expected number of doublets
This step converts your loading concentration into a concrete removal target. The standard relationship is approximately 0.8 percent multiplets per 1,000 cells recovered, which DoubletFinder documents in its multiplet rate tables derived from 10x chemistry.
Worked example for a 10x Genomics Chromium Next GEM run:
# Cells loaded per channel according to your target recovery
cells_loaded <- 8000

# Expected multiplet rate: 0.8 percent per 1,000 loaded cells
expected_doublet_rate <- 0.008 * (cells_loaded / 1000)
# = 0.064, or 6.4 percent

cells_after_qc <- ncol(obj)   # suppose 7802

nExp <- round(expected_doublet_rate * cells_after_qc)
nExp
Expected output:
[2] 499Two adjustments refine this number. First, the rate applies to cells loaded, and quality control removes some real cells along with empty droplets, so applying the rate to post-QC cell counts is a slight overestimate, which is acceptable because over-calling near the margin is safer than under-calling. Second, homotypic doublets are usually harmless, so many analysts adjust the target downward using known cluster proportions:
# Optional homotypic adjustment, run after clustering
annotations <- obj$seurat_clusters
homo_rate   <- modelHomotypic(annotations)
nExp_adj    <- round(nExp * (1 - homo_rate))
nExp_adj
modelHomotypic estimates the fraction of expected doublets that pair cells from the same cluster. If your clusters map cleanly to cell types with, say, 0.35 of pairings expected to be homotypic, the adjusted target drops from 499 to about 324.
Step 4: Sweep the pK parameter
The pK parameter controls how many neighboring artificial doublets are considered when scoring real cells, and its optimal value differs for every dataset. The sweep tests many values by perturbing the data:
sweep.res <- paramSweep_v5(obj, PCs = 1:15, sct = FALSE)
sweep.stats <- summarizeSweep(sweep.res, GT = FALSE)
sweep.stats <- find.pK(sweep.stats)

head(sweep.stats)
Expected output from find.pK is a data frame with a pK column, a mean BCmetric per pK, and a BCreal column:
     pK    BCmetric   BCreal
1 0.0005 0.5487231       NA
2 0.0010 0.6012344       NA
3 0.0015 0.7120987       NA
...
The mean decrease in area under the receiver operating characteristic curve is plotted for each pK, and you select the pK at the maximum of the BCmetric curve:
pK_bcm <- sweep.stats$pK[which.max(sweep.stats$BCmetric)]
pK_bcm
Expected output for a typical sample:
[2] 0.009The pK value itself has no biological meaning. It is a tuning constant, and its optimum varies sample by sample, which is exactly why the sweep exists.
Step 5: Run the doublet classification
obj <- doubletFinder_v5(
  obj,
  PCs = 1:15,
  pN = 0.25,
  pK = pK_bcm,
  nExp = nExp_adj,
  reuse.pANN = FALSE,
  sct = FALSE
)
Three parameters deserve attention:
pNis the fraction of artificial doublets generated relative to real cells. The published default of 0.25 works across datasets and rarely needs changing.pKcomes from your sweep in Step 4.nExpis the number of cells called as doublets, from Step 3.
The function adds a metadata column with a name that encodes your parameters, for example DF.classifications_0.25_0.09_324. Inspect the result:
# Find the exact column name
grep("DF.classifications", colnames([email protected]), value = TRUE)

table(obj$DF.classifications_0.25_0.09_324)
Expected output:
Singlet Doublet
  7478    324
Visualize before you delete anything:
DimPlot(obj, group.by = "DF.classifications_0.25_0.09_324")Doublet-classified cells should sit at cluster interfaces, in small mixed clusters, or along trajectories between major populations. If the flagged cells form one tight island far from everything else, that island is more likely a real rare cell type than doublets, and you should stop and investigate before filtering.
Step 6: Remove the doublets and continue
obj <- subset(obj, subset = DF.classifications_0.25_0.09_324 == "Singlet")

# Recreate variable features, PCA, neighbors, clusters on the cleaned object
obj <- FindVariableFeatures(obj, nfeatures = 2000)
obj <- ScaleData(obj, verbose = FALSE)
obj <- RunPCA(obj, npcs = 30, verbose = FALSE)
obj <- FindNeighbors(obj, dims = 1:15)
obj <- FindClusters(obj, resolution = 0.5)
obj <- RunUMAP(obj, dims = 1:15)
Re-clustering after removal is not optional. The original clustering included doublet cells, so cluster boundaries and marker genes carry their imprint. A cleaned re-run frequently dissolves one or two suspicious clusters entirely, which is the clearest sign the procedure worked.
Alternative and complementary tools
Scrublet for Python-centered pipelines
Scrublet predicts doublets directly from the count matrix using nearest-neighbor simulation, and it is the tool wrapped inside Celline for its automated public-data workflows [2]. A minimal Python session looks like this:
import scrublet as scr
import scipy.io

counts = scipy.io.mmread("matrix.mtx").T.tocsr()
scrub = scr.Scrublet(counts, expected_doublet_rate=0.06)
doublet_scores, predicted_doublets = scrub.scrub_doublets()

scrub.plot_doublet_results()
Scrublet returns a per-cell doublet score and a boolean prediction. Cells flagged True are dropped before any Seurat or Scanpy clustering. Many groups run Scrublet in Python and import the scores into R as a metadata column, which lets you compare agreement between two independent predictors.
scUmaper for marker-based doublet removal in Seurat
scUmaper is an R and Seurat-native framework that integrates quality control, biologically grounded doublet filtering, and marker-library-based cell-type annotation [1]. It codifies lineage-marker incompatibility rules, meaning a cell co-expressing mutually exclusive lineage markers at high levels is flagged, and it applies global clustering followed by within-lineage re-clustering to expose anomalous subclusters with implausible cross-lineage co-expression. In stress tests with simulated ambient RNA contamination and reduced sequencing depth, its outputs remained stable under moderate degradation [1].
The practical use case is a second pass. Run DoubletFinder or Scrublet first, cluster, annotate, then check each cluster for cells that co-express incompatible lineage markers. If your annotations say a cluster is "T cells" but a subcluster strongly expresses both CD3D and LYZ, those cells are probable heterotypic doublets the simulation missed.
How to check that doublet removal worked
A correct removal pass produces four observable signatures:
- Phantom clusters disappear. Clusters that sat between two major populations with mixed markers should vanish or shrink after re-clustering.
- Marker co-expression drops. Dot plots or violin plots of lineage-defining genes should show cleaner exclusivity, for example
CD3Dpositive cells no longer expressLYZat high levels. - Cluster number becomes biologically sensible. You should not lose real rare populations. Compare cluster counts before and after, and verify that known cell types from your tissue are still present.
- Doublet classifications correlate with a second method. If you ran both Scrublet and DoubletFinder, the majority of high-score cells should agree. Widespread disagreement usually indicates a preprocessing problem, not a tool problem.
Keep the unfiltered object saved as obj_raw.rds. Doublet calls are predictions, and reviewers or collaborators may want to audit them.
Common errors with exact messages and fixes
This section addresses the failures that generate most bioinformatics troubleshooting requests around this step.
"Error in doubletFinder_v5(): Cannot find pANN..." or a similarly named missing column. This happens when you rerun doubletFinder_v5 with reuse.pANN = TRUE but the column name string does not match the existing metadata column, which embeds the pN, pK, and nExp values in its name. Fix it by printing the exact column name with grep("pANN", colnames([email protected]), value = TRUE) and passing that exact string, or set reuse.pANN = FALSE to recompute.
An error mentioning that cells are present in more than one layer, in Seurat 5. Merged objects hold counts in separate layers per sample, and DoubletFinder operations expect a single layer. Fix it with obj <- JoinLayers(obj) immediately after merge() and before any normalization.
paramSweep runs out of memory or takes hours on a large sample. The sweep generates perturbed copies of the dataset, so memory scales with cell count. Fix it by running each sample separately rather than a merged 100,000-cell object, reducing the PCA dimensionality passed to PCs, or increasing available RAM. A sweep on a 10,000-cell sample should take minutes, not hours.
Doublet calls look random and ignore clusters. The usual cause is running detection on a poorly clustered object, for example too few principal components or a resolution so low that all cells fall in one or two clusters. DoubletFinder's artificial doublets are built by averaging cells across clusters, so bad clusters mean bad artificial doublets. Re-examine your ElbowPlot and DimPlot, fix the clustering, then rerun.
Wrong doublet rate applied. Using a flat 5 percent on a sample loaded to 1,000 cells overestimates the burden several-fold, and using it on a 20,000-cell channel underestimates it. Always compute the rate from your loading target as shown in Step 3.
An RNA seq error in the counts themselves, such as elevated ambient RNA. High ambient RNA raises the baseline expression of background genes in every cell, which flattens the contrast doublet detection depends on. Deal with ambient RNA before doublets, as the macaque fetal brain atlas pipeline did by running SoupX removal of ambient RNA and empty droplet removal before doublet exclusion [3].
Calls made on integrated or batch-corrected data. Some analysts run doublet detection on a Harmony or scVI integrated object. Corrected expression spaces are built to remove batch structure, and artificial doublets built in that space can misclassify. Run detection per sample on raw-normalized counts, then integrate the singlets.
Common Mistakes and Limitations
- Detecting doublets on merged multi-sample objects. Doublet rates depend on per-channel loading, and merging pools samples with different rates into one distribution. Run per sample, then merge the singlets.
- Treating the expected rate as fixed. The rate scales with cells loaded per channel. A flat percentage applied to every sample is a guess, not a calculation.
- Filtering before looking. Always plot the flagged cells on the UMAP and inspect their markers before subsetting. A flagged island that expresses a coherent rare program is a discovery, not a doublet population.
- Over-trusting simulation-based scores for rare cell types. Simulation needs enough cells per cluster to build realistic artificial doublets, so rare populations are underrepresented among predicted doublets. This is precisely the gap marker-based rules fill, and why scUmaper's cross-lineage co-expression checks removed doublets that simulation-based approaches retained [1].
- Removing doublets before basic QC. Doublet scores are unreliable on data contaminated with ambient RNA and empty droplets. Follow the order of ambient correction, droplet filtering, doublet exclusion, then clustering [3].
- Assuming homotypic doublets must be removed. Homotypic doublets resemble their parent cell type. Aggressive removal toward the full expected rate can delete real cells from small populations. The homotypic-adjusted
nExpexists for this reason. - Deleting flagged cells without recording parameters. The classification column name encodes pN, pK, and nExp. Save the metadata and the script. A doublet set without its parameters is not reproducible.
- Confusing high mitochondrial content with doublets. Stressed or dying cells have high
percent.mtbut are single cells. Remove them in QC, not through the doublet module. - Forgetting that detection is probabilistic. Scores near the decision boundary are uncertain. For publication-grade work, state your method and parameters explicitly in the methods section, and note that individual borderline cells may be misclassified.
One general limitation applies to any analysis of biological samples. Cell quality varies by tissue, dissociation protocol, and donor, so no fixed parameter set is universally correct, and ambiguous cases deserve expert review of the underlying markers.
Next steps
Once singlets are isolated and re-clustered, the natural continuation is cell-type annotation with canonical markers, followed by differential expression per cluster and trajectory analysis. If you are processing many public datasets rather than one in-house sample, an end-to-end wrapper such as Celline can carry retrieval, metadata standardization, Scrublet-based doublet removal, Seurat or Scanpy QC, and integration into single-line commands [2]. Keep the habit of auditing flagged cells visually regardless of which tool automates the step.
Frequently Asked Questions
What is a doublet in single-cell RNA-seq?
A doublet is one sequencing barcode that captured two cells, producing a composite expression profile that is not a real cell. Heterotypic doublets, which combine two different cell types, are the harmful kind because they create false intermediate populations and false marker co-expression.
How many doublets should I expect to remove?
Estimate the rate from your loading concentration, using roughly 0.8 percent multiplets per 1,000 cells loaded in a 10x channel. A sample loaded to recover 8,000 cells carries about a 6.4 percent expected doublet rate, so you would flag roughly 6.4 percent of post-QC cells, optionally reduced by a homotypic adjustment.
Can I run doublet detection on a merged dataset with multiple samples?
No, run detection separately on each sample and merge the singlets afterward. Doublet rates differ per channel, artificial doublets should be built within a sample's expression space, and merged Seurat 5 objects need JoinLayers() before the modules will even run.
Should I remove doublets before or after clustering?
After a first clustering pass, because simulation-based tools need clusters to build artificial doublets and define expression neighborhoods. Remove doublets, then re-cluster from variable feature selection onward so the final clusters are free of doublet influence. Ambient RNA removal and empty droplet filtering come before all of it [3].
Does DoubletFinder work with SCTransform normalization?
Yes. Set sct = TRUE in paramSweep and doubletFinder calls, skip ScaleData, and do not mix SCT-normalized and log-normalized inputs. A mismatch between your normalization and the sct flag is a common cause of nonsensical classifications.
What is the difference between Scrublet and DoubletFinder?
Both are simulation-based, but Scrublet runs in Python on the raw count matrix and scores cells with nearest-neighbor graphs, while DoubletFinder runs inside Seurat in R and relies on your existing PCA and clustering. Celline wraps Scrublet as part of an automated end-to-end workflow for public scRNA-seq data [2]. Running both and checking agreement is good practice.
Can doublet removal delete a real cell type?
Yes, if the expected doublet number is set too high or if a rare cell type sits near a cluster interface. Plot flagged cells before filtering, inspect their markers, and use the homotypic adjustment so the target does not exceed the plausible doublet burden.
Do I still need doublet removal if I correct ambient RNA?
Yes, ambient RNA correction and doublet removal address different artifacts. Ambient RNA adds background transcript signal to every cell, while doublets are entire miscounted cells, and correcting one does not remove the other. Order the steps ambient correction, droplet filtering, doublet exclusion, then clustering [3].
Sources
- scUmaper: An automated framework for doublet removal and cell-type annotation in single-cell transcriptomics.
- Celline: a flexible tool for one-step retrieval and integrative analysis of public single-cell RNA sequencing data.
- A single-cell transcriptomic atlas of the periventricular proliferative zone in the late gestation fetal brain in the pigtail macaque.