Reference Genome Mismatch RNA-seq: Step-by-Step Guide
By Dr. Zubair Khalid, DVM, MS, PhD ·
Reference genome mismatch is the situation where your RNA-seq reads come from a biological sample whose genome differs from the reference you align against. The differences can be small (single nucleotide polymorphisms, or SNPs), structural (insertions of retrotransposon-sized sequence), or large (mapping reads from one species to the genome of a close relative). By the end of this guide you will be able to do four things. First, measure how much of your data is being lost or biased by mismatched alignment. Second, choose the right fix for your specific mismatch scenario. Third, rebuild or reparameterize your alignment so divergent reads map correctly. Fourth, validate the fixed pipeline so you can prove the improvement to a reviewer or collaborator.
You will need a Linux or macOS environment with at least 16 GB of RAM (32 GB is more comfortable for human or mouse genomes), the STAR, HISAT2, Bowtie2, or GSNAP aligner installed, samtools for post-processing, your FASTQ files, and a reference genome in FASTA format with a matching annotation file (GTF or GFF3). Every command below assumes those are on your PATH.
What Counts as a Reference Mismatch
The phrase covers several distinct problems that share a symptom, namely reads that fail to align, align wrongly, or align with suspiciously many mismatches. Distinguishing them is the first step of any sensible bioinformatics troubleshooting session, because each has a different fix.
Inter-individual divergence. The standard reference genome contains one allele at every locus. A read overlapping a polymorphic site carrying the non-reference allele is at least one mismatch away from the reference, which lowers its alignment score and can push it below the aligner's cutoff [1]. This affects allele-specific expression (ASE) analysis most severely, but it also shaves mapping rate in every ordinary pipeline.
Cross-species divergence. When your organism has no finished genome, a common strategy is to map to the genome of a close relative. Studies of non-human primate samples mapped to the human genome show that reference-based mapping remains useful for differential expression, but the choice of alignment method changes the results enough that the mapping details must be considered explicitly [2]. In plants, transcriptome data from Agropyron cristatum was mapped to wheat references using a 5 percent mismatch parameter, which recovered over 860,000 high-quality variants between the species [3].
Modified or damaged nucleotides. Nucleotide conversion methods, including metabolic RNA labeling and RNA bisulfite sequencing, deliberately introduce C-to-U or C-to-T conversions into the transcript. The resulting reads contain true mismatches against the reference, and mapping biases under these conditions remain poorly understood, which motivated dedicated simulation frameworks to measure how state-of-the-art spliced mappers handle converted reads [4].
Reference version and annotation mismatch. Sometimes the alignment is fine and the annotation is wrong. In the mouse Oprm1 locus, long-read RNA-seq showed the primary transcript extends roughly 9.5 kilobases past the annotated exon 4 end, a direct conflict between the observed transcriptome and the mm10 annotation [5]. Separately, a Japanese family study found SVA retrotransposon insertions in mismatch repair genes that were absent from hg19 and hg38 but present in a Japanese-specific reference assembly [6]. These are cases where the reference itself, not the alignment settings, is the limiting resource.
Contamination and small RNA divergence. In small RNA work, alignments dominated by mismatches are frequently noise rather than biology. A high-sensitivity screen for bovine leukemia virus miRNAs across 335 human small RNA-seq datasets found only a handful of reads hitting the viral references, and those hits were predominantly low-quality alignments with mismatches, consistent with background noise rather than genuine viral miRNAs [7].
Why Mismatch Causes Real Quantitative Errors
A dropped read is not the worst outcome. The worst outcome is a systematic, directional bias that survives into your downstream statistics.
For allele-specific expression, reads carrying the reference allele map more easily than reads carrying the alternate allele, so relative ASE is biased toward the reference allele. The bias grows with divergence between the two alleles, and clusters of differentiating sites block alternate-allele reads from aligning at all [8]. In one modeling study, constructing an enhanced reference genome that included alternate alleles at known polymorphic loci reduced the number of loci with mapping bias by at least 63 percent compared with masking polymorphic loci, and mapped up to 15 percent more reads than an unaltered reference [1]. Those numbers should change how you think about "small" levels of divergence. A few percent sequence difference is not a cosmetic issue. It is a measurable distortion of allele ratios and, in aggregate, of gene counts.
Splice junctions are a second pressure point. The large multi-center evaluation of RNA-seq aligners run through the RGAST framework found major performance differences across 26 mapping protocols in alignment yield, basewise accuracy, mismatch and gap placement, and splice junction discovery, with a reduced false discovery rate for splice junctions named as a priority for future aligner work [9]. A divergent read that maps with forced mismatches near a junction can produce a plausible-looking but incorrect junction call, so mismatch-heavy data needs junction-level scrutiny, not just mapping-rate scrutiny.
Finally, alignment algorithm choice itself interacts with mismatch tolerance. Evaluations of 14 alignment programs across hashing-based and FM-index based classes showed that precision and recall under mismatched conditions differ substantially between algorithms, so two pipelines with identical parameters on paper can behave very differently on divergent data [10].
Step 1: Establish a Baseline and Quantify the Problem
Before touching any parameters, map a representative sample with default settings and measure two things: the overall mapping rate and the distribution of per-read mismatches.
Map with STAR, a splice-aware aligner that handles transcript reads against a genome:
STAR --runThreadN 8 \
     --genomeDir hg38_star_index \
     --readFilesIn sample_R1.fastq.gz sample_R2.fastq.gz \
     --readFilesCommand zcat \
     --outFileNamePrefix baseline_ \
     --outSAMtype BAM SortedByCoordinate
Then summarize the alignments:
samtools flagstat baseline_Aligned.sortedByCoord.out.bamExpected output, abbreviated:
98765432 + 0 in total ...
87012345 + 0 mapped (88.10% : N/A)
A healthy mammalian library typically maps at 80 to 95 percent with default parameters. If a sample sits far below its neighbors in the same project, mismatch-driven rejection is one candidate cause, along with contamination, degradation, and wrong species.
Next, extract the per-read mismatch count. The NM tag records edit distance:
samtools view baseline_Aligned.sortedByCoord.out.bam \
  | grep -o 'NM:i:[0-9]*' \
  | sort | uniq -c
Expected output:
64201193 NM:i:0
18934220 NM:i:1
 4210987 NM:i:2
  998341 NM:i:3
  200484 NM:i:4
   45112 NM:i:5
A bimodal or heavy right tail is diagnostic. In a clean, matched human library, the counts fall off steeply after NM 1 or 2. If a large fraction of mapped reads carry 4 or more mismatches, or if the unmapped fraction is elevated, you have a mismatch problem worth fixing. samtools stats also reports an overall mismatch rate you can track across samples:
samtools stats baseline_Aligned.sortedByCoord.out.bam \
  | grep '^SN' | grep -i mismatch
Step 2: Choose a Fix Strategy
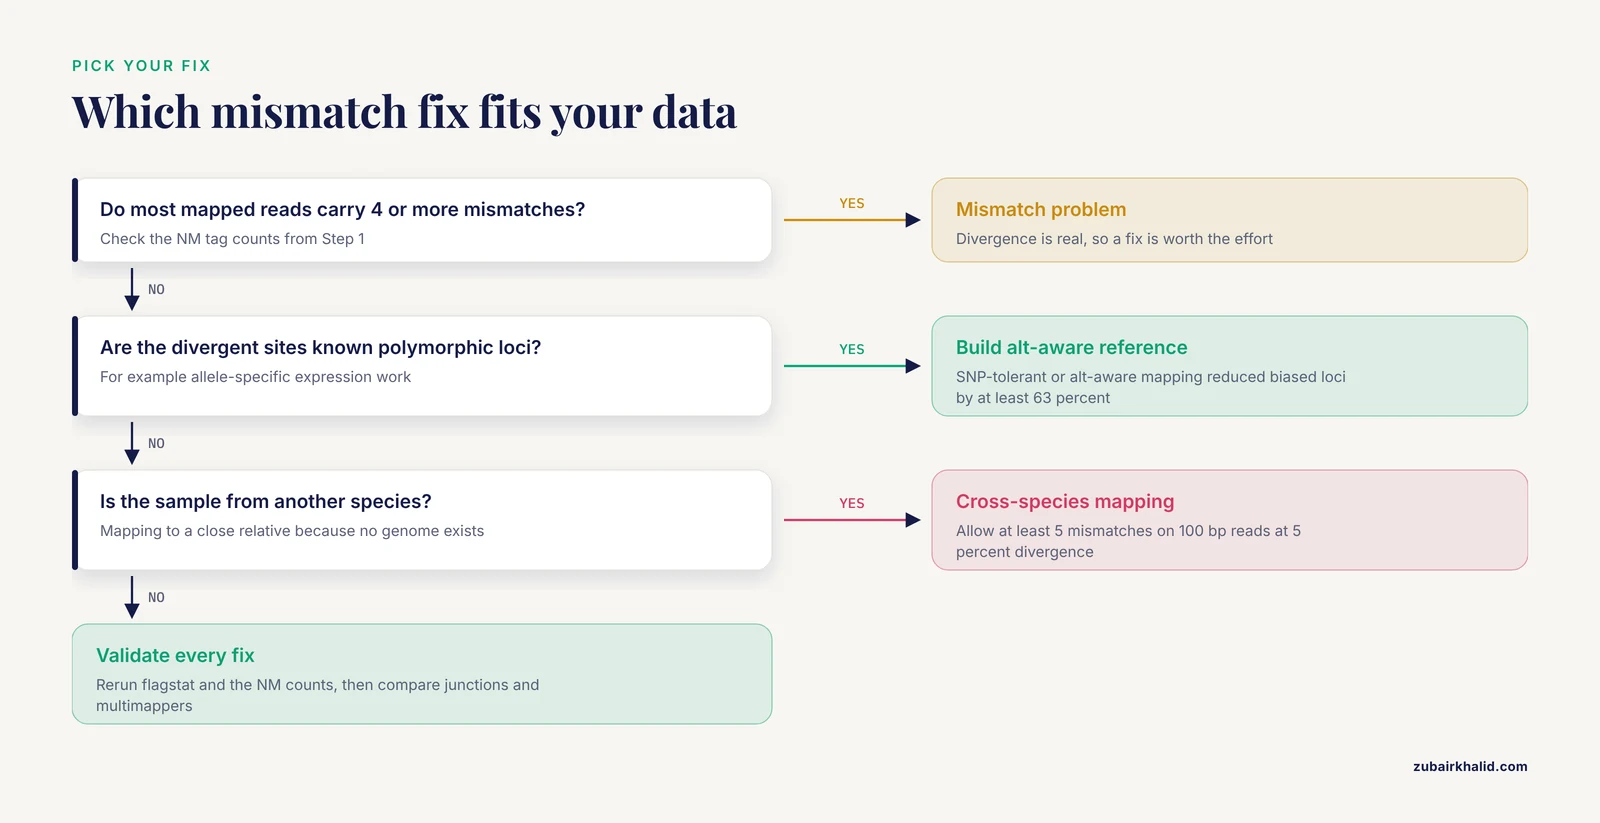
Use this table to match your scenario to a response. The sections that follow give commands for each row.
| Scenario | Symptom | First-line fix | Watch out for |
|---|---|---|---|
| Known SNPs between sample and reference (ASE work) | Reference-allele bias at variant sites | SNP-tolerant or alt-aware reference mapping [1] | Multi-mappers created by duplicated alt loci |
| Cross-species mapping to a close relative | Low mapping rate, right-shifted NM distribution | Loosened mismatch parameters, tolerant aligners [2] [3] | False splice junctions, paralog misassignment [9] |
| Nucleotide conversion libraries (SLAM-seq, bisulfite) | Conversion-specific mismatch pattern | Simulation-informed parameter choices [4] | Conversion reads mistaken for SNPs |
| Reference version too incomplete | Reads pile on unannotated or absent loci | Updated or population-specific reference [6] [5] | Re-annotation effort versus remapping |
| Small RNA, short reads | Mismatch-heavy hits to off-target references | Strict mismatch filters such as -v 1 [11] [12] | Noise mistaken for detection [7] |
Step 3: Loosen Alignment Parameters Carefully
The default mismatch filters in most aligners assume the read and reference belong to the same individual. For divergent samples, you raise the caps deliberately.
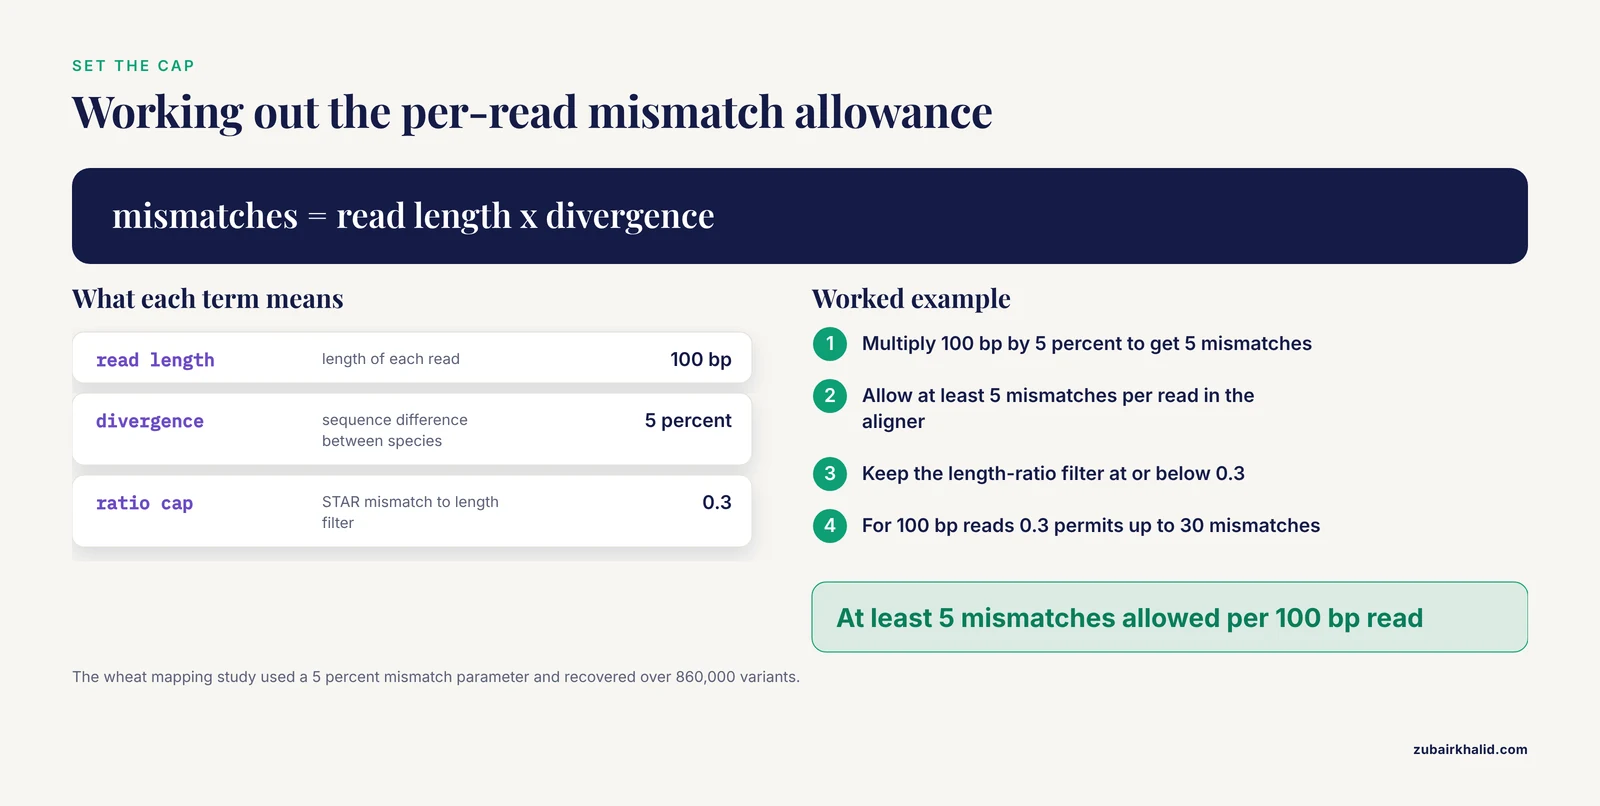
With STAR, the two relevant parameters are -outFilterMismatchNmax (maximum mismatches per read, default 10) and -outFilterMismatchNoverLmax (maximum ratio of mismatches to read length, default 0.3):
STAR --runThreadN 8 \
     --genomeDir hg38_star_index \
     --readFilesIn sample_R1.fastq.gz sample_R2.fastq.gz \
     --readFilesCommand zcat \
     --outFilterMismatchNmax 999 \
     --outFilterMismatchNoverLmax 0.3 \
     --outSAMattributes NH HI AS nM NM \
     --outFileNamePrefix tolerant_ \
     --outSAMtype BAM SortedByCoordinate
Setting -outFilterMismatchNmax 999 makes the per-read cap effectively unlimited, leaving the length-ratio filter as the only constraint. For a 100 bp read, a ratio of 0.3 permits up to 30 mismatches, which comfortably accommodates the roughly 5 percent divergence handled in the wheat mapping study, where a 100 bp read needed at least 5 mismatches allowed to cross species [3]. Keep the length-ratio filter at or below its default so you do not admit read-length stretches of pure noise.
With Bowtie2 in end-to-end mode, the key parameters are -N (mismatches allowed in the seed, 0 by default), -L (seed length), and -R (re-seeding attempts). Raising -N to 1 and shortening -L makes seeding succeed on divergent reads:
bowtie2 -x hg38 \
        -1 sample_R1.fastq.gz -2 sample_R2.fastq.gz \
        -N 1 -L 20 -R 3 \
        -p 8 --no-unal \
        -S tolerant.sam
Be honest about the trade-off. More permissive parameters increase sensitivity but also increase multimapping and false junction discovery, the exact failure modes flagged in the multi-aligner evaluation [9]. Independent evaluations support the same caution, showing that precision and recall under mismatched conditions vary widely across algorithms, which means parameter changes should be validated rather than assumed [10].
As an alternative class of tool, mismatch-tolerant exhaustive aligners exist for quantitative work. FANSe, a seed-based algorithm that uses the whole read for mapping with adjustable mismatch allowance and indel handling, was designed to map divergent or error-containing reads quantitatively and showed strong coverage of low-abundance mRNAs [13]. It is slower than FM-index aligners but worth considering when sensitivity of low-abundance transcripts matters more than wall-clock time.
Step 4: Build a SNP-Tolerant or Alt-Aware Reference
If your reads differ from the reference at known polymorphic loci, the cleanest fix is to teach the aligner about the alternate alleles rather than brute-force more mismatches. The principle was demonstrated with an enhanced reference genome containing alternate alleles at known polymorphic loci, which reduced biased loci by at least 63 percent relative to masking variants and mapped up to 15 percent more reads [1].
GSNAP supports this directly through a SNP file it uses during alignment, an approach used in the primate cross-mapping comparison alongside TopHat2, Bowtie2, and Stampy [2]:
gsnap -d hg38 -s known_snps.iit \
      -N 1 -B 5 -t 8 \
      -A sam \
      sample_R1.fastq.gz sample_R2.fastq.gz \
      > tolerant.sam
Here -s supplies known SNPs so the aligner can distinguish a known variant from an error, and -N 1 permits one novel SNP per read. The SNP index is built with the GSNAP companion tool gmap_build and snp2iit from a VCF.
HISAT2 offers an equivalent route, embedding SNPs into the graph index itself:
extract_snps.py hg38.gtf hg38_snps.vcf > hg38_snp.txt
hisat2-build --snp hg38_snp.txt -p 8 hg38.fa hg38_snp_index
hisat2 -p 8 -x hg38_snp_index \
       -1 sample_R1.fastq.gz -2 sample_R2.fastq.gz \
       -S tolerant_hisat2.sam
After mapping to an alt-aware reference, downstream quantification must still assign reads unambiguously. For ASE specifically, the single-reference study found accuracy improved further by excluding differentiating sites within reads that could not be uniquely aligned, and by excluding reads overlapping indels between alleles [8]. In practice this means post-filtering your BAM: keep reads with a single best alignment, drop reads spanning variant-adjacent indels, and compute allele fractions only over positions where mappability is equal for both alleles.
Step 5: Cross-Species Mapping
When no species-specific genome exists, map to the closest relative and accept a trade-off. The primate study mapped macaque-type data against the human genome and transcriptome with four methods, TopHat2 and GSNAP to the genome, and Bowtie2 and Stampy to both genome and transcriptome, then compared mapping rates, detected genes, expression correlations, and differential expression utility [2]. Its central finding is practical. Reference-based mapping to a related genome has genuine utility for differential expression, but the details of the mapping method matter, so benchmark two or three approaches on a subset of your data before committing.
Set divergence expectations numerically where you can. In the grass study, sequence similarity of most trait-related genes exceeded 95 percent between Agropyron cristatum and wheat, so a 5 percent mismatch allowance was both justified and sufficient to recover over 860,000 variants [3]. If your pair of organisms has comparable divergence, a per-read allowance of at least 5 mismatches on 100 bp reads is a reasonable starting point, and the NM distribution from Step 1 will tell you where the read population actually sits.
For differential expression across species, avoid collapsing every read onto its single best homolog. A cluster-based approach that treats the set of homologs from the novel species as a single gene in the reference species showed superior power to detect differential expression compared with best-match analysis in simulations and in a naked-mole-rat versus mouse case study [14]. Mismatched multi-transcript homology is a counting question as much as an alignment question.
Step 6: Special Cases, Small RNA and Splice Junctions
Small RNA-seq needs the opposite philosophy from cross-species mRNA work. Reads are short, so a few mismatches are proportionally huge, and spurious alignments are common. Benchmarking of human small RNA pipelines recommended Bowtie with one mismatch allowed (-v 1), trimming with a lower length bound of 15 and an upper bound of read length minus 40 percent of adapter length, and DESeq2 for differential expression [11]. Counting tools built for this space give explicit mismatch control. tiny-count allows filtering alignments by number of mismatches and resolves variants such as miRNAs and isomiRs with single-nucleotide precision, including hierarchical classification when piRNAs and siRNAs arise from the same locus [12].
The cautionary lesson for small RNA comes from the virus screen. Across roughly 1.98 billion trimmed human reads, only 60 aligned to the viral miRNA references, and those hits were predominantly mismatch-containing alignments consistent with noise, while infected cattle samples showed robust canonical detection [7]. Read that as an operational rule. Alignment hits dominated by mismatches, especially against a reference the sample should not contain, are far more likely to be an rna seq error artifact than a finding.
Splice-aware libraries deserve junction-specific checks. In the long-read Arabidopsis study, mismatch profiles around splice junctions provided a powerful feature to distinguish correct junctions from false ones, and the resulting reference transcript dataset doubled the known transcriptome [15]. You can borrow the principle for short reads. After remapping divergent samples, inspect mismatch density at novel junctions. A junction supported by reads with clustered mismatches at its boundaries deserves suspicion, and a junction with a canonical GT-AG motif plus low boundary mismatch deserves confidence.
Step 7: Validate the Fix
Run the same diagnostics as Step 1 on the remapped data and compare.
samtools flagstat tolerant_Aligned.sortedByCoord.out.bam
samtools view tolerant_Aligned.sortedByCoord.out.bam \
  | grep -o 'NM:i:[0-9]*' \
  | sort | uniq -c
Three checks tell you whether the fix worked and whether it overcorrected.
First, mapping rate should rise for the divergent samples while staying roughly stable for well-matched samples in the same project. If matched samples also gain large amounts of mapping, your new parameters are too permissive.
Second, the NM distribution should shift left. For allele-specific work, quantify the effect directly by re-estimating allele fractions at known variant sites before and after the fix. A reduction in reference-allele bias is the outcome that matters [8].
Third, examine splice junctions and multimappers. Compare novel junction counts between the baseline and tolerant runs. A large inflation of novel junctions with poor canonical motif support signals false discovery, the failure mode the aligner evaluation community explicitly identified [9]. Read-map fidelity provides a related sanity check in reference construction contexts. In the grapevine assembly comparison, assemblies retaining greater fidelity to the original data showed more than 94 percent of reads mapping back with zero mismatches versus 87 percent for the older assembly [16]. The analogous question for your pipeline is how many reads map with zero mismatches. An honest number there, alongside the tolerant mapping rate, separates real divergence from aligner sloppiness.
For differential expression projects, run quantification and DESeq2 or an equivalent on both the baseline and tolerant alignments for one contrast. Concordant direction and effect sizes on the strong signals, with the tolerant run adding previously missing genes, is the pattern you want [2].
Common Mistakes and Limitations
Treating a low mapping rate as automatically bad. A lower mapping rate under strict parameters can be more truthful than a high rate under loose parameters, because loose parameters convert real errors into confident-looking alignments. The 60-read viral screen result shows how mismatch-laden alignments manufacture apparent detections out of noise [7]. Always inspect the NM distribution of the newly mapped reads, not just the total.
Loosening parameters without rechecking splice junctions. Permissive mismatch settings increase false splice junction discovery, which was a documented weakness across aligners in the multi-center evaluation [9]. Filter novel junctions by canonical motif support and by mismatch profile at the junction boundaries [15].
Fixing ASE by raising mismatch caps alone. Raising caps helps, but the systematic allele bias study showed the strongest accuracy came from combining raised mismatch allowances with mappability filtering and indel-overlap exclusion [8]. Parameter changes are one component, not the whole answer.
Assuming the reference is complete. Population-specific sequence can be genuinely absent from the canonical reference, as with the SVA insertions found in a Japanese-specific assembly but not in hg19 or hg38 [6]. Annotation can also lag observed transcripts, as the Oprm1 3-prime extension in mm10 demonstrated [5]. If divergent reads cluster at specific loci rather than spreading genome-wide, suspect missing sequence or stale annotation rather than global divergence.
Skipping simulation when the stakes are high. For conversion-based protocols, mapping biases are non-obvious and method-dependent, and dedicated simulation frameworks exist precisely because intuition fails here [4]. Simulate a small converted dataset with known truth before interpreting real conversions.
Benchmarking on a single sample. The primate cross-mapping study compared six mapping approaches because the method choice itself changed downstream conclusions [2]. Test at least two strategies on several samples spanning your experimental groups.
Forgetting to record the reference version. Mismatch problems are version-specific. Record the assembly, annotation release, aligner version, and every non-default parameter in your log, or your troubleshooting will not be reproducible.
One final limitation. The recommendations here reflect the published comparisons cited throughout. Individual datasets, especially with unusual library types or poorly characterized organisms, can behave differently, so treat the validation step as mandatory rather than optional.
Frequently Asked Questions
How many mismatches can I allow before my RNA-seq results become unreliable?
There is no universal threshold, but the danger sign is multimapping and false junctions rather than mismatch count itself. Set the per-read cap to accommodate your expected divergence, for example at least 5 mismatches for 100 bp reads at roughly 5 percent sequence difference, then verify that junction calls and multimapper fractions did not inflate [9] [3].
Can I map mouse reads to the human genome or vice versa?
It is possible with sufficiently permissive parameters, but results degrade quickly with divergence and the primate literature shows method choice strongly affects outcomes even at much smaller divergence [2]. Use the closest available reference for your organism, and reserve cross-genus mapping for exploratory work.
Why does my mapping rate drop for only some samples?
Sample-specific divergence such as a different strain, a cross, or a tumor karyotype can lower mapping while other samples stay normal. Compare the NM distribution between the affected and normal samples. A right-shifted NM tail in the affected samples points to divergence, whereas uniformly low mapping across all samples points to library quality or contamination.
Does reference mismatch affect differential expression results?
Yes, through lost and biased reads, but the effect can still leave useful data. Cross-species reference mapping retained utility for differential expression in primate data, with the caveat that mapping details must be reported and considered [2]. Cluster-based homology counting improves power when multiple homologs compete for reads [14].
Should I align RNA-seq reads to the genome or the transcriptome?
For mismatch work, genome alignment with a splice-aware aligner is standard because it lets you detect novel junctions and inspect mismatch locations. Transcriptome mapping was part of the cross-species comparison toolbox and can be simpler for quantification, but it cannot discover unannotated structure [2]. Genome alignment with a well-curated annotation is the safer default.
How do I tell real divergent alignments from noise?
Look at mismatch position and clustering. Noise-dominated hits tend to carry scattered or clustered mismatches inconsistent with known variation, as seen in the viral screen where mismatch-heavy alignments against an absent virus were classified as background [7]. Real divergence concentrates at known variant sites and reads reproduce it consistently across samples.
What is an alt-aware reference and when do I need one?
An alt-aware or enhanced reference includes alternate alleles at known polymorphic loci so the aligner scores variant reads fairly. It is worth building when allele-specific expression or variant-adjacent quantification matters, because it reduced biased loci by at least 63 percent and mapped up to 15 percent more reads in one study [1].
Does reference mismatch matter for small RNA-seq?
It matters differently. Short reads make every mismatch costly, so strict mismatch filtering such as one mismatch with Bowtie is recommended rather than permissive mapping [11]. Counting tools with single-nucleotide precision let you separate true variants and isomiRs from mismatched noise [12].
Sources
- A new strategy to reduce allelic bias in RNA-Seq readmapping.
- Comparing reference-based RNA-Seq mapping methods for non-human primate data.
- RNA-Seq Analysis Provides the First Insights into the Phylogenetic Relationship and Interspecific Variation between Agropyron cristatum and Wheat.
- Splice_sim: a nucleotide conversion-enabled RNA-seq simulation and evaluation framework.
- μ-Opioid receptor transcriptional variants in the murine forebrain and spinal cord.
- SVA retrotransposon insertion in exon of MMR genes results in aberrant RNA splicing and causes Lynch syndrome.
- Absence of detectable bovine leukemia virus miRNAs in human cancer small RNA-seq datasets.
- Sources of bias in measures of allele-specific expression derived from RNA-sequence data aligned to a single reference genome.
- Systematic evaluation of spliced alignment programs for RNA-seq data.
- A comprehensive evaluation of alignment algorithms in the context of RNA-seq.
- Approaches for sRNA Analysis of Human RNA-Seq Data: Comparison, Benchmarking.
- tiny-count: a counting tool for hierarchical classification and quantification of small RNA-seq reads with single-nucleotide precision.
- FANSe: an accurate algorithm for quantitative mapping of large scale sequencing reads.
- Homology cluster differential expression analysis for interspecies mRNA-Seq experiments.
- A high-resolution single-molecule sequencing-based Arabidopsis transcriptome using novel methods of Iso-seq analysis.
- Comparison of three assembly strategies for a heterozygous seedless grapevine genome assembly.