Real-Time Monitoring of Genomic Data Quality in the Cloud
By Dr. Zubair Khalid, DVM, MS, PhD ·
By the end of this guide you will be able to stand up a working, event-driven quality monitoring loop for sequencing data in the cloud. Every time a FASTQ or BAM file lands in an S3 bucket, the pipeline will compute quality metrics, compare them against thresholds you define, push those metrics to a monitoring service, and raise an alarm within minutes of a bad run. You will also learn how to extend the same loop to long-read sequencers that produce data continuously, how to scale read classification across hundreds of machines, and how surveillance groups have applied these patterns to outbreaks involving more than a million samples.
Before you start, have the following ready:
- An AWS account with permissions for S3, EventBridge, Batch, and CloudWatch (the walkthrough uses these, and the same pattern maps onto Google Cloud or Azure)
- AWS CLI version 2 installed and configured (
aws configure) - Docker, so you can build and test the QC container locally before pushing it to a registry
- Nextflow installed if you want the workflow option shown in step 4
- A small test dataset. Two synthetic FASTQ files, roughly 10,000 reads each, are enough to validate the whole loop end to end
What Real-Time Genomic Data Quality Monitoring Means
Traditional quality control (QC) is a batch activity. The sequencer finishes, a scientist downloads the run folder, runs FastQC or an equivalent tool, reads the report, and decides whether to proceed. That decision may arrive hours or days after the data was generated. Real-time monitoring of genomic data quality in the cloud shortens this loop. The metrics are computed as data arrives or shortly after, the results are visible on a shared dashboard, and out-of-range values trigger alerts automatically.
Three properties define a real-time monitoring system:
- Event-driven execution. Analysis starts because data arrived, not because a person ran a command.
- Continuous visibility. Metrics accumulate in a store that anyone on the team can query, rather than living in PDF reports on one laptop.
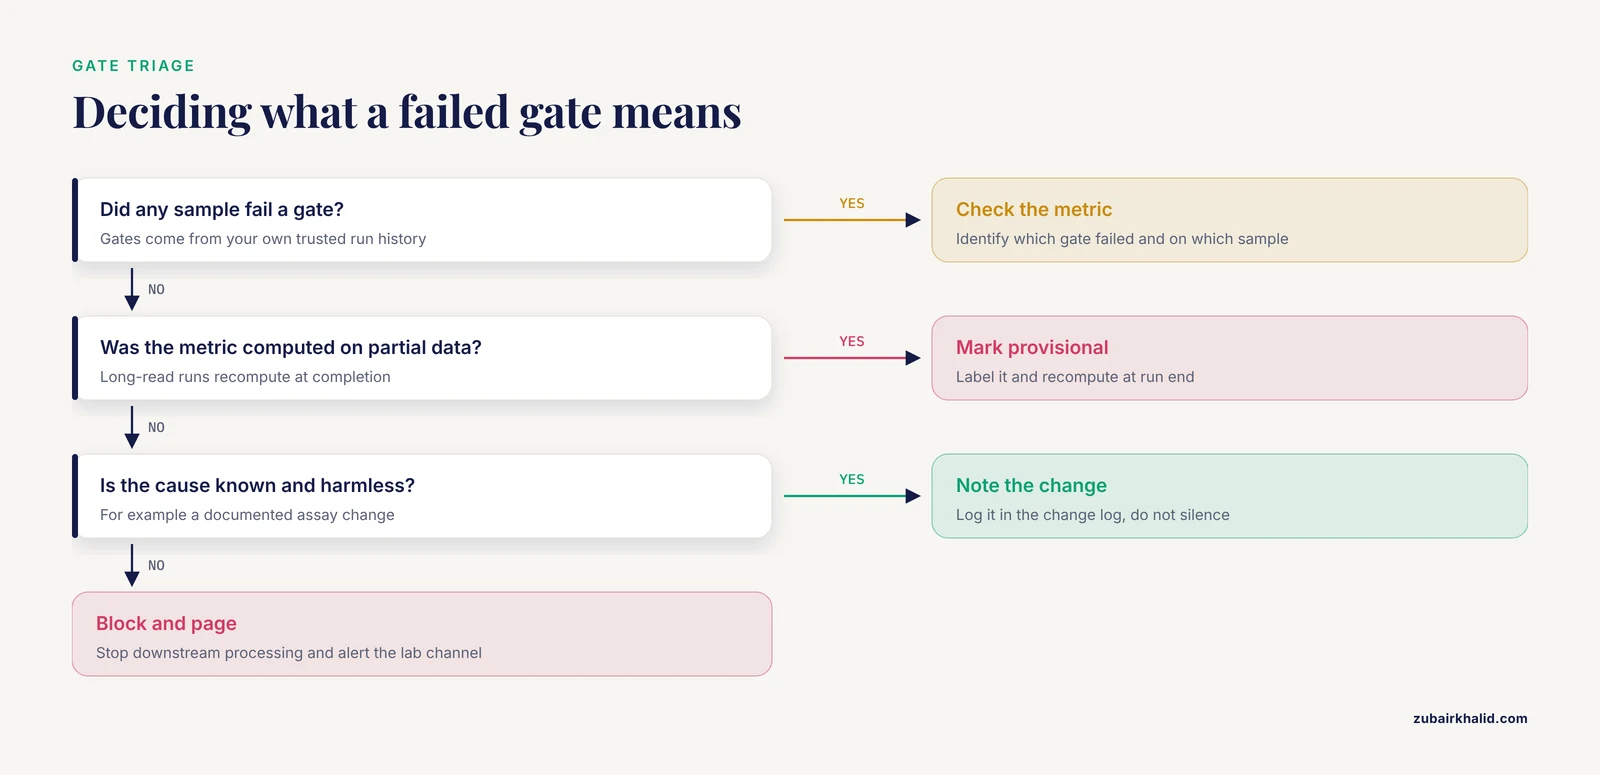
- Actionable thresholds. Each metric has a gate. A gate is a numeric or qualitative rule that classifies a sample as pass, warn, or fail, and a fail blocks downstream processing or page someone.
This is distinct from monitoring the analysis infrastructure itself. Checking that an EC2 instance is alive is systems monitoring. Checking that 30 percent of reads in a run failed adapter trimming is genomic data quality monitoring. A production system needs both, but this article focuses on the second.
The value of the approach is best seen in surveillance settings. A large saliva-based surveillance program in Arizona processed approximately 1.4 million samples by RT-PCR between April 2020 and December 2023, sequenced 69,595 of them, and produced 54,040 high-quality consensus genomes, enabling real-time tracking of infection trends and viral lineages [1]. At that volume, discovering quality problems a week after the fact would have wasted thousands of library preparations. Continuous QC is what makes scale survivable.
Why the Cloud, and Why AWS Genomics Specifically
Cloud bioinformatics solves three problems that local servers handle poorly for quality monitoring.
Elasticity. Sequencing output is bursty. A Nanopore flow cell can generate tens of gigabytes per hour, and an Illumina NovaSeq run can produce terabytes. Provisioning fixed hardware for peak load means paying for idle machines most of the time. Cloud queues absorb bursts and release compute afterward.
Proximity to the data. When basecalling and FASTQ generation happen in the cloud (Illumina DRAGEN on AWS, or ONT's cloud options), QC can start on partial data with no download step.
Shared, timestamped state. A monitoring system is only useful if results are durable and comparable over time. A managed time-series store plus object storage gives you that without maintaining a database server.
Within AWS genomics, the core services for this pattern are S3 for raw data, EventBridge for file-arrival events, Batch for containerized QC jobs, and CloudWatch for metrics and alarms. Amazon HealthOmics offers managed ready-to-run and custom workflows if you prefer not to manage compute yourself. The open-source ecosystem supports this directly. Flint, a metagenomic profiling pipeline built on Apache Spark, was designed to run on Amazon's Elastic MapReduce service and profile 1 million Illumina paired-end reads against a 170 GB collection of 43,552 bacterial genomes on 64 machines in 67 seconds, an order of magnitude faster than prior tools against a far larger reference set [2]. That result shows what the cloud's parallelism buys you when monitoring must keep pace with data generation.
Reference Architecture at a Glance
The system has five parts:
- Landing zone. An S3 bucket with a disciplined prefix scheme, for example
s3://genomics-prod/runs/{instrument}/{run_id}/. - Trigger. An EventBridge rule matching
s3:ObjectCreatedevents on the bucket. - QC jobs. Containerized tools (fastp, FastQC, samtools, mosdepth) run through AWS Batch or a Nextflow pipeline on Batch.
- Metric store. A CloudWatch custom namespace, or a JSON summary file written back to S3.
- Presentation and alerting. A CloudWatch dashboard with alarms, or a QuickSight dashboard for trend review.
The design principle behind step 5 deserves emphasis. Surveillance work in Uganda paired household-level data collection through structured Open Data Kit mobile questionnaires with integrated real-time dashboards and quality control, so field teams and analysts looked at the same live view of data completeness and data quality [3]. Your dashboard should serve the same two audiences: the person generating data, who needs to know if today's run is acceptable, and the analyst, who needs to know if last month's trend is trustworthy.
Step-by-Step Walkthrough
The following walkthrough builds the loop with concrete commands. Commands are shown for a Linux shell. Substitute your own bucket names and region.
Step 1: Define the QC Contract Before Writing Any Code
Write down, in a version-controlled file, which metrics you will compute, what instrument and assay they apply to, and what gate applies to each. A starter contract for paired-end Illumina data looks like this:
| Metric | Tool that computes it | Example gate (tune per assay) | Action on fail |
|---|---|---|---|
| Per-base quality (Q30 fraction) | fastp | At least 80 percent of bases at Q30 or above for 2x150 reads | Warn, investigate chemistry |
| Read length distribution | fastp or seqkit | Median within 10 percent of expected insert/read length | Fail if run yields wrong read length |
| Adapter contamination | fastp (trimmed fraction) | Less than 5 percent of reads requiring adapter trimming | Warn |
| Duplication rate | fastp or markdup | Below 20 percent for standard WGS libraries | Warn, check library complexity |
| Total reads per sample | fastp | Within the assay's minimum yield target | Fail if below minimum |
| Mapped read fraction | samtools flagstat | Above 90 percent to the expected reference | Fail, suspect contamination |
| Mean coverage | mosdepth | Above assay minimum, for example 30x for WGS | Fail, do not call variants |
| Contamination estimate | kraken2 or similar | Dominant organism matches expected sample type | Fail, quarantine sample |
The gates in the right column are placeholders to start calibration. The correct thresholds come from your own assay history, not from a generic standard. Collect two to four weeks of metrics on samples you already trust, then set gates at the edges of that observed distribution. Sequencing coverage requirements vary enormously by application, from shallow skim genomes to deep clinical assays, so your contract must reflect the assay, not a universal number.
Step 2: Create the Landing Zone
aws s3 mb s3://genomics-prod --region us-west-2
aws s3 mb s3://genomics-qc --region us-west-2
Structure the runs bucket so every event carries meaning:
s3://genomics-prod/runs/novaseq6000/2026-11-11_RUN42/SAMPLE_A/xxx_R1.fastq.gz
s3://genomics-prod/runs/novaseq6000/2026-11-11_RUN42/SAMPLE_A/xxx_R2.fastq.gz
Instrument, run identifier, and sample live in the path. This lets the trigger logic parse context from the key and lets the dashboard group metrics naturally.
Step 3: Wire the Trigger
Create an EventBridge rule that fires on object creation in the runs bucket. The rule invokes a small Lambda function whose only job is to look at the key, decide when a sample's file pair is complete (both R1 and R2 present, or the run's final report file for ONT data), and submit an AWS Batch job. Putting this completion logic in one small function prevents the classic failure of launching a QC job twice, once per mate.
Step 4: Run QC in a Container
Build one container with the tools from your contract. A minimal Dockerfile:
FROM biocontainers/biocontainers:v1.3.0
RUN apt-get update && apt-get install -y fastp
Or, for a production setup, pull maintained images from BioContainers and pin them by digest so the container cannot drift.
Test locally on your small dataset first:
fastp \
  -i test_R1.fastq.gz \
  -I test_R2.fastq.gz \
  -o trimmed_R1.fastq.gz \
  -O trimmed_R2.fastq.gz \
  -w 8 \
  -j fastp.json \
  -h fastp.html
Expected output ends with a summary similar to:
Read1 before filtering:
    total reads: 10000
    total bases: 1510.0k bp
Q20 bases: 1462.3k (96.8419%)
Q30 bases: 1408.5k (93.2774%)
Read1 after filtering:
    total reads: 9871
Filtering result:
    reads passed filter: 19742
    low quality reads: 247
The -j flag writes the same summary as JSON, which is what your pipeline will parse. Note that fastp uses single-dash flags. If you prefer a workflow engine, run the same logic through Nextflow with a parameters file, which keeps long argument lists out of the command line:
# params.yaml
input: "s3://genomics-prod/samplesheet.csv"
outdir: "s3://genomics-qc/results"
nextflow run nf-core/viralrecon -params-file params.yaml -profile testA good default for teams handling viral amplicon or metagenomic data is to reuse a maintained nf-core pipeline rather than writing your own from scratch, because the pipeline's QC stages and their outputs are already documented and tested.
Step 5: Aggregate and Normalize
Each QC job writes a single JSON summary to s3://genomics-qc/metrics/{run_id}/{sample}.json containing the metric values plus the container digests and tool versions used. This file is the atomic unit of your monitoring system. Then run MultiQC across the run directory to produce a human-readable rollup:
multiqc -o reports s3://genomics-qc/results/2026-11-11_RUN42/Expected output:
[2026-11-11 14:32:01] multiqc: Found 12 reports
[2026-11-11 14:32:04] multiqc: Report written to: reports/multiqc_report.html
Step 6: Publish Metrics and Set Alarms
Push each metric to CloudWatch as a custom metric in a namespace such as Genomics/QC, with dimensions for instrument and assay. Then create alarms on the metrics that gate the pipeline. Two alarms worth setting immediately:
- A per-run alarm when any sample fails a gate, routed to the lab channel
- A trend alarm when a metric drifts across a rolling window, for example median Q30 fraction declining run over run, which usually indicates a failing flow cell or an expired reagent lot before any single run looks broken
Step 7: Build the Dashboard
A CloudWatch dashboard with one widget per metric, filtered by instrument, answers the daily question in seconds: is this run normal? For richer exploration, load the JSON summaries into QuickSight and plot distributions over time. The design goal mirrors what MMonitor achieved for nanopore metagenomics: a web dashboard showing taxonomic composition over time, quality scores, and diversity indices, fed by a pipeline that anyone on the team can operate through a GUI or CLI rather than a hand-built script [4].
Step 8: Validate the Whole Loop
Before trusting the system, run a known-good sample and a deliberately corrupted sample (truncate a FASTQ mid-record, or swap in reads from the wrong organism) through the full path. Confirm the corrupted sample triggers the correct gate and the alarm reaches a human. An untested alarm is a hope, not a control.
Monitoring While the Sequencer Is Still Running
Nanopore sequencers emit data continuously, which changes the monitoring problem. Waiting for run completion wastes the technology's main advantage. Two patterns work well.
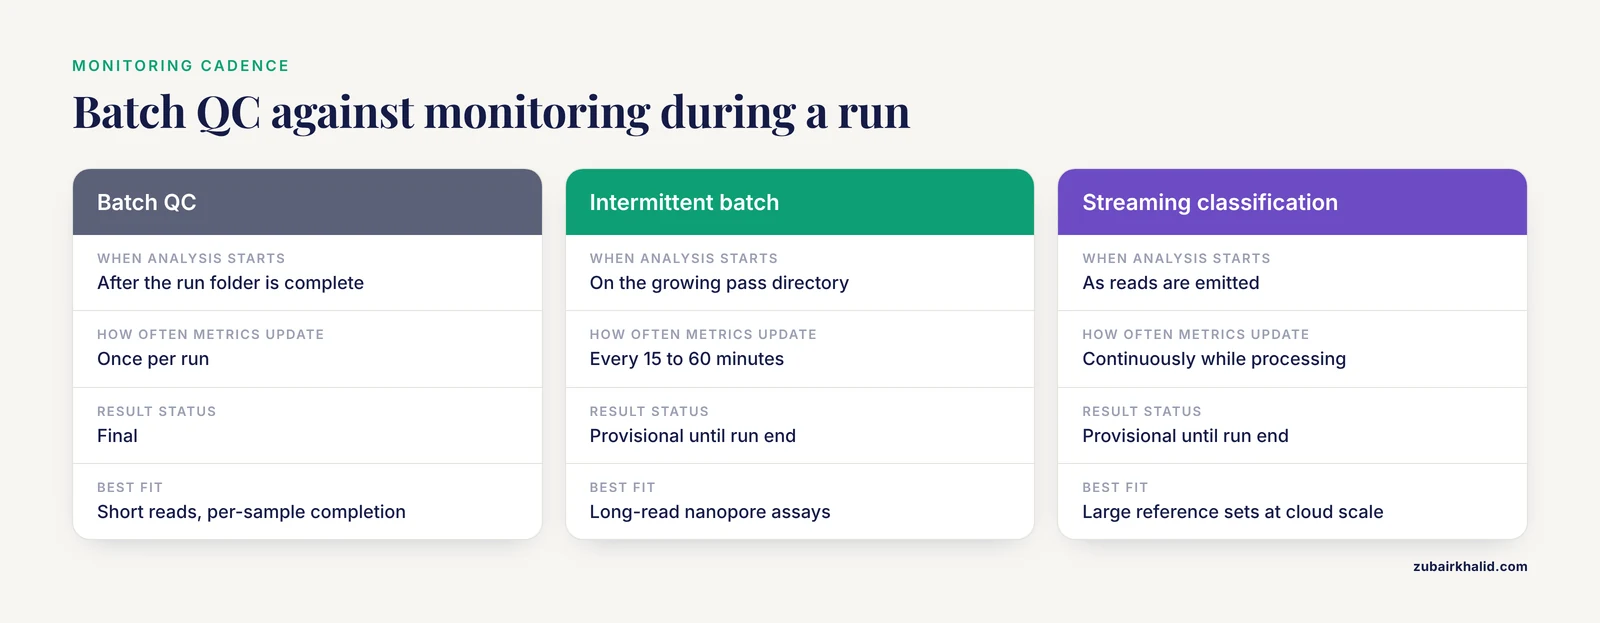
Intermittent batch monitoring. Every 15 to 60 minutes, monitor the growing pass directory, recompute metrics on new reads, and append them to the dashboard. MMonitor implements this pattern for metagenomic Oxford Nanopore data. Its pipelines ran on 16S rRNA gene sequencing data from three bioreactors to track gut microbial populations over time, and on whole-genome sequencing data to generate high-quality annotated metagenome-assembled genomes, with quality scores and composition displayed on the live dashboard [4]. The same cadence applies to any long-read assay.
Streaming classification. For high-throughput profiling against large reference sets, stream reads into a distributed engine rather than batching them. Flint's design, mapping reads against tens of thousands of reference genomes on Spark with results arriving while samples are still being processed, demonstrates the streaming approach at cloud scale [2].
If your monitoring decisions depend on results computed on partial data, mark them as provisional in the dashboard and recompute at run end. A variant call made at hour 3 of a flow cell can change by hour 48, and your dashboards should never pretend otherwise.
Case Studies From Surveillance Practice
Three published programs illustrate how the pieces combine under real constraints.
High-throughput clinical surveillance. The Arizona saliva program combined self-collected specimens, RT-PCR screening, and whole-genome sequencing at a scale of roughly 1.4 million tests, and monitored infection trends and lineage introductions in near real time [1]. Notably, the program detected three periods of S gene target failure on a commercial PCR assay and showed that this assay signal predicted viral genotype with a positive predictive value of 0.98 [1]. That is real-time quality monitoring in reverse: a cheap orthogonal signal (the PCR assay's target failure) acted as a QC and genotyping gate on the sequencing stream.
Minimal-infrastructure pipelines. A SARS-CoV-2 surveillance pipeline written in the Workflow Description Language processed FASTA and QC files from Ion Torrent sequencers, performed clade and variant assignment, integrated patient metadata, and stored results in a REDCap database, designed so that users with minimal informatics background could adapt it [5]. The lesson for monitoring is that the pipeline should emit structured QC and assignment outputs into a queryable store, not into files that only the pipeline author can interpret.
Honest accounting of failure. A Turkish hospital study sequenced 39 RT-PCR-positive respiratory samples with an amplicon-based Oxford Nanopore method and obtained only 22 high-quality sequences [6]. Roughly 44 percent of attempted samples failed QC. Programs that report their QC failure rates openly make it possible to calibrate expectations. A Tunisian national laboratory, sequencing 669 of 1,020 positive nasopharyngeal swabs over four years, tracked sequencing coverage and turnaround time as headline metrics, reporting a median governorate-level sequencing coverage among positives of 60.0 percent and a correlation of 0.992 between the regional share of positives and the share of sequences, indicating near-proportional sampling [7]. Those two metrics, biological yield and representativeness, belong on any surveillance dashboard alongside read-level QC.
Pipeline frameworks increasingly expose progress directly to the scientist. ChromAcS, a graphical end-to-end pipeline for ATAC-seq, automates quality control through peak calling and annotation while providing real-time progress monitoring during execution [8]. The same principle applies to cloud pipelines: job state, per-stage QC outputs, and failures should be visible live, not reconstructed afterward from logs.
Common Mistakes and Limitations
These are the errors that most often break real-time genomic data quality monitoring systems in practice.
- Monitoring only at run completion. If QC jobs start only after a run folder is complete, a catastrophic failure is discovered a full run cycle late. Trigger on partial data for long reads and on per-sample file completion for short reads.
- Borrowing thresholds from another lab. A Q30 gate calibrated for a NovaSeq PCR-free library will misfire on an amplicon assay. Derive gates from your own trusted historical runs, per instrument and per assay, as described in step 1.
- Treating adapter trimming as a quality fix rather than a quality signal. High adapter content in the raw data is a warning about library preparation. Monitoring only post-trim metrics hides the root cause. Log both raw and post-trim values. Systematic studies of sequencing-based QC workflows show that individual library preparation steps can bias the output before the sequencer ever runs, as demonstrated for single molecule real-time sequencing of adeno-associated viral vector genomes, where protocol changes altered data quality substantially [9]. Monitor upstream steps, not just sequencing output.
- Letting dashboard metrics drift from pipeline reality. If the pipeline changes a trimming parameter but the dashboard metric definitions do not change with it, trends become meaningless across the change. Version both together, and annotate dashboard timelines when a version bump lands.
- Ignoring metadata join failures. A surveillance pipeline that cannot join sequences to patient or sample metadata produces QC-clean data that still cannot be interpreted [5]. Monitor the metadata join rate as a first-class metric. A run with 100 percent QC pass and 40 percent missing metadata is a failed run for surveillance purposes.
- No end-to-end test data. Without a known-good and known-bad test sample cycled through the pipeline weekly, silent failures (a misconfigured IAM role, a full registry, an expired token) go undetected until the day you need the system most.
- Confusing depth with coverage breadth. A sample can have a healthy mean depth and still fail because 15 percent of the target region has zero coverage. Track both, and track them per target where relevant.
- Cost surprises from chatty monitoring. Per-file Lambda invocations on a bucket receiving millions of small objects, plus CloudWatch custom metrics at high cardinality, add up. Aggregate at the sample or run level, not the file level, and set billing alarms on the QC account itself.
- Provisional results presented as final. Any metric computed while sequencing is ongoing can change. Label it, and recompute at completion.
- Believing QC is the hard part. Producing a high-quality genome is necessary but not sufficient. The Arizona program's value came from connecting genomes to case trends and assay signals over three years [1]. Budget effort for the analytical and reporting layers, not just the QC layer.
One broader limitation applies to all of this. Automated quality gates measure data properties, not biological truth, and any clinical or production decision ultimately requires expert human judgment on the specific case.
Practical Tips
- Emit every metric twice, once as a number and once as a verdict. Store
q30_fraction = 0.912andq30_gate = pass. Verdicts make dashboards scannable. Numbers make re-gating possible without recomputation. - Pin everything. Container digests, reference genome versions, and tool versions belong in the metrics JSON. When a metric shifts, the first question is always what changed.
- Keep the QC container boring. One container, one purpose, tested separately. Complex QC images fail to rebuild at the worst times.
- Use spot instances for QC jobs with retry logic. QC is embarrassingly parallel and restartable, which makes it ideal for interrupted capacity at a large discount.
- Write alarms for the absence of data, not just bad data. If a normally active instrument produces no files for 12 hours, that silence is your earliest and cheapest quality signal. Multi-species monitoring work in livestock research reached the same conclusion, where data completeness itself was a headline outcome of the monitoring system [10].
- Make the dashboard the single source of truth. If someone builds a spreadsheet next to it, the two will diverge within a month.
- Plan for assay evolution. When a new variant or panel changes expected coverage patterns, your gates will fire falsely for a few runs. Adjust gates deliberately, with a note in the change log, rather than silencing alarms.
Where does this field go next? Reviews of artificial intelligence in antimicrobial resistance management describe near real-time monitoring of resistance patterns and early outbreak detection driven by machine learning over clinical and genomic data [11]. Those models are only as trustworthy as the quality signals feeding them, which is exactly why the monitoring loop described here is the foundation layer for any downstream AI application in genomics.
Frequently Asked Questions
What does real-time genomic data quality monitoring mean in practice?
It means computing quality metrics automatically as sequencing data arrives, publishing them to a shared dashboard, and triggering alerts when values cross defined gates, instead of reviewing QC reports hours or days after the run.
Do I need AWS for cloud bioinformatics?
No. The pattern shown here (object storage, event triggers, containerized batch jobs, metrics, dashboards) maps directly onto Google Cloud and Azure services, though the specific command examples use AWS genomics services.
Which QC metrics should I track first?
Start with per-base quality (Q30 fraction), total reads per sample, adapter contamination, duplication rate, mapped read fraction, and mean depth and breadth of coverage. Add assay-specific gates such as contamination estimates once the basics are stable.
How fast should QC results arrive after a run finishes?
For per-sample short-read QC, minutes are achievable with event-driven triggers, and that is fast enough to catch problems before downstream processing. Run-level rollups can lag by the length of the longest sample job.
Can I monitor quality while the sequencer is still running?
Yes. Long-read platforms produce data continuously, so recompute metrics on newly emitted reads every 15 to 60 minutes, mark those results as provisional, and recompute at run completion.
How do I set QC thresholds without inventing numbers?
Collect two to four weeks of metrics from runs you already consider good, set gates at the edges of that observed distribution separately for each instrument and assay, and revise them only through a documented change process.
What is the biggest cost trap in aws genomics monitoring setups?
High-frequency triggers and high-cardinality custom metrics. Aggregate monitoring at the sample or run level rather than per file, use spot capacity with retries for QC compute, and set a billing alarm on the account.
How does real-time QC differ from the final QC report in a publication?
Real-time QC is an operational control that gates processing and alerts people during or immediately after data generation, while the published QC report is a retrospective, curated summary of the same underlying metrics.
Sources
- Large-Scale Saliva-Based Clinical Surveillance Enables Real Time SARS-CoV-2 Outbreak Detection and Genomic Tracking (Arizona, 2020-2023).
- Large scale microbiome profiling in the cloud.
- Village-level surveillance of neonatal disease with integrated real-time dashboards and quality-control in Uganda.
- MMonitor for real-time monitoring of microbial communities using long reads.
- From Bench to Insight: Rapid Pathogen Genomic Surveillance Workflow for SARS-CoV-2 and Emerging Pathogens.
- [[Genomic Characterization of SARS-CoV-2 by Next-Generation Sequencing Analysis].](https://pubmed.ncbi.nlm.nih.gov/42583851/)
- Genomic surveillance of SARS-CoV-2 in Tunisia during the omicron era: insights from the national influenza & other respiratory viruses laboratory.
- ChromAcS: an automated and flexible GUI for end-to-end reproducible ATAC-seq analysis across multiple species.
- Optimizing single molecule, real-time sequencing for enhanced characterization of adeno-associated viral vector genomes.
- RAMSMART: a low-invasive system for real-time automated multi-species monitoring of livestock activity in research trials.
- Artificial intelligence in combating challenges in antimicrobial resistance: a narrative review.