Coloring AlphaFold structures by pLDDT in PyMOL: A Workflow
By Dr. Zubair Khalid, DVM, MS, PhD ·

By the end of this article you will be able to load any AlphaFold predicted structure into PyMOL, color it by pLDDT confidence using the same four-color palette used on the AlphaFold Protein Structure Database website, selectively hide or trim low-confidence regions, and export a ray-traced, publication-ready image. The workflow works identically for models you download from the AlphaFold database and for models you generate yourself with the AlphaFold Server.
To follow along you need:
- PyMOL version 2.x or later. The open-source build installed through conda or Homebrew and the licensed Schrödinger build both support every command in this article.
- An AlphaFold coordinate file in mmCIF or PDB format. This article uses a model from the AlphaFold Protein Structure Database as the running example.
- Optionally, a plain text file to save the reusable coloring script provided near the end of the walkthrough.
No plugins, no web tools, and no scripting beyond a few lines of PyMOL command language are required.
What pLDDT Is and Why It Lives in the B-Factor Column
pLDDT stands for predicted local distance difference test. It is a per-residue confidence score between 0 and 100 that estimates how closely the predicted position of each residue agrees with an experimental structure of the same protein, measured over the residues surrounding it. A pLDDT of 95 means the model has very high confidence in that residue's local geometry. A pLDDT of 40 means that region of the model is essentially a low-resolution guess, and in many cases corresponds to a genuinely disordered segment of the protein.
When AlphaFold writes out a coordinate file, it stores the pLDDT value of each residue in the B-factor column of that file. The B-factor column, in a crystallographic PDB file, originally recorded the temperature factor, a measure of atomic displacement. AlphaFold reuses this column because almost every molecular graphics program, PyMOL included, already knows how to read and select on it. This single fact is the key to the whole workflow. You never need to parse the file or write a conversion script. You simply treat pLDDT as the B-factor.
Two consequences follow from this design, and both matter in practice:
- Every atom in a given residue carries the same value, because pLDDT is defined per residue, not per atom. A selection like
b > 90therefore grabs complete residues, which is exactly what you want. - The per-residue-pair confidence metric, predicted aligned error (PAE), is not in the coordinate file at all. AlphaFold ships PAE in a separate JSON file that sits next to the coordinates. You cannot color a PyMOL object by PAE using the B-factor trick. This distinction causes more confusion than almost anything else in AlphaFold visualization, and it returns in the common mistakes section below.
The AlphaFold documentation and the AlphaFold Protein Structure Database interface use four confidence bins, each with a fixed color. The database colors structures this way so that any two figures made by any two people are directly comparable. Reproducing those bins in PyMOL gives your figures the same visual language.
| pLDDT range | Interpretation | Hex color | RGB (0 to 1) | PyMOL color name used here |
|---|---|---|---|---|
| greater than 90 | Very high confidence, side chains usually reliable | #0053D6 | 0.000, 0.325, 0.839 | af_dark_blue |
| greater than 70 up to 90 | Confident, backbone reliable | #65CBF3 | 0.396, 0.796, 0.953 | af_light_blue |
| greater than 50 up to 70 | Low confidence | #FFDB13 | 1.000, 0.859, 0.075 | af_yellow |
| 50 or less | Very low confidence, often disordered | #FF7D45 | 1.000, 0.490, 0.271 | af_orange |
These four bins and their colors are the convention used by the AlphaFold Protein Structure Database, which is maintained as a collaboration between EMBL-EBI and Google DeepMind. Using the same convention in your own figures means any reader who has ever looked at an AlphaFold entry on the web immediately understands your coloring.
Getting an AlphaFold Structure
There are two common routes to a model file, and both end the same way, with a .cif or .pdb file on your local disk.
Route 1, the AlphaFold Protein Structure Database. Go to alphafold.ebi.ac.uk, search for your protein by name or by its UniProt accession (for example P00533, the epidermal growth factor receptor), open the entry, and download the coordinates. The database offers mmCIF as the primary format and a PDB-format download as well. Files follow the naming pattern AF-P00533-F1-model_v4.cif, where the accession identifies the protein, F1 identifies the first predicted chain, and v4 identifies the model version. Model versions matter. Different versions were produced by different network weights, so always record which version a figure came from.
Route 2, the AlphaFold Server. The AlphaFold Server, at alphafoldserver.com, lets you submit a sequence or a complex specification and receive predicted coordinates together with confidence files. The server is free to use, but its terms of use restrict the outputs to non-commercial purposes, so read the current terms before using server output in a commercial context. Server output for protein chains stores pLDDT in the B-factor column exactly as the database models do, so the coloring workflow below is unchanged. One difference deserves attention. Server models may contain ligands, ions, and modified residues. The confidence values stored for those non-polymer entities are not pLDDT in the same sense, so when you color a server model you should restrict your selections to the polymer, as shown in Step 4.
A note on fetching inside PyMOL. Some recent PyMOL builds can retrieve computed structure models hosted at the RCSB Protein Data Bank, but the identifier conventions differ between RCSB and the AlphaFold database, and fetch behavior varies between builds. The reliable, reproducible route for figures you may need to regenerate a year from now is to download the file once, store it with your project, and load it locally. That is the approach used here.
The Step-by-Step Workflow
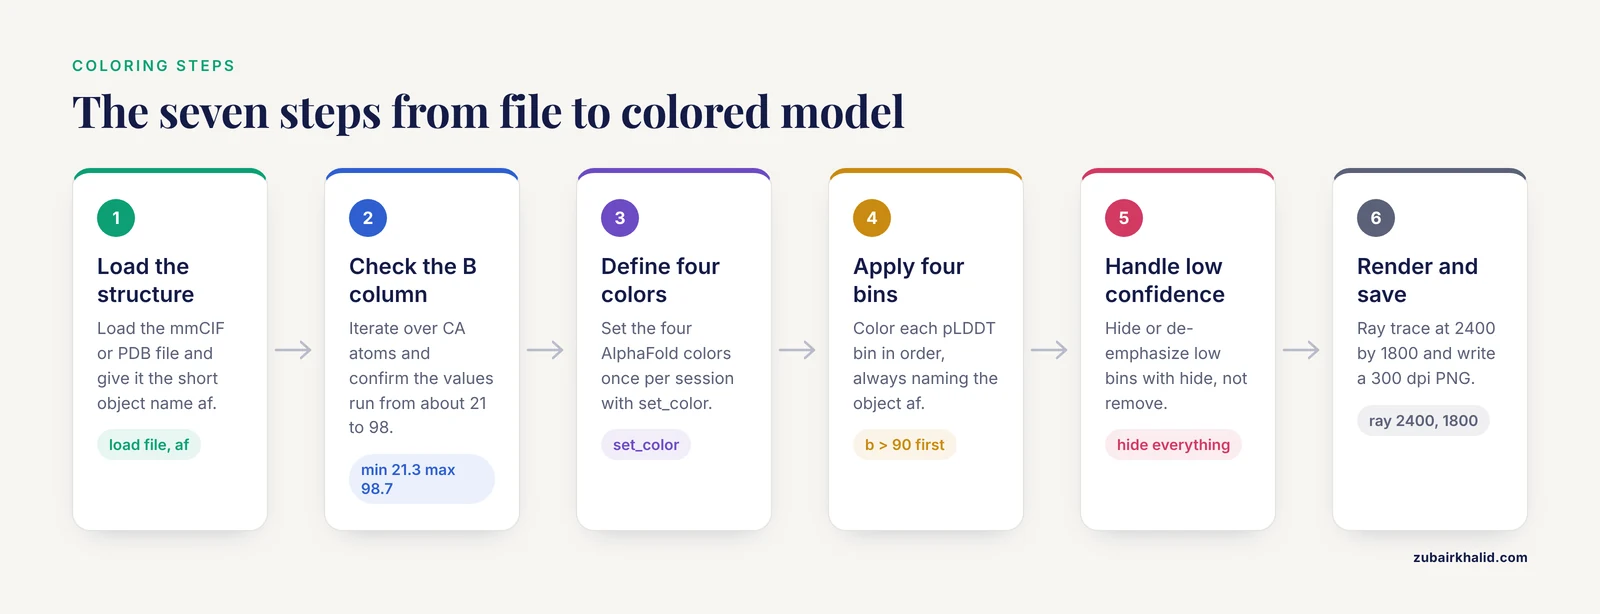
This walkthrough colors the human epidermal growth factor receptor kinase domain model AF-P00533-F1-model_v4.cif. Substitute your own file throughout. Every command goes at the PyMOL command line, the text input field at the top of the window, or into a .pml script file.
Step 1. Load the structure
load AF-P00533-F1-model_v4.cif, af
as cartoon
The second argument, af, assigns a short object name so that later commands can target this structure explicitly. PyMOL confirms the load on the console:
Load: AF-P00533-F1-model_v4.cif.Without a short name, the object would inherit the full filename, which is legal but awkward to type in every selection. If you already loaded a file without a name, rename it:
set_name AF-P00533-F1-model_v4, afThen display the structure as a cartoon. Cartoon representation is the right starting point for confidence coloring because the four-color palette reads clearly on a smooth ribbon, and you can layer sticks onto confident residues later.
Step 2. Verify that the B-factor column actually holds pLDDT
Before coloring, confirm the file is an AlphaFold model and not something else that happens to have B-factors. Run this block:
python
from pymol import stored
stored.blist = []
cmd.iterate("af and name CA", "stored.blist.append(b)")
import collections
buckets = collections.Counter()
for x in stored.blist:
    if x > 90:
        buckets[">90"] += 1
    elif x > 70:
        buckets["70-90"] += 1
    elif x > 50:
        buckets["50-70"] += 1
    else:
        buckets["<=50"] += 1
print("CA atoms:", len(stored.blist))
print("pLDDT bins:", dict(buckets))
print("min:", min(stored.blist), "max:", max(stored.blist))
python end
This iterates over the alpha carbons, which is enough because all atoms of a residue share one pLDDT value, and prints a summary. Realistic output for this model looks like:
CA atoms: 1211
pLDDT bins: {'>90': 712, '70-90': 301, '50-70': 118, '<=50': 80}
min: 21.3 max: 98.7
Three checks pass if the file is a genuine AlphaFold model. The atom count roughly matches the length of the protein sequence. The maximum is below 100, since pLDDT never reaches 100 in practice. The minimum is well under 50 for most proteins, because almost every multidomain or partially disordered protein contains some low-confidence segment.
If instead you see a narrow range of values clustered around 20 to 40, or values that look like crystallographic B-factors in the tens or hundreds, you may have loaded an experimental structure or a file from a pipeline that overwrote the B column. Stop and check the file provenance before making figures.
For a faster but cruder sanity check, you can simply type:
spectrum b, rainbowAlphaFold models colored this way show a strong blue core with red fringes at the termini and in loops, because the spectrum maps high B-factors toward the red end. Never publish this coloring. It is only a quick visual confirmation that the B column is populated.
Step 3. Define the four AlphaFold palette colors
PyMOL does not ship these four colors under their AlphaFold names, so define them once per session:
set_color af_dark_blue,  [0.000, 0.325, 0.839]
set_color af_light_blue, [0.396, 0.796, 0.953]
set_color af_yellow,     [1.000, 0.859, 0.075]
set_color af_orange,     [1.000, 0.490, 0.271]
The values are the hex codes from the table above divided by 255. If you mistype a color name later, PyMOL prints an error of the form:
Color: unknown color 'af_light_blue'.The fix is to re-run the set_color line with the exact spelling, or to save the definitions in the reusable script in Step 7 so they always load together. Defined colors persist for the session but not between sessions, which is another reason the script file is worth making.
Step 4. Apply the four-color pLDDT coloring
Run the four bin assignments in order:
color af_dark_blue,  af and b > 90
color af_light_blue, af and b > 70 and b <= 90
color af_yellow,     af and b > 50 and b <= 70
color af_orange,     af and b <= 50
Four points about this block deserve explanation.
The object name in every selection. Including af restricts the coloring to your loaded model. If you leave it out while another structure is open, you will recolor that structure too, which is one of the most common silent failures in PyMOL confidence coloring. The command runs without any error message, so you may not notice until you look at the other object.
The bin boundaries. The bins are strict inequalities matching the database convention. A residue with pLDDT exactly 90.0 falls in the light blue bin, not the dark blue one. Using b >= 90 instead would shift boundary residues by one bin and produce figures that disagree with the web interface.
Per-residue behavior. Because every atom of a residue carries the same pLDDT, these atom-level selections color whole residues uniformly. There is no risk of half a residue turning dark blue.
Polymer restriction for server models. If your model comes from the AlphaFold Server and contains ligands or ions, prefix each selection with af and polymer and b .... That prevents non-polymer entities from being colored by confidence values that are not pLDDT.
When the commands finish, the structure on screen shows a dark blue folded core, light blue flanking regions, yellow loops and termini, and orange patches where the model has essentially no reliable structure. Compare your image to the same protein on the AlphaFold database website. If your bins match the website, the palette is correct.
Step 5. Handle the low-confidence regions deliberately
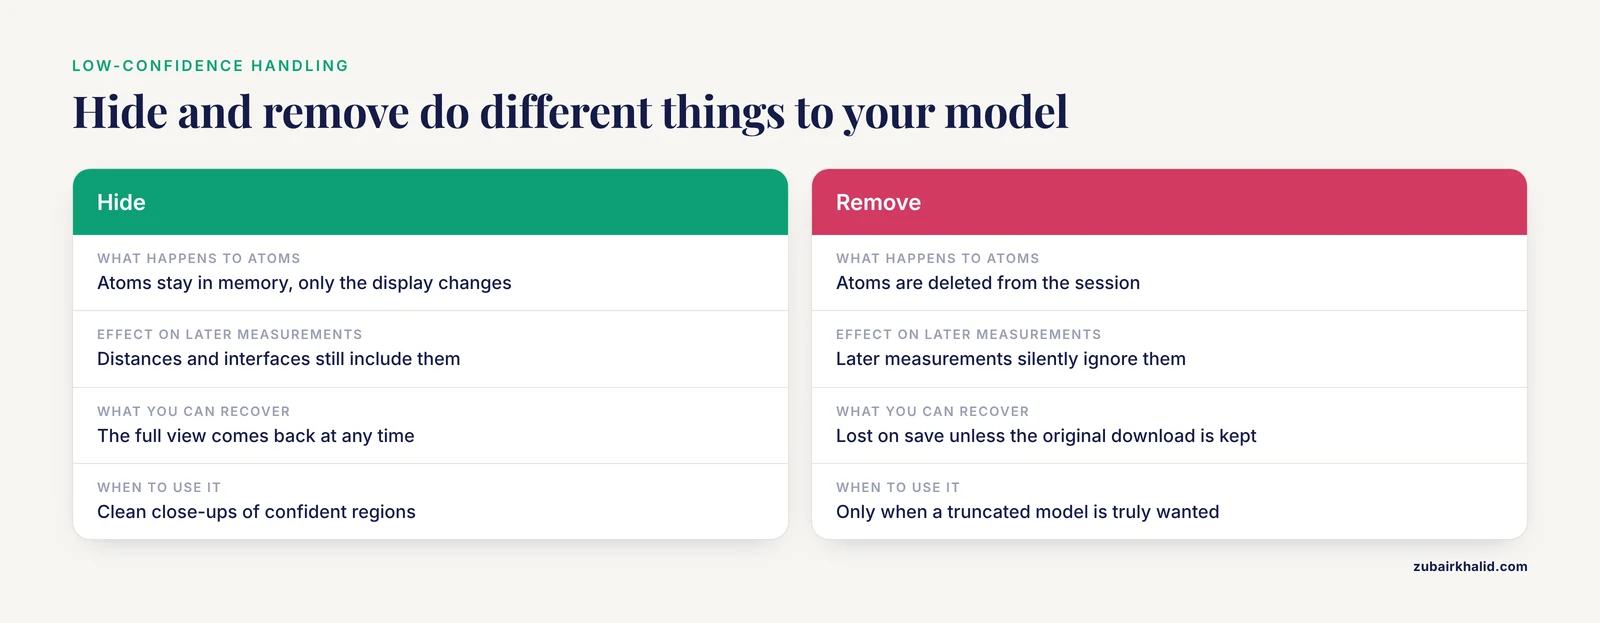
Two philosophies exist, and the right one depends on the figure.
Show everything, colored. This is the database default and the honest presentation. The orange and yellow regions tell the reader where the model stops being trustworthy. For most figures, including methods figures and repository comparisons, this is the better choice.
Trim or de-emphasize the low-confidence parts. For a close-up of a binding site or an active site, low-confidence tails add clutter. You have three non-destructive options.
Hide everything below a threshold:
hide everything, af and b <= 50Keep the backbone trace but remove low-confidence side chains, which is usually the cleanest compromise:
as cartoon
show sticks, af and b > 90 and not name c+n+o
hide sticks, af and b <= 90 and not name c+n+o
The not name c+n+o clause excludes backbone atoms so that side-chain sticks appear only on dark blue residues.
Fade low-confidence regions instead of hiding them:
set cartoon_transparency, 0.7cartoon_transparency applies to the whole object, so fading a subset requires either splitting the object or accepting a uniform fade. For selective fading, the hide-and-show approach above is more controllable.
One warning. The destructive alternative:
remove af and b <= 50deletes those atoms from the session entirely. Anything you compute afterward, such as a distance or an interface measurement, silently ignores them, and if you then save the trimmed file you have lost the full model on disk unless you kept the original download. For figures, hide does the same visual job with no such risk. Reserve remove for cases where you truly want a truncated model, and always keep the untouched original file.
Step 6. Set up the render for a publication-ready figure
From an AlphaFold PDB or CIF file to a publication-ready figure is mostly a matter of a dozen settings. A sensible baseline:
bg white
set ray_opaque_background, off
set cartoon_smooth_loops, on
set cartoon_side_chain_helper, on
set antialias, 2
set ray_shadows, off
ray 2400, 1800
png EGFR_plddt.png, dpi=300
What each line does:
bg whitegives a white viewport so the light blue bin remains visible. On the default black background, the light blue and yellow bins lose contrast.ray_opaque_background, offmakes the exported PNG background transparent, so the figure drops onto a white or colored page without a visible box.cartoon_smooth_loops, onsmooths loop geometry, which matters because low-confidence loops are the regions readers look at.cartoon_side_chain_helper, onthins the cartoon behind displayed sticks so side chains stay legible.antialias, 2andray_shadows, offremove jaggies and the default shadowing, which otherwise muddies the pale yellow bin.ray 2400, 1800performs the high-quality software render at a large pixel size. The viewport display is only a preview. Always publish from a ray-traced image.png EGFR_plddt.png, dpi=300writes the file with a 300 dots per inch tag, which most journals require.
For a composite figure with several panels, color and render each panel separately and assemble them in a vector editor such as Inkscape or Illustrator. Build the pLDDT color legend there as four small rectangles filled with the hex codes from the table, labeled 90, 70, 50, and 50 or less. PyMOL does not generate a confidence legend, so the legend is a manual step, and using the exact hex codes keeps it consistent with the structure coloring.
Step 7. Save the reusable script
Put the whole recipe in a file named af_plddt.pml:
# af_plddt.pml
# Usage: load your model, rename it "af", then: @af_plddt.pml
set_color af_dark_blue,  [0.000, 0.325, 0.839]
set_color af_light_blue, [0.396, 0.796, 0.953]
set_color af_yellow,     [1.000, 0.859, 0.075]
set_color af_orange,     [1.000, 0.490, 0.271]
color af_dark_blue,  af and polymer and b > 90
color af_light_blue, af and polymer and b > 70 and b <= 90
color af_yellow,     af and polymer and b > 50 and b <= 70
color af_orange,     af and polymer and b <= 50
as cartoon
bg white
Run it with:
@af_plddt.pmlNow any AlphaFold model is one load command and one script call away from correctly colored. Keep the script next to your figure-making notes so collaborators get identical coloring.
Key Parameters at a Glance
| Parameter or command | What it controls | Typical value or usage | Watch out for |
|---|---|---|---|
spectrum b | Continuous color ramp over B-factors | Quick sanity check only | Auto-scales to the data range, so colors are not comparable between structures |
spectrum b, ..., minimum=50, maximum=100 | Continuous ramp with fixed scale | Use fixed limits when a gradient look is wanted | Still interpolates between colors, so it does not reproduce the official four bins |
b > 90 selection | Bin assignment | Four discrete color commands | Boundary values fall in the upper bin only with strict inequalities as written |
set_color | Defines a named RGB color | AlphaFold hex codes divided by 255 | Colors exist only for the session unless saved in a script |
hide everything, b <= 50 | Non-destructive trimming | Clean close-ups of confident regions | Object stays in memory, save the session if you want the view back |
remove b <= 50 | Destructive trimming | Only when you want a truncated model | Deletes atoms, breaks later measurements, loses data on save |
ray W, H then png file, dpi=300 | Final image | 2400 by 1800 at 300 dpi is a solid default | Viewport screenshots are not publication quality |
polymer keyword | Restricts selections to protein or nucleic polymer | Required for AlphaFold Server models with ligands | Non-polymer entities carry confidence values that are not pLDDT |
Tips for Better AlphaFold Figures in PyMOL
A few refinements separate adequate figures from good ones.
Fix the scale across panels. If a figure contains several AlphaFold models, color every one with the same script and the same four bins. Never let spectrum b auto-scale per structure, because the same yellow would mean different things in adjacent panels. The discrete bin approach sidesteps the problem entirely, which is one reason it is the standard.
Orient once, reuse everywhere. Set your view on the first model, then apply it to the others with get_view and set_view. Save the view matrix in your session notes. Panels with inconsistent orientations read as careless even when the coloring is perfect.
Use confidence to guide what you emphasize. The bins are not just decoration. Side chains in dark blue regions are usually placed well enough to discuss hydrogen bonds and salt bridges in a figure legend. Residues in yellow or orange regions should not anchor a structural claim, no matter how convenient the model looks. State in the legend that coloring shows per-residue pLDDT and give the bin boundaries.
Check for version mismatches. If you compare a database model with a server prediction of the same protein, note the model version in the caption. Different versions can differ meaningfully in the low-confidence regions, which are exactly the regions the coloring highlights.
Pair pLDDT coloring with PAE when it matters. For domain arrangements, oligomer interfaces, or anything involving relative positioning of two regions, pLDDT alone is not the full story. PAE, from the companion JSON file, describes how confidently the relative positions of residue pairs were predicted. You cannot render PAE directly in PyMOL, but you can open the JSON, inspect the relevant block of the matrix, and describe the result in your legend. Many papers show a PAE heatmap panel next to the pLDDT-colored structure for precisely this reason.
Common Mistakes and Limitations
These are the failures that show up repeatedly when people first color AlphaFold models in PyMOL, with the fix for each.
Coloring by PAE or expecting PAE in the coordinate file. The single most common conceptual error. pLDDT is in the B-factor column and colors one residue at a time. PAE is per residue pair, lives in a separate JSON file, and cannot be applied with spectrum b. If you tried to color and got a uniform or nonsensical result, check whether you actually had PAE data in mind.
Letting spectrum auto-scale. spectrum b with no arguments maps the minimum B-factor in your selection to one end of the palette and the maximum to the other. Two models with different confidence distributions then get different color scales, and panels within one figure become incomparable. Use the four discrete color commands, or if you prefer a gradient, pass explicit minimum=50, maximum=100.
Using remove when hide would do. As described in Step 5, remove b <= 50 is destructive. The classic accident is trimming a model, saving it, and later wondering why the sequence in the file is shorter than the UniProt entry. Hide for display, remove only with intent, and keep the original file untouched.
Losing colors on export. Colors are session properties, not file properties. If you save the model with save mymodel.pdb and reopen it in another viewer, the coloring is gone, because the PDB format has no per-atom color record in the form PyMOL writes. To preserve a colored view, save the PyMOL session with save mysession.pse, or export a rendered PNG. To share colored coordinates with a colleague, save the session file, since they can open a .pse with the free PyMOL build.
Assuming the model contains waters, hydrogens, or ligands. AlphaFold database models contain neither hydrogens nor waters, and no ligands. If you try to measure a hydrogen bond to a cofactor and find no cofactor, that is the reason, not a PyMOL bug. AlphaFold Server output can include some ligands and ions, but with different confidence semantics as noted in Step 4.
Reading pLDDT as a guarantee of accuracy. pLDDT is a self-estimate from the network, not a comparison against experiment. High pLDDT says the model is internally confident and, empirically, backbone geometry in the dark blue bin is usually close to experimental structures. It does not say the conformation is the biologically active one. Proteins with multiple states, large conformational changes, or membrane environments can be confidently wrong in specific regions. Where a structural claim matters, validate against experimental data or at minimum acknowledge the prediction in the text.
Interpreting low pLDDT as an error. Very low pLDDT frequently means the region is intrinsically disordered, and the network is honestly reporting that no single fixed structure exists. An orange tail is often a correct statement about the biology, not a defect in the model. This is why showing the orange regions, rather than deleting them, is usually the more informative choice.
Recoloring everything because of a missing object name. Omitting af from a color command applies it to all open objects, including an experimental structure you had carefully colored for the adjacent panel. PyMOL gives no warning. The habit of always naming the object in confidence selections costs two words and prevents this.
Judging the figure from the viewport. The on-screen OpenGL view is a preview with different lighting and quality than the final render. Figures drawn from screenshots look flat and aliased in print. Always finish with ray and png.
Forgetting that values were overwritten. Some processing pipelines and older tools write their own annotations into the B-factor column. If you receive a "predicted" model from a collaborator and the B-column sanity check in Step 2 fails, ask where the file came from before trusting any coloring.
Frequently Asked Questions
Where is pLDDT stored in an AlphaFold file?
In the B-factor column, for every atom. Because the value is per residue, all atoms of one residue share the same number, and selections like b > 90 act on whole residues.
Does PyMOL have a built-in AlphaFold color scheme?
No standard PyMOL release ships the four AlphaFold confidence colors as a ready-made scheme, so you define them with set_color and apply them with four color commands, as shown in Steps 3 and 4. The script in Step 7 makes this a one-line operation per session.
Can I color a structure by PAE in PyMOL?
Not with the B-factor method. PAE is a residue-pair matrix stored in a separate JSON file, not in the coordinate file, so PyMOL has nothing to select on. Inspect the JSON separately or show a PAE heatmap in a separate panel of your figure.
Why do my colors disappear when I save a PDB file?
PDB format files do not carry the PyMOL coloring. Save a PyMOL session with save filename.pse to keep colors, or export a ray-traced PNG for the figure itself.
How do I hide low-confidence side chains but keep the backbone?
Display the cartoon for the whole model and show sticks only where confidence is high, for example show sticks, af and b > 90 and not name c+n+o. The backbone stays visible as a cartoon while uncertain side chains never appear.
Can I fetch AlphaFold models directly inside PyMOL?
Some recent builds can retrieve computed structure models, but identifier conventions and support vary, so the dependable route is to download the mmCIF or PDB file from the AlphaFold database or the AlphaFold Server and load it locally with load.
Do the pLDDT thresholds apply to AlphaFold 3 and AlphaFold Server output?
Yes for protein chains. AlphaFold Server models store pLDDT in the B-factor column the same way, and the four bins mean the same thing. Restrict your selections with polymer when the model contains ligands or ions, because those entities carry different confidence values in the same column.
What pLDDT cutoff should I use before trusting a model?
There is no single universal cutoff. The conventional reading is that above 90 side chains are usually reliable, 70 to 90 supports backbone-level claims, 50 to 70 deserves caution, and below 50 should not support a structural claim at all. Choose the threshold that matches the claim your figure makes and say so in the legend.