How to Overlay AlphaFold and Experimental Structures in PyMOL
By Dr. Zubair Khalid, DVM, MS, PhD ·

By the end of this guide you will be able to load an AlphaFold database model and a matching experimental structure into PyMOL, superpose them into one coordinate frame, read the alignment statistics, color each structure by confidence and by local deviation, and export a publication-quality overlay figure. You need PyMOL (version 2.5 or newer for direct AlphaFold fetching), an internet connection for the first download, a UniProt accession such as P62979, and a four-character PDB ID such as 1UBQ. Everything runs on a standard laptop, and every command below is copy-paste ready.
Why Overlay an AlphaFold Model on an Experimental Structure
The AlphaFold database, hosted by EMBL-EBI together with Google DeepMind, provides predicted 3D structures for most UniProt protein sequences. The Protein Data Bank (PDB), managed by the RCSB and worldwide partners, holds structures determined by X-ray crystallography, cryo-electron microscopy, and NMR. Both describe the same protein, but they are different kinds of objects. The predicted model is a computational hypothesis about the average fold in isolation. The experimental structure is a physical measurement of one frozen state, shaped by crystal packing, bound ligands, pH, and temperature.
Overlaying the two answers practical questions that neither file answers alone:
- Does the prediction agree with experiment in the regions I care about, such as an active site or a mutation site?
- Where do they differ, and is that difference disorder, a different conformational state, or a prediction error?
- Is the model good enough to trust for planning point mutations, designing a truncation, or interpreting a disease variant?
- Which parts of the experimental structure were too flexible to see, and does the model fill those gaps plausibly?
The comparison is also a standard figure in structural papers and grant applications. A reviewer who sees an AlphaFold model rendered next to a crystal structure, colored by per-residue deviation, can judge your modeling assumptions in seconds.
What You Need Before You Start
PyMOL. Two builds are common. Schrödinger distributes the reference implementation, free for educational use, from pymol.org. The fully open-source build installs in one line with conda or mamba:
conda install -c conda-forge pymol-open-sourceLaunch it by typing pymol in a terminal or by opening the graphical application. Version 2.5 or newer matters because the fetch command gained direct AlphaFold database support in that release, per the PyMOL release documentation. Older versions still work with the manual download method shown in Step 2.
Identifiers. A UniProt accession (a stable six-character code such as P62979 that names one protein sequence) and a PDB ID (a four-character code such as 1UBQ that names one experimental structure). You can find the accession by searching UniProt for a gene or protein name, and the PDB ID either from that UniProt entry's cross-references or by searching rcsb.org.
A model for proteins the database does not cover. If your protein has no AlphaFold database entry, you can generate a prediction with the AlphaFold Server, the free web service from Google DeepMind, or with a local AlphaFold installation. The output mmCIF loads into PyMOL exactly like a database model, as shown in Step 2.
Core Concepts: pLDDT, RMSD, and Residue Numbering
Three ideas explain almost every number you will see in this workflow.
Superposition means placing two structures in the same coordinate frame using a rigid-body rotation and translation. No bending, no stretching. Every atom of the mobile structure moves together, so any residual distance between paired atoms reflects a real shape difference.
C-alpha atoms (CA) are the central carbon of each amino acid. Structural biologists almost always quantify overlay quality on CA or backbone atoms, because side-chain rotamers add noise that says little about fold agreement.
RMSD (root mean square deviation) is the square root of the mean squared distance between paired atoms after superposition, reported in angstroms (1 Å equals 0.1 nanometers). It is the single most reported overlay statistic.
pLDDT (predicted local distance difference test) is AlphaFold's per-residue confidence score, running from 0 to 100. In the files distributed by the AlphaFold database, pLDDT is stored in the B-factor column, which is the per-atom value column that crystallography software traditionally uses for thermal motion. That storage choice is what lets PyMOL color the model by confidence with one command.
Residue numbering is the quiet source of most bad overlays. AlphaFold models use UniProt numbering, which counts every residue in the full precursor sequence, including signal peptides, propeptides, and tags. Experimental structures number residues however the crystallographers chose, often the mature chain after processing. The two schemes frequently differ by a fixed offset, which Step 11 demonstrates with human serum albumin.
Step-by-Step: Overlay an AlphaFold Model with an Experimental Structure in PyMOL

This AlphaFold tutorial uses human ubiquitin as the worked example. The experimental structure is 1UBQ, a 1.8 angstrom X-ray structure of the 76-residue protein. The AlphaFold database entry is AF-P62979-F1, because P62979 is the UniProt entry for a 156-residue precursor in which ubiquitin is residues 1 to 76, followed by a ribosomal protein tail that is absent from the crystal. That mismatch is deliberate. It lets you practice the exact situation you will face with real proteins.
Step 1: Collect your identifiers
Open uniprot.org, search for your protein, and copy the accession (here P62979). On the same page, scroll to the cross-references and note a PDB entry (here 1UBQ). Alternatively, search rcsb.org for the structure and read the UniProt mapping from the entry page.
Step 2: Load the AlphaFold model
In the PyMOL command line (the text box at the top of the window), type:
fetch P62979, alphafold=1PyMOL downloads the model from the AlphaFold database and creates an object, usually named after the accession. If your PyMOL is older than 2.5, or you prefer to keep local copies of files, load the model by URL instead:
load https://alphafold.ebi.ac.uk/files/AF-P62979-F1-model_v4.cifTwo details about that URL. The version suffix (v4 today) changes as the database updates its models, so check the current version on the entry page at alphafold.ebi.ac.uk and record it in your methods. Sequences longer than 2700 residues are split into multiple files named F1, F2, and so on, per the AlphaFold database documentation, so a titin-sized protein gives you several objects to load one at a time.
Step 3: Load the experimental structure
fetch 1ubq, async=0fetch downloads from the RCSB by default. The async=0 option makes the download finish before PyMOL runs the next line, which matters when you paste a block of commands. For very large assemblies, request the mmCIF format explicitly, for example fetch 6vxx, type=cif, because the legacy PDB format cannot hold them.
Step 4: Clean up and rename the objects
remove solvent
hide everything
show cartoon
set_name 1ubq, exp
set_name P62979, model
remove solvent deletes crystallographic waters, which you do not want in a backbone comparison. set_name renames an object. Check the actual object names in the right-hand panel first and adjust the first argument if your PyMOL version named things differently (the URL-loading route produces a name like AF-P62979-F1). Short names with no hyphens keep every later command readable.
Step 5: Superpose the two structures
align model & name CA, exp & name CAalign does two jobs. It builds a sequence alignment between the two selections, then performs an iterative rigid-body fit with outlier rejection, moving the first selection (the mobile object, here model) onto the second (the target, exp). The target never moves. Restricting both selections to name CA pairs one reference atom per residue and keeps waters, ligands, and side chains out of the fit.
Step 6: Read the alignment output
The console reports the number of paired atoms and an RMSD, in a line similar to this (your values will differ slightly with PyMOL version and database model version):
Executive: RMSD = 0.415 (76 to 76 atoms)Read it as: after superposition, the 76 paired CA atoms sit a root-mean-square 0.415 Å apart. For a rigid, well-ordered single domain like ubiquitin, a value of a few tenths of an angstrom is the expected outcome. The atom count matters as much as the RMSD. If the count is far below the number of residues you expected, the pairing went wrong, and the RMSD describes only the surviving subset.
Step 7: Measure RMSD without moving anything
rms_cur model & name CA, exp & name CA
rms model & name CA, exp & name CA
Both commands compute a distance without moving any atoms. rms_cur uses every atom you hand it, no outlier rejection. rms applies iterative rejection and reports the RMSD over the atoms that survive, which is the same logic align uses internally. Running both is a quick diagnostic. If rms is much smaller than rms_cur, a minority of residues are far out while the core agrees, and you should look at those residues directly.
Step 8: Inspect local differences with distance lines
distance loop_dev, model & resi 40-45 & name CA, exp & resi 40-45 & name CAdistance with two selections draws dashed lines between paired atoms and labels each line in angstroms. It pairs atoms strictly by order, so both selections must contain the same residues in the same sequence order, which is why the example pins the same resi range on both sides. Remove the measurement later with delete loop_dev, or hide its labels with hide labels, loop_dev.
Step 9: Color the model by per-residue deviation
The global RMSD hides where the structure agrees and where it fights. The standard figure colors the model from blue (close) through green to red (far). PyMOL needs a small script, because per-residue distances must be written into the B-factor column before spectrum can color them:
python
from pymol import cmd, stored

# model and exp must already be superposed, for example with align
cmd.distance("ca_dev", "model & name CA", "exp & name CA")

stored.ids = []
cmd.iterate("model & name CA", "stored.ids.append(index)")

stored.raw = cmd.get_raw_distances("ca_dev")
assert len(stored.raw) == len(stored.ids), "selections do not pair one to one"

for (i1, i2, d), ca_id in zip(stored.raw, stored.ids):
    cmd.alter("id %d" % ca_id, "b = %.3f" % d)

cmd.disable("ca_dev")
cmd.spectrum("b", "rainbow", "model", minimum=0, maximum=2)
pythonend
The script creates one distance per CA pair, copies each distance into the B-factor of the corresponding model atom, hides the measurement lines, and colors the model with the rainbow palette over the range 0 to 2 Å. Set maximum to roughly the largest deviation you care about. If everything renders blue, your deviations are all well under 2 Å, which is itself the finding.
Two cautions. The script overwrites the B-factor column, so it erases the pLDDT values on that object. Make your pLDDT figure first (next section) or reload the model to get them back. And the order-based pairing assumes both CA selections run through the same residues in the same order, so keep the resi restrictions from Step 8 in mind for anything larger than ubiquitin.
Step 10: Save the session and export a figure
save overlay_session.pse
save model_aligned.pdb, model
png overlay.png, width=2400, height=1800, dpi=300, ray=1
A .pse file preserves objects, colors, views, and measurements so you or a reviewer can reopen the exact scene. The second command writes the aligned model coordinates to disk, which is what you want for downstream tools. The png command ray-traces at 300 dpi with a fixed pixel size, suitable for print.
Step 11: A second example with a numbering offset
Human serum albumin shows why UniProt numbering matters. UniProt entry P02768 annotates an 18-residue signal peptide and a 6-residue propeptide, so the mature 585-residue chain is residues 25 to 609 in UniProt numbering. The crystal structure 1AO6 numbers the mature chain 1 to 585:
fetch P02768, alphafold=1
set_name P02768, alb_model
fetch 1ao6, async=0
set_name 1ao6, alb_exp
remove solvent
align alb_model & resi 25-609 & name CA, alb_exp & resi 1-585 & name CA
align handles the 24-residue offset without complaint because it aligns sequences first. The explicit resi ranges keep the disordered signal peptide and propeptide out of the fit. The same offset would silently corrupt order-based commands (fit, distance, pair_fit), which is the single most common way people produce a nonsense overlay with plausible-looking numbers. Always read the signal peptide, propeptide, chain, and tag annotations on the UniProt entry before you assume any numbering.
Choosing the Right Superposition Command
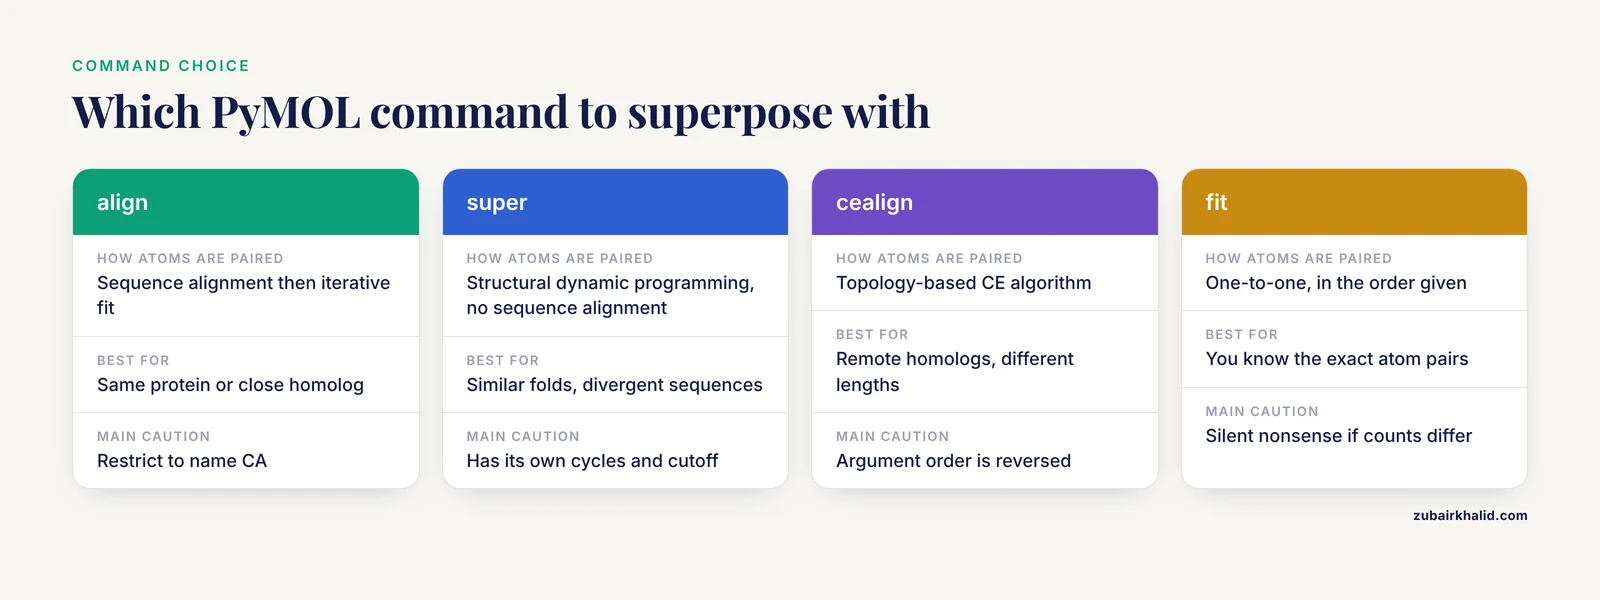
PyMOL ships several superposition commands, and picking the wrong one is the root of most bad overlays. The table below summarizes when to use each.
| Command | How it pairs atoms | Best for | Key options and cautions |
|---|---|---|---|
align | Sequence alignment, then iterative fit with outlier rejection | Same protein or a close homolog, the default choice | Restrict to name CA, exclude solvent, object=aln saves the pairing for inspection |
super | Structural dynamic programming, no sequence alignment | Similar folds with divergent sequences | Also refines with outlier rejection, has its own cycles and cutoff |
cealign | CE algorithm, topology-based | Remote homologs, very different chain lengths | Argument order is reversed: cealign target, mobile |
fit | One-to-one fit of atoms in the order given | You already know the exact atom pairs | Silent nonsense if counts or orders differ, cycles=0 turns refinement off |
pair_fit | Explicit atom pairs you list | Fitting a binding site or motif | You must supply equal, matched selections |
rms / rms_cur | Measures without moving anything | Reporting RMSD after any alignment | rms drops outliers, rms_cur uses everything given |
Two parameters recur across these commands. cutoff is the distance in angstroms beyond which a paired atom counts as an outlier during refinement, defaulting to 2.0. cycles caps how many rejection passes run, where 0 lets PyMOL choose automatically for align and super. If an alignment keeps discarding residues you know are correct, raise cutoff slightly and compare. If a flexible tail is dragging the fit, drop cutoff to 1.0 and let the core dominate.
For debugging pairing, run align once with object=aln. The new alignment object draws lines between every paired residue, and gaps in it show exactly where the sequence alignment inserted insertions or deletions.
Coloring the Model by pLDDT
The AlphaFold database documentation defines four confidence bands, and coloring by them makes the model's self-assessment visible at a glance:
- Above 90: very high confidence, backbone accurate and side chains usually reliable
- 70 to 90: confident backbone, side-chain orientations vary
- 50 to 70: low confidence, backbone position approximate
- Below 50: very low confidence, frequently disordered in solution
Because pLDDT lives in the B-factor column, discrete banding takes four lines:
color blue, model & b > 90
color skyblue, model & (b > 70) & (b <= 90)
color yellow, model & (b > 50) & (b <= 70)
color orange, model & b <= 50
For a continuous gradient instead:
spectrum b, rainbow, model, minimum=0, maximum=100If you want colors that match the official AlphaFold database palette closely, define them once:
set_color af_blue, [0.00, 0.33, 0.84]
set_color af_lightblue, [0.40, 0.80, 0.95]
set_color af_yellow, [1.00, 0.86, 0.07]
set_color af_orange, [1.00, 0.49, 0.27]
Then substitute these names in the four color commands. In the ubiquitin example, the first 76 residues sit in the high-confidence bands while much of the ribosomal tail falls into the low bands, which is exactly the region missing from the crystal.
How to Check That the Overlay Is Correct
A plausible picture is not a verification. Run this checklist before you trust any overlay:
- Count the atoms.
count_atoms model & name CAandcount_atoms exp & name CAshould print 76 each for the ubiquitin example. Mismatched counts mean your selections cover different residue sets. - Check the aligned atom count. The number in the
alignoutput should equal the CA count of the smaller selection. Far fewer pairs means mispairing or gaps you did not expect. - Turn on the sequence viewer with
set seq_view, onand confirm that residue numbers line up the way you intended, especially across any numbering offset. - Hover a landmark residue. Click the catalytic residue or ligand-contacting residue in each object and read its identifier, then draw a
distanceline between the two copies. Active-site atoms should sit within a bond length or two if the site is conserved. - Recompute with a second method.
super model & name CA, exp & name CAshould land within a few tenths of an angstrom of thealignvalue. A large discrepancy signals pairing trouble, not structural insight. - Eyeball the secondary structure. Helices should lie on helices and beta strands on strands, with no strand threading through a neighboring helix. Gross intercalation means the fit converged to a wrong local minimum.
Common Mistakes and Limitations
Mistakes that produce wrong numbers silently
- Superposing raw objects. Waters, ions, and ligands end up in the fit and distort both the pairing and the RMSD. Always
remove solventand restrict selections toname CAor backbone. - Assuming residue numbers match. Signal peptides, purification tags, and cleaved initiator methionines create offsets between UniProt numbering and crystal numbering. The albumin example in Step 11 shows a 24-residue offset in one of the most-studied proteins in the PDB.
- Using
fitordistanceon unequal selections. These commands pair atoms by order with no sequence awareness. If one selection has 585 CAs and the other has 609, you get a confidently wrong answer with no warning. - Reading one global RMSD as a verdict. Outlier rejection means the reported number describes the well-behaved subset. A 0.5 Å global RMSD can coexist with a loop displaced by 8 Å. Multi-domain proteins need per-domain RMSD values, computed with
rmson explicit residue ranges. - Reversing
cealignarguments. Unlikealign, the CE-based command takes the target first:cealign exp, modelmovesmodel. Reversing it moves the wrong object, and everything downstream inherits the error. - Comparing a monomer model to an oligomer chain and expecting interface agreement. AlphaFold database models are single-chain predictions. They contain no information about the biological assembly, so interface residues can differ from the oligomeric crystal structure for reasons that have nothing to do with model quality.
- Calling state differences model error. Crystal packing, bound ligands, pH, and cryogenic temperature freeze the experimental structure into one state. The model represents a different, averaged state. Open and closed conformations of the same enzyme can legitimately differ by many angstroms.
- Not recording the model version. The database has shipped v2, v3, and v4 model sets over time, and entries update. A methods section that omits the version is not reproducible.
Errors you will actually see
- Unknown keyword on
fetch. On PyMOL 2.4 or older,fetch P62979, alphafold=1fails with an error containing "unknown keyword". Fix: upgrade to 2.5 or newer, or load the mmCIF by URL as in Step 2. - Invalid selection. A typo, or an object name containing characters that collide with selection syntax, produces an error naming the selection it could not resolve. Fix: read the object names in the right-hand panel and rename with
set_name. - Far fewer aligned atoms than expected. The
alignoutput reports a small pair count with a large RMSD. Fix: restrict both selections toname CA, verify counts withcount_atoms, and check for numbering offsets. - Fetch fails with a network error.
fetchneeds internet access. Fix: download the PDB or mmCIF file in a browser and useload filenameon the local copy. - Large assemblies load wrong from PDB format. The legacy format caps atom serial numbers at 99,999 and chain IDs at one character, so ribosomes and viruses drop content. Fix:
fetch <id>, type=cif. spectrum bcolors everything one shade. All B-factors are identical, usually because you colored an object whose values were overwritten or absent. Fix: check a few values withiterate model & name CA & resi 1-3, print b.
Limitations of the comparison itself
AlphaFold database models are monomer predictions with no ligands, cofactors, post-translational modifications, membrane lipids, or protonation states. Their confidence scores describe backbone placement, not binding geometry or oligomer interfaces. Experimental structures are single frozen states measured under conditions you should read from the PDB entry. RMSD depends on which atoms you pair and how you superpose, so it is a property of the comparison, not of either structure alone. A computational overlay supports interpretation and generates hypotheses. Experimental validation decides what the structure actually does in solution.
Tips for Publication-Quality Overlay Figures
A few settings turn a screenshot into a figure:
bg_color white
set orthoscopic, on
set ray_shadows, off
set antialias, 2
set ray_opaque_background, off
hide everything
show cartoon, model
show cartoon, exp
set cartoon_transparency, 0.55, exp
png overlay_fig.png, width=2400, height=1800, dpi=300, ray=1
save overlay_session.pse
Practical tips that matter more than any single setting:
- Color the model by per-residue deviation and render the experimental structure as a transparent cartoon underneath, so the reader sees agreement and disagreement in one image.
- Keep one focal region saturated and let the rest recede. A figure that shouts everywhere says nothing.
- Put the RMSD, the number of paired atoms, and the atom type (CA) in the caption. A bare number invites the wrong assumptions.
- PyMOL does not draw a pLDDT or deviation legend. Build the color legend in your graphics tool so the figure is self-explanatory.
- Save the
.psesession alongside the PNG. Reviewers who ask to rotate the scene get an answer in seconds. - Ray-trace (
ray=1) rather than screenshotting. Aliasing in viewport screenshots hides exactly the mismatches readers need to see.
Going Further
TM-score for remote comparisons. RMSD grows with protein size and punishes local outliers, which makes it a poor sole metric for distant relationships. The TM-score, a length-normalized similarity measure where 1.0 means identical topology, is computed by the standalone TMscore and TMalign programs outside PyMOL. Run TMalign on the two coordinate files you exported in Step 10 and report both numbers.
Multiple conformational states. To see how much of a model-versus-crystal difference is really state-to-state motion, compare two experimental states to each other. E. coli adenylate kinase is the classic pair, with 4AKE as the open apo form and 1AKE as the closed inhibitor-bound form:
fetch 4ake 1ake, async=0
remove solvent
align 4ake & chain A & name CA, 1ake & chain A & name CA
Then measure the lid and core domains separately with rms on explicit residue ranges. If the model-to-crystal deviation for one domain matches the crystal-to-crystal deviation across states, you are looking at conformational heterogeneity, not prediction error.
NMR ensembles. NMR entries ship multiple states in one object. Align a single state with the object-state syntax, for example align 1d3z~1 & name CA, model & name CA, and summarize the ensemble spread with intra_rms name CA, 1d3z. Comparing a model against the ensemble mean, rather than one conformer, is the fairer test.
Oligomers. For complexes, either run AlphaFold-Multimer locally or through the AlphaFold Server to get an assembly prediction, or compare the monomer model against each chain of the experimental assembly one at a time.
Frequently Asked Questions
Can PyMOL fetch AlphaFold models directly?
Yes. PyMOL 2.5 and newer download a model by UniProt accession with fetch P62979, alphafold=1. Older versions need you to load the mmCIF file by URL or from a local copy.
Why is my RMSD high when the overlay looks good?
A small number of displaced loops or domains dominates the global number. Align and super down-weight or drop those outliers, so measure the region you care about with rms_cur on an explicit residue range.
Should I align on all atoms or only C-alpha atoms?
Use C-alpha or backbone atoms. Side-chain rotamers, waters, and ligands inflate all-atom RMSD without telling you much about fold agreement.
How do I color an AlphaFold model by pLDDT in PyMOL?
The pLDDT values sit in the B-factor column, so run spectrum b, rainbow, model, minimum=0, maximum=100, or use the four discrete color commands from the pLDDT section for the official banding.
Why does the AlphaFold model have residues my crystal structure lacks?
The model covers the full UniProt sequence, including signal peptides, tags, and disordered tails that are cleaved, engineered away, or simply invisible in the experiment.
What if my protein has no entry in the AlphaFold database?
Generate a prediction with the AlphaFold Server web service from Google DeepMind or a local AlphaFold installation, then load the output mmCIF exactly as shown in Step 2.
Can I compare an AlphaFold model to an NMR ensemble?
Yes. Load all states with fetch, align each state using the object-state syntax such as 1d3z~3, and summarize the spread with intra_rms.
What RMSD counts as a good overlay?
It depends on protein size and your question. As working rules of thumb, CA RMSD under about 1 angstrom for a single domain means the same conformation, 1 to 2 angstroms means the same fold with local differences, and larger values call for per-domain analysis before you interpret anything.