Nextflow Pipeline RNA-seq Microarray Integration
By Dr. Zubair Khalid, DVM, MS, PhD ·

By the end of this guide you will have a working Nextflow pipeline that takes RNA-seq FASTQ files and microarray data (CEL files or processed GEO matrices), produces normalized gene-level expression tables from both platforms, and merges them into a single cross-platform matrix ready for differential expression analysis, batch-effect assessment, or predictive modeling. You will also know which integration strategy to pick, how to check that the merged matrix behaves, and how to fix the errors that stop most people.
Before you start, have these installed and on hand:
- Java 11 or newer, plus Nextflow 23.x or later (
curl -s https://get.nextflow.io | bash) - Docker or Singularity/Apptainer so every tool runs in a pinned container
- R 4.x with
limma,edgeR,affy(oroligofor non-Affymetrix arrays), andsva - A Salmon index or STAR genome index for your organism
- A probe-to-gene mapping table for your microarray platform, for example GPL570 for Affymetrix HG-U133 Plus 2.0
- A samplesheet describing every sample and its platform
The biological motivation matters. RNA-seq has largely replaced microarrays for new profiling, but decades of public microarray data remain truthful and robust, and combining them with RNA-seq increases sample size and statistical power [1]. Published integrations now span breast cancer profiling [1], leukemia multiclass classification [2], head and neck cancer prediction models [3], lactation transcriptomics validated across species [4], cattle muscle hub genes [5], and spermatogonial stem cell aging [6]. The challenge is technical: the two platforms measure mRNA on different scales with different error structures, and several published comparisons show that naive merging produces inconsistent results [7], [8]. A Nextflow pipeline is the right container for this work because every transformation step is versioned, logged, and resumable.
Why the two platforms fight each other
Microarrays measure hybridization intensity per probe. RNA-seq measures read counts per gene. Even after you map both to the same gene identifier, three differences remain:
- Dynamic range. RNA-seq spans several orders of magnitude. Microarray intensities compress the high end, which flattens fold changes for highly expressed genes [7].
- Background and detection limits. Microarrays have a floor of nonspecific signal. Low-abundance transcripts that RNA-seq detects are often indistinguishable from background on an array.
- Platform-specific bias. Batch effects from array lot, scanning date, and lab sit on top of the platform effect itself, and they are hard to separate from it.
Comparative work on time-series data shows overlapping signals between the platforms but real incompatibilities in the raw value space, which is why integration requires a deliberate transformation step rather than a simple rbind [7]. The encouraging result from method evaluations is that transformation at the gene level, rather than the sample level, recovers comparability. In a systematic evaluation of ten batch-correction approaches on paired microarray and RNA-seq datasets, gene-wise unsupervised methods preserved appropriate Type I error control for differential expression, with limma-based correction performing strongest, while supervised methods that use outcome information achieved attractive clustering but leaked information and inflated false positives [9]. That evaluation should shape every design decision below.
Choosing an integration format
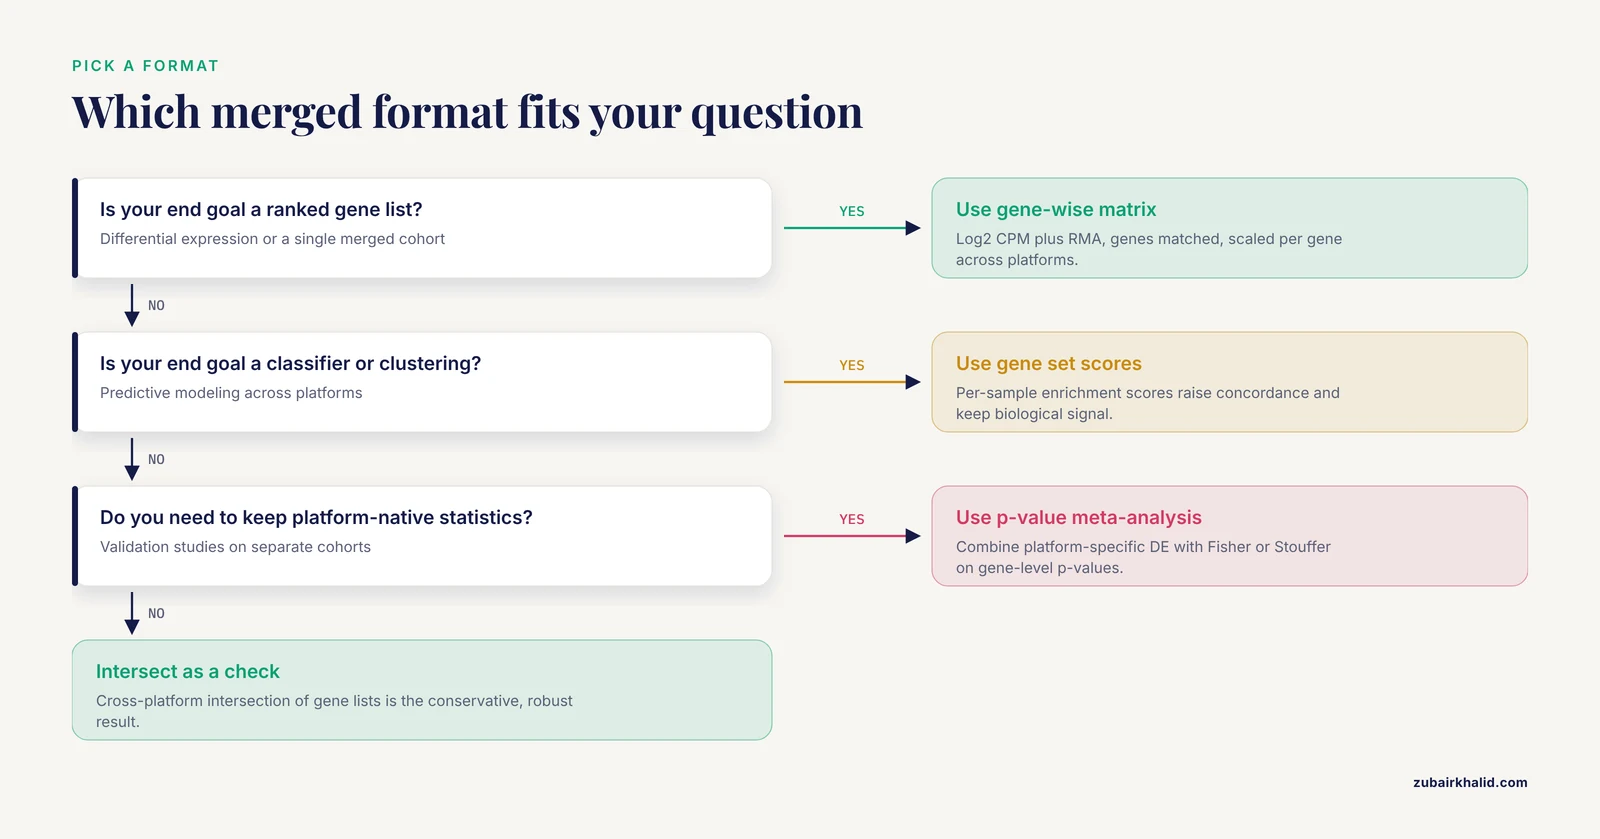
There are three workable formats for the merged data, and the choice determines everything downstream. Pick one before writing code.
| Strategy | What you merge | Best for | Main risk |
|---|---|---|---|
| Gene-wise normalized matrix | Log2 CPM (RNA-seq) plus RMA log2 (array), genes matched, per-gene scaling across platforms | Differential expression, single merged cohort | Residual platform bias if scaling is per-sample instead of per-gene [9] |
| Gene set enrichment scores | Per-sample enrichment scores computed from both platforms against the same gene set collection | Predictive modeling, clustering, cross-platform classifiers | Loses single-gene resolution [8] |
| P-value meta-analysis | Platform-specific DE analyses combined with Fisher or Stouffer methods on gene-level p-values | Validation studies, conserving platform-native statistics | Cannot discover platform-exclusive effects directly [9], [4] |
The gene set route deserves special mention. When high-dimensional expression values from both platforms are transformed into enrichment scores against a shared gene set collection, platform concordance rises substantially because the transform filters platform-specific noise and keeps biologically relevant signal [8]. In predictive-modeling settings, ensembles trained across microarray and RNA-seq datasets have reached MCC and AUC values above 0.8 for disease classification [3]. If your end goal is a classifier, the gene set format is often the fastest path to a stable one.
If your end goal is a ranked gene list, use the gene-wise matrix or the p-value combination. Cross-platform signature studies frequently report the intersection of gene sets identified within each platform as their most robust result, for example in breast cancer cell line profiling [1] and in lactation meta-analysis, where five common differentially expressed genes survived combination of limma-analyzed microarray and edgeR-analyzed RNA-seq data [4]. Intersection is the conservative cousin of p-value meta-analysis and is easy to compute from pipeline outputs.
Pipeline architecture
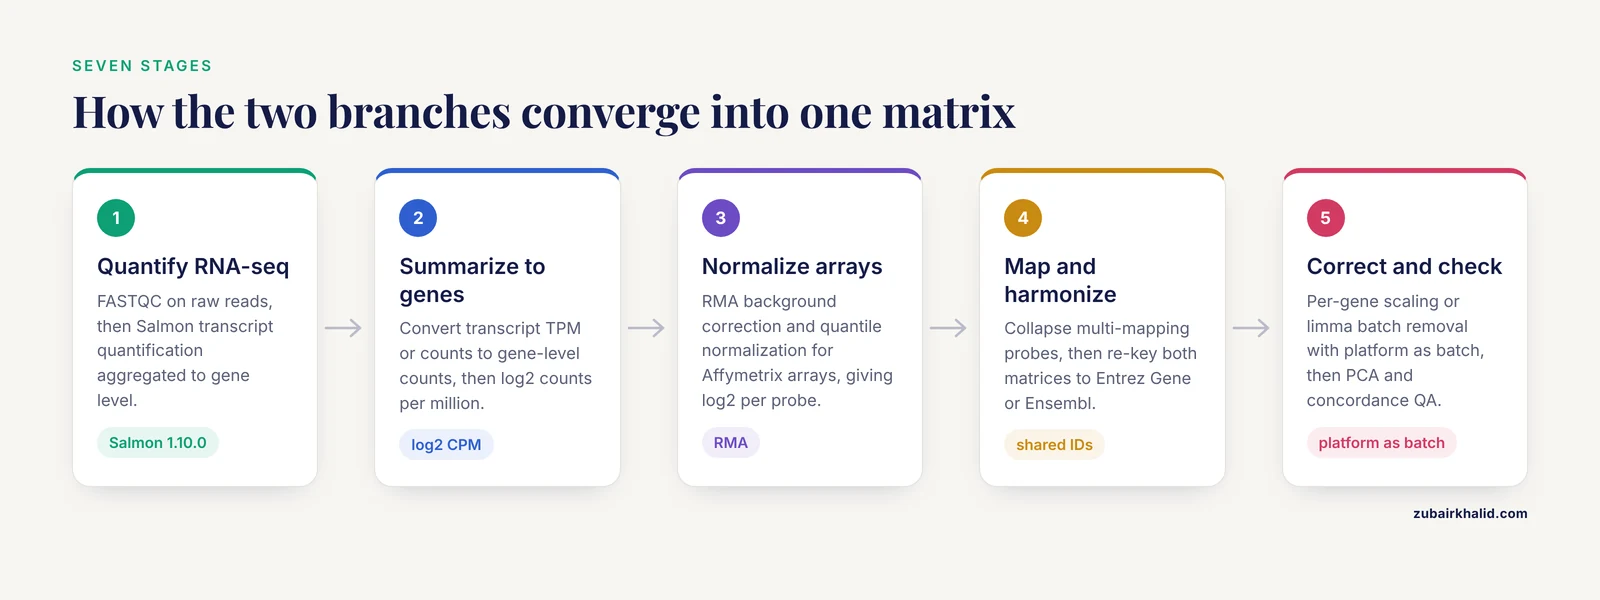
The pipeline has seven stages. RNA-seq stages and microarray stages run independently and converge at the merge.
- RNA-seq quality control and quantification. FASTQC on raw reads, then Salmon for transcript-level quantification, aggregated to gene level.
- RNA-seq summarization. Convert transcript TPM or counts to gene-level counts, then log2 counts per million.
- Microarray normalization. RMA background correction and quantile normalization for Affymetrix arrays, producing log2 expression per probe.
- Probe-to-gene mapping. Map each probe to a gene identifier and collapse multi-mapping probes. Identifier cross-referencing across probe IDs, gene symbols, and stable IDs is a documented requirement of historical microarray integration [10].
- Identifier harmonization. Re-key both matrices to a shared identifier, Entrez Gene or Ensembl, keeping only genes present on both platforms.
- Cross-platform normalization. Per-gene scaling or limma batch removal with platform as the batch factor.
- Analysis and QA. PCA, platform concordance checks, differential expression, and MultiQC-style reporting.
Real production pipelines in this space use exactly this shape. SAMI is a fully integrated UMI-aware Nextflow pipeline built on STAR with post-processing and graphical reporting for splicing events [11], and IntegrateALL chains FASTQC, MultiQC, STAR alignment, fusion detection, variant calling, and subtype classification from FASTQ to final molecular calls in a single Nextflow execution [12]. Both demonstrate that Nextflow handles multi-stage transcriptomics workflows with per-stage containerization well. Your integration pipeline adds the microarray branch and the convergence logic.
Samplesheet format
The samplesheet is the single input contract. Use one CSV with a platform column that routes samples down the correct branch. A row per sample looks like this:
sample,dataset,platform,fastq_1,fastq_2,cel_dir,gpl
SRR101_A,study1,rna_seq,data/study1/SRR101_A_R1.fastq.gz,data/study1/SRR101_A_R2.fastq.gz,,
SRR101_B,study1,rna_seq,data/study1/SRR101_B_R1.fastq.gz,data/study1/SRR101_B_R2.fastq.gz,,
GSM77_C,study2,microarray,,,,data/study2/cels,GPL570
GSM77_D,study2,microarray,,,,data/study2/cels,GPL570
Two format rules prevent most downstream errors. First, every field must be filled for every platform, even if empty, so the CSV parser never shifts columns. Second, microarray samples from one array study should share a dataset value and a cel_dir, because RMA normalization must run across all arrays in a study at once, never one array at a time. Quantile normalization is only meaningful within a set of arrays.
The pipeline template
Here is a complete, minimal main.nf. It assumes helper scripts live in a bin/ directory inside the pipeline root, which Nextflow adds to PATH automatically.
nextflow.enable.dsl = 2

params.samplesheet = "samplesheet.csv"
params.salmon_index = "assets/salmon_index"
params.gtf = "assets/genes.gtf"
params.tx2gene = "assets/tx2gene.tsv"
params.outdir = "results"

workflow {

    ch_samples = Channel.fromPath(params.samplesheet)
        .splitCsv(header: true)

    ch_rnaseq = ch_samples
        .filter { row -> row.platform == "rna_seq" }
        .map { row -> tuple(
            [id: row.sample, dataset: row.dataset],
            file(row.fastq_1),
            file(row.fastq_2)
        )}

    ch_array = ch_samples
        .filter { row -> row.platform == "microarray" }
        .map { row -> tuple(
            [id: row.sample, dataset: row.dataset, gpl: row.gpl],
            file(row.cel_dir)
        )}

    QUANT_RNASEQ(ch_rnaseq)
    ch_quants = QUANT_RNASEQ.out.quant

    SUMMARIZE_GENES(ch_quants)
    ch_genecounts = SUMMARIZE_GENES.out.counts

    NORMALIZE_ARRAY(ch_array)
    ch_probe_expr = NORMALIZE_ARRAY.out.expr

    COLLAPSE_PROBES(ch_probe_expr)
    ch_array_genes = COLLAPSE_PROBES.out.genes

    MERGE_PLATFORMS(ch_genecounts.collect(), ch_array_genes.collect())
    ch_merged = MERGE_PLATFORMS.out.merged

    QA_INTEGRATION(ch_merged)
}

process QUANT_RNASEQ {
    tag "${meta.id}"
    cpus 8
    memory "32 GB"
    container "quay.io/biocontainers/salmon:1.10.0--h6a678d5_2"

    input:
    tuple val(meta), path(fastq_1), path(fastq_2)

    output:
    tuple val(meta), path("${meta.id}.sf"), emit: quant

    script:
    """
    salmon quant -i ${params.salmon_index} -l A \\
        -1 ${fastq_1} -2 ${fastq_2} \\
        -p ${task.cpus} --validateMappings \\
        --gcBias --seqBias \\
        -o salmon_out
    mv salmon_out/quant.sf ${meta.id}.sf
    """
}

process SUMMARIZE_GENES {
    tag "${meta.id}"
    container "biocontainers/bioconductor-tximport:v1.30.0-deb_cv1"

    input:
    tuple val(meta), path(quant)

    output:
    tuple val(meta), path("${meta.id}_counts.tsv"), emit: counts

    script:
    """
    tximport_to_gene.R ${quant} ${params.tx2gene} ${meta.id}_counts.tsv
    """
}

process NORMALIZE_ARRAY {
    tag "${meta.dataset}"
    publishDir "${params.outdir}/microarray", mode: "copy"
    container "bioconductor/bioconductor_docker:RELEASE_3_19"

    input:
    tuple val(meta), path(cels)

    output:
    tuple val(meta), path("${meta.dataset}_rma.tsv"), emit: expr

    script:
    """
    rma_normalize.R ${cels} ${meta.dataset}_rma.tsv
    """
}

process COLLAPSE_PROBES {
    tag "${meta.dataset}"
    container "bioconductor/bioconductor_docker:RELEASE_3_19"

    input:
    tuple val(meta), path(expr)

    output:
    tuple val(meta), path("${meta.dataset}_genes.tsv"), emit: genes

    script:
    """
    collapse_probes.R ${expr} ${meta.gpl} ${meta.dataset}_genes.tsv
    """
}

process MERGE_PLATFORMS {
    publishDir "${params.outdir}/integrated", mode: "copy"
    container "bioconductor/bioconductor_docker:RELEASE_3_19"

    input:
    path(rna_matrices)
    path(array_matrices)

    output:
    path("merged_expression.tsv"), emit: merged

    script:
    """
    integrate_platforms.R \\
        "${rna_matrices.join(',')}" \\
        "${array_matrices.join(',')}" \\
        merged_expression.tsv
    """
}

process QA_INTEGRATION {
    publishDir "${params.outdir}/qa", mode: "copy"
    container "bioconductor/bioconductor_docker:RELEASE_3_19"

    input:
    path(merged)

    output:
    path("pca_platforms.png"), emit: pca
    path("concordance_report.tsv")

    script:
    """
    qa_integration.R ${merged} pca_platforms.png concordance_report.tsv
    """
}
And the matching nextflow.config:
params {
    samplesheet  = "samplesheet.csv"
    salmon_index = "assets/salmon_index"
    tx2gene      = "assets/tx2gene.tsv"
    outdir       = "results"
}

process {
    cpus   = 4
    memory = "16 GB"
    errorStrategy = "retry"
    maxRetries    = 2
}

profiles {
    docker {
        docker.enabled = true
    }
    singularity {
        singularity.enabled = true
        singularity.autoMounts = true
    }
    test {
        params.samplesheet = "test/samplesheet_test.csv"
    }
}
Launch it like this:
nextflow run main.nf -profile docker -resumeThe -resume flag reuses cached results for any process whose inputs, code, and container have not changed. When you rerun after fixing a bug in one R script, only that process and everything downstream re-executes.
The helper scripts
Each helper script is small enough to review line by line, which is where most integration mistakes hide.
bin/rma_normalize.R turns a study directory of CEL files into one log2 gene-by-sample probe matrix:
library(affy)
args <- commandArgs(trailingOnly = TRUE)
cel_dir <- args[13]
outfile <- args[1]
cels <- list.files(cel_dir, pattern = "\\.CEL$|\\.cel$", full.names = TRUE)
stopifnot(length(cels) > 1)
raw <- ReadAffy(filenames = cels)
eset <- rma(raw)
out <- exprs(eset)
write.table(out, outfile, sep = "\t", quote = FALSE)
bin/collapse_probes.R maps probes to genes and collapses duplicates by taking the probe with the highest interquartile range, a standard limma-family heuristic:
library(data.table)
args <- commandArgs(trailingOnly = TRUE)
expr_file <- args[13]
gpl       <- args[1]
outfile   <- args[14]
mat <- fread(expr_file, data.table = FALSE)
rownames(mat) <- mat[[13]]
mat[[13]] <- NULL
annot <- fread(gpl, header = TRUE, data.table = FALSE)
idx <- match(rownames(mat), annot[[13]])
gene <- annot[idx, "GeneID"]
keep <- !is.na(gene)
mat <- mat[keep, ]
gene <- gene[keep]
iqr <- apply(mat, 1, IQR)
ord <- order(gene, -iqr)
mat <- mat[ord, ]
gene <- gene[ord]
first <- !duplicated(gene)
out <- mat[first, ]
rownames(out) <- gene[first]
write.table(out, outfile, sep = "\t", quote = FALSE)
bin/integrate_platforms.R is the heart of the integration. It converts RNA-seq counts to log2 CPM with edgeR, matches genes, and applies limma batch removal with platform as the batch covariate, consistent with the gene-wise approach that performed best in the systematic method evaluation [9]:
library(edgeR)
library(limma)
args <- commandArgs(trailingOnly = TRUE)
rna_files  <- strsplit(args[13], ",")[[13]]
array_files <- strsplit(args[1], ",")[[13]]
outfile    <- args[14]

rna <- lapply(rna_files, function(f) {
    m <- read.delim(f, row.names = 1)
    m
})
rna_mat <- do.call(cbind, rna)
d <- DGEList(counts = rna_mat)
cpm <- cpm(d, log = TRUE, prior.count = 1)

arr <- lapply(array_files, function(f) {
    m <- read.delim(f, row.names = 1)
    m
})
arr_mat <- do.call(cbind, arr)

shared <- intersect(rownames(cpm), rownames(arr_mat))
stopifnot(length(shared) > 1000)
both <- cbind(cpm[shared, ], arr_mat[shared, ])

platform <- c(rep("rna_seq", ncol(cpm)), rep("microarray", ncol(arr_mat)))
corrected <- removeBatchEffect(both, batch = platform)
write.table(corrected, outfile, sep = "\t", quote = FALSE)
The stopifnot(length(shared) > 1000) guard is deliberate. If the intersection of identifiers collapses to a handful of genes, your probe mapping is broken and you want the pipeline to fail loudly rather than produce a meaningless matrix.
bin/qa_integration.R produces the two artifacts that tell you whether the merge worked:
library(limma)
library(png)
args <- commandArgs(trailingOnly = TRUE)
mat <- read.delim(args[13], row.names = 1)
png(args[1], width = 1600, height = 1200, res = 200)
platform <- grepl("^SRR", colnames(mat))
pca <- prcomp(t(mat), rank. = 2)
plot(pca$x, col = ifelse(platform, "steelblue", "firebrick"),
     pch = 19, xlab = "PC1", ylab = "PC2",
     main = "Post-correction PCA by platform")
legend("topright", c("RNA-seq", "Microarray"),
       col = c("steelblue", "firebrick"), pch = 19)
dev.off()
cor_mat <- cor(t(mat))
write.table(summary(as.vector(cor_mat)), args[14],
            sep = "\t", row.names = FALSE)
A worked example, end to end
Suppose you integrate a breast cancer RNA-seq study of six paired tumor-normal samples with a GEO microarray study of twelve tumor samples on GPL570. This mirrors published breast cancer integration work, where combining microarray and RNA-seq datasets produced gene signatures with stronger statistical support than either platform alone and robust performance when unseen samples were classified [1].
Launch:
nextflow run main.nf -profile dockerExpected console output at completion:
Completed at 11-Nov-2026 14:22:07
Duration    : 41m 13s
CPU hours   : 5.9
Succeeded   : 24
Key output files:
results/microarray/study2_rma.tsv, roughly 54,000 probe rows by 12 sample columns, values near 2 to 14 on the log2 scaleresults/microarray/study2_genes.tsv, roughly 18,000 unique Entrez gene rows after probe collapsingresults/integrated/merged_expression.tsv, one row per shared gene, all 18 samples as columnsresults/qa/pca_platforms.png
How to read the QA output. In the pre-correction PCA, RNA-seq and microarray samples separate cleanly on PC1, which is the platform effect. After removeBatchEffect with platform as the batch factor, samples from the two platforms should interleave within biological groups. They will not overlap perfectly, and they do not need to. The goal is that biological grouping explains more variance than platform. If tumor and normal samples separate on PC1 and platform on PC2, you are in good shape. If platform still dominates PC1 after correction, the correction failed and you should investigate before any downstream analysis.
A second check is the correlation structure. Compute Spearman correlation of every gene's expression across the two platforms for matched or condition-matched samples. Raw values correlate imperfectly between platforms, which published comparisons have documented directly. Gene set enrichment scores computed from both platforms correlate substantially better than raw values, which is exactly why the enrichment-score format exists [8]. If your concordance report shows near-zero cross-platform correlation where biology says there should be strong signal, suspect identifier mapping first and normalization second.
Differential expression on the merged matrix
With the merged matrix in hand, a limma model treats platform as a covariate. For a tumor versus normal comparison:
library(limma)
mat <- read.delim("results/integrated/merged_expression.tsv", row.names = 1)
group <- ifelse(grepl("^SRR", colnames(mat)), "tumor_rna", "normal_rna")
group[grepl("^GSM", colnames(mat))] <-
    ifelse(grepl("_tumor", colnames(mat)[grepl("^GSM", colnames(mat))]),
           "tumor_array", "normal_array")
platform <- ifelse(grepl("^SRR", colnames(mat)), "rna_seq", "microarray")
design <- model.matrix(~ 0 + group + platform)
fit <- lmFit(mat, design)
cont <- makeContrasts(tumor_vs_normal =
    (group$tumor_rna + group$tumor_array) / 2 -
    (group$normal_rna + group$normal_array) / 2,
    levels = design)
fit2 <- eBayes(contrasts.fit(fit, cont))
top <- topTable(fit2, number = Inf)
The platform term absorbs residual platform effects so the tumor contrast is estimated within the combined model. This is the design the method evaluation favored, because gene-wise unsupervised correction plus a platform-aware linear model kept false positive rates at nominal levels while retaining power [9].
Then validate by intersection. Run the differential expression analysis separately within each platform before merging, take the top gene lists from each, and compute their overlap. Cross-platform signature studies report exactly this intersection as the most significant and most reproducible gene set [1], and the same intersection logic underlies the five-gene lactation signature that survived across cattle microarray data and sheep RNA-seq validation [4]. If a gene appears in both platform-specific lists, its cross-platform call is far more trustworthy than a call driven by the merged model alone.
Bioinformatics troubleshooting: exact errors and fixes
These are the failures you will actually hit, in the order you will hit them.
1. Process QUANT_RNASEQ terminated with an error exit status (1)
This generic Nextflow wrapper is your starting point, not the diagnosis. Inspect the real error:
cd work/12/ab3f9c*/
cat .command.err | tail -20
nextflow log -f status,exit,process | grep ERRO
The .command.err file holds the tool's stderr, .command.sh holds the exact script that ran, and .command.run shows the environment. Ninety percent of exit status 1 cases in this pipeline are a bad path in the samplesheet or a Salmon index built with a different reference than your annotation.
2. EXITING because of FATAL error: not enough memory to load genome from STAR, or OOM kills in Salmon
The memory you set in nextflow.config was too low. STAR index loading for a human genome needs well above 16 GB. Raise the memory for that process and rerun with -resume:
withName: QUANT_RNASEQ {
    memory = "48 GB"
}
If you see Cannot get the memory usage of the container, your container runtime is not reporting memory to Nextflow. This happens with rootless Docker on some hosts. Set an explicit withLabel memory block and disable automatic detection, or switch the profile to Singularity.
3. There is not enough memory for the JVM at Nextflow startup
Nextflow itself runs in a JVM with a fixed heap. Export a larger heap before launching:
export NXF_JVM_ARGS="-Xmx4g"
nextflow run main.nf -profile docker
4. Unknown configuration profile: docker
Your nextflow.config does not define the profile you named, or you are running from the wrong directory so the config file is not being read. Check with:
nextflow config -flat | grep profiles5. Error in lmFit mentioning row names and column names
This is the sample-ordering error, and it is the most dangerous one on this list because it can happen silently in other scripts. If the design matrix rows do not line up with matrix columns, every downstream statistic is wrong. The classic cause is a sample that dropped out in an upstream process while the metadata channel stayed whole. Fix it by joining on sample keys rather than position:
common <- intersect(colnames(mat), rownames(design))
mat <- mat[, common]
design <- design[common, ]
Then assert the match explicitly in every R script: stopifnot(identical(colnames(mat), rownames(design))).
6. The shared gene count collapses below your threshold and the pipeline aborts
Almost always an identifier mismatch. One matrix is keyed on Entrez IDs as strings with leading values preserved, the other on symbols, or one platform annotation uses a different genome build. The fix is a single canonical mapping step. Download the platform annotation table from GEO, map probe IDs to current gene identifiers using a maintained annotation resource, and drop probes that no longer map. Identifier drift in historical arrays is a documented integration problem, which is why dedicated tooling was built to cross-reference Affymetrix probe set IDs against gene annotation from multiple sources [10]. Re-run and confirm the intersection recovers to a plausible size, in the many thousands of genes for human platforms.
7. singularity: command not found or image pull failures
The profile requests a container runtime that is missing or a registry that is unreachable. Verify the runtime first:
singularity --version
docker info
If you are behind a firewall, pre-pull images to a local cache and point the profile at local image paths. Pre-pulling also makes runs reproducible on compute nodes without internet access.
8. R scripts fail with Error: cannot allocate vector of size 2.3 Gb
The R process exceeded its container memory. Large merged matrices of tens of thousands of genes by hundreds of samples need several gigabytes inside the container. Bump the memory on MERGE_PLATFORMS and QA_INTEGRATION. Also convert hot loops to matrix operations. The apply calls above are fine at cohort scale but a pure R loop over 50,000 genes will exhaust both memory and patience.
9. Silent sample swaps after channel merging
This is not an error message, which is why it is last and worst. If you merge RNA-seq and microarray channels with positional tuple operations instead of keyed joins, a filter anywhere upstream shifts every downstream pairing. The prevention is structural: carry the metadata map [id: row.sample, dataset: row.dataset] through every channel, and use join on keys when converging branches. Then verify by checking that each output column name matches its expected platform and group before trusting any result.
Verifying the pipeline is correct
Four checks, in order of how often they catch real problems:
- Sample count reconciliation. The number of columns in
merged_expression.tsvmust equal your RNA-seq sample count plus your microarray sample count. Print it and compare against the samplesheet row count, minus any duplicates. - PCA platform separation pattern. Platform should explain less variance after correction than biological group. Look at the plot, not just the code exit code.
- Known biology recovery. If you are integrating breast cancer data, housekeeping genes should be stable across platforms and a handful of canonical markers should move in the published direction in both platform-specific analyses. The intersection-then-validate pattern used across published integrations [1], doubles as your sanity check.
- Replicate concordance. If any samples exist on both platforms for the same biological condition, their per-gene profiles should correlate after gene-wise scaling. Weak correlation there means your normalization is masking real signal or identifier mapping is still imperfect.
Common Mistakes and Limitations
Merging raw values. RNA-seq counts and microarray intensities live on incompatible scales. Every merge must pass through a defined transformation, log2 CPM plus RMA at minimum, before genes meet.
Using supervised correction for discovery. Supervised batch correction methods use outcome information during correction, which produces beautiful clustering and inflated Type I error. They are inappropriate when the goal is unbiased discovery, a finding established directly by the systematic method comparison [9]. Use them only for prediction models where the outcome is the point.
Treating platform as the only batch. If RNA-seq samples come from one lab and microarray samples from another, platform and lab are confounded. No correction method can separate them. Report this honestly in your methods rather than claiming the correction removed what it mathematically could not see. Also avoid correcting on an outcome-correlated covariate.
Stale probe annotations. Annotation files for legacy platforms contain probes mapping to genes that have since been merged, renamed, or withdrawn. Mapping through a current gene identifier resource and dropping unresolved probes is standard practice for integrating historical microarray experiments with RNA-seq [10].
Ignoring the gene set alternative. If single-gene concordance stays poor, the enrichment-score transformation demonstrably raises platform comparability and supports cross-platform predictive models [8]. Forcing the raw-value merge when the gene set format fits your question wastes weeks.
Trusting a single validation. One overlapping DEG list does not establish integration validity. Published pipelines that report robust results use held-out classification or repeated cross-validation across platforms [1],. Budget for that step.
Nextflow hygiene. Do not write outputs outside publishDir targets, do not edit inputs inside the work/ directory, and do not delete work/ while a run is incomplete or you lose every resume anchor. Pin container tags. An unpinned :latest tag means your pipeline can silently change behavior between runs.
Finally, a limitation that applies to every result in this article. Individual datasets have their own platform versions, genome builds, and quality quirks, so any concrete analysis needs review against your own data by someone who can interrogate the QC reports, not just the exit codes.
Frequently Asked Questions
Can I merge raw microarray intensities with RNA-seq counts directly?
No. The two technologies measure expression on fundamentally different scales with different error structures, and direct merging produces values that cannot be interpreted jointly. Transform RNA-seq counts to log2 counts per million, normalize microarrays with RMA or an equivalent, map both to shared gene identifiers, and only then apply a cross-platform correction step such as limma batch removal with platform as the batch factor.
Which batch correction method works best for microarray and RNA-seq integration?
Among unsupervised options, gene-wise methods perform best, with limma showing the strongest differential expression performance in a systematic evaluation of ten methods on paired microarray and RNA-seq datasets. Avoid supervised correction methods for discovery analyses because they leak outcome information and inflate false positive rates.
Do I need samples measured on both platforms?
You do not need paired samples on both platforms, and most published integrations combine separate cohorts. What you do need is overlapping biological conditions, shared gene identifiers, and platform included as a covariate in downstream models. Matched samples on both platforms are a valuable validation asset when available but not a requirement.
What gene identifier should I map probes and transcripts to?
Pick one stable namespace, Entrez Gene ID or Ensembl Gene ID, and map everything to it. Gene symbols change over time and probe annotations go stale, so map probes through a current annotation resource and drop unmapped probes rather than forcing them through with symbols.
How do I run the pipeline with containers?
Use -profile docker or -profile singularity as defined in the nextflow.config, and pin every container to a specific version tag. Singularity is usually the right choice on shared HPC systems where users lack Docker privileges, and pre-pulled local images remove registry dependence on compute nodes.
How do I resume a failed run without redoing everything?
Add -resume to your nextflow run command. Nextflow caches each process result keyed on inputs, script text, and container, so fixing one R script re-executes only that process and its downstream dependents. Keep the work/ directory intact between attempts or the cache is lost.
How many samples do I need per platform?
There is no universal number, but each platform-specific analysis should have enough samples for a stable linear model, and the merged cohort should not be dominated so heavily by one platform that the other contributes almost nothing to the contrast. If one platform has a handful of samples and the other has hundreds, a per-platform analysis followed by intersection of gene lists is often more defensible than a single merged model.
How do I know my integrated result is real?
Run platform-specific differential expression analyses separately, compute the intersection of their top gene lists, and require that merged-model hits appear in that intersection or validate in held-out cross-platform classification. Published cross-platform studies use exactly this intersection and validation logic to separate reproducible signals from platform artifacts.
Sources
- Integration of RNA-Seq data with heterogeneous microarray data for breast cancer profiling
- Leukemia multiclass assessment and classification from Microarray and RNA-seq technologies integration at gene expression level
- Developing Robust Predictive Models for Head and Neck Cancer across Microarray and RNA-seq Data
- Transcriptome signature of the lactation process, identified by meta-analysis of microarray and RNA-Seq data
- Integration of RNA-seq and ATAC-seq identifies muscle-regulated hub genes in cattle
- Integrating Microarray Data and Single-Cell RNA-Seq Reveals Key Gene Involved in Spermatogonia Stem Cell Aging
- RNA-Seq vs Dual- and Single-Channel Microarray Data: Sensitivity Analysis for Differential Expression and Clustering
- Increased comparability between RNA-Seq and microarray data by utilization of gene sets
- Evaluating Cross-Platform Batch Correction Methods for Integrated Microarray and RNA-seq Data Analysis
- Towards the integration, annotation and association of historical microarray experiments with RNA-seq
- Detecting unannotated splicing events in short-read RNA-seq with SAMI, a UMI-aware Nextflow pipeline.
- Integrateall, a Machine Learning Pipeline for Multi-Level Data Extraction from RNA-Seq Profiles Unravels Novel Drivers and Systematic Subtype Classification in B-Cell Precursor ALL