Out of Memory Errors in Nextflow: Tuning Memory Limits
By Dr. Zubair Khalid, DVM, MS, PhD ·

The most common cause of a Nextflow out of memory error is a process whose memory directive requests less memory than the tool inside it actually consumes. The Linux kernel, the container runtime, or the batch scheduler then kills the task with SIGKILL, Nextflow reports exit status 137, and the pipeline stops on that process. The first thing to check is the exit code of the failed task. Open .nextflow.log, find the failed task line, and look for exit status 137. If you see 137, you are almost certainly dealing with an out of memory kill rather than a bug in your code.
This article explains how memory actually flows through a Nextflow execution, walks the causes of out of memory errors in Nextflow from the most common to the rarest, gives you a diagnostic sequence you can follow in order, and then shows you exactly how to fix and tune memory limits. The fixes apply whether you run on a laptop, an HPC cluster with SLURM, or in the cloud. Modern genomics pipelines such as SMURFS, which chains four variant callers plus copy number and structural variant tools into one workflow [1], or DNAharvester, which switches between three aligners depending on the input [2], run many memory hungry tools in a single run. One underprovisioned process anywhere in that chain will stop the whole pipeline.
Why Out of Memory Errors Happen in Nextflow
Nextflow is a scheduler and orchestrator, not a memory manager. When you write memory '16 GB' inside a process block, Nextflow passes that number to the executor. What happens next depends entirely on where the pipeline runs.
On an HPC cluster with the SLURM executor, Nextflow submits each task as a job whose resource request comes from the memory directive. SLURM then enforces that limit, usually through Linux control groups (cgroups). If the task's main process, or any child process it spawns, tries to allocate beyond the limit, the kernel kills it. The task dies with SIGKILL, which produces exit code 137 (128 plus the signal number 9). Nextflow has no idea why the task died. It only sees a dead process and a nonzero exit code.
On a local machine without containers, the memory directive is largely advisory. Nothing enforces it. Your tool simply consumes what it needs, and if that exceeds physical RAM plus swap, the kernel's out of memory killer (OOM killer) selects the largest process and kills it. Again you get exit 137, and again the failure looks identical from Nextflow's point of view.
Inside Docker, Singularity, or Apptainer containers, the memory directive is translated into a container memory limit. Exceeding it kills the container. Same exit code, same symptom, different enforcement layer.
The key insight for bioinformatics troubleshooting is that the failure surface has three layers: the tool process, the container or cgroup around it, and the scheduler allocation underneath. A Nextflow out of memory error means one of those layers was tighter than the tool's actual peak memory use. Your job is to find which layer and widen it.
Exit codes give you the first clue. Exit 137 means SIGKILL, the classic memory kill. Exit 143 means SIGTERM, which often comes from a scheduler time limit rather than a memory limit, though some schedulers also send SIGTERM before killing for memory. Exit 139 (SIGSEGV, a segmentation fault) is usually a genuine program bug, not a memory problem, even though the crash message may mention memory. Segmentations faults during alignment or variant calling are a different debugging problem from out of memory errors in Nextflow, and this article does not cover them.
Causes of Nextflow Out of Memory Errors, Most Common to Rarest
Cause 1: The memory directive is lower than the tool's peak usage
This is the cause behind most out of memory errors. Every process block in your pipeline has a memory directive, or inherits one from an include, a profile, or a label in a config file. The person who wrote that default guessed a value that fits typical inputs. Your inputs are not typical.
A few patterns make this failure hard to spot. First, the failure is data dependent. A pipeline that has run successfully twenty times fails on sample twenty one because that sample has twice the reads, a larger genome, or an unusually high duplication rate. Second, the failure often appears in the largest process in the pipeline, such as genome indexing, alignment, or de novo assembly, which is also the process people tune least because it usually works. Third, memory requirements scale with inputs in ways that are not obvious. A BWA index of a human sized genome fits comfortably in a modest allocation, but STAR alignment of the same genome needs tens of gigabytes because it loads the uncompressed genome sequence into RAM, and that is established, well documented behavior of the tool.
The mechanism is simple. The tool runs, its resident memory grows as it loads data, it crosses the cgroup or container limit, and the kernel sends SIGKILL. Nothing is wrong with your script. The allocation is just smaller than the workload.
Cause 2: Java tools capped by their default heap
Many tools in genomics are written in Java: GATK, Picard, samtools markdup in some versions, VEP, snpEff, and the Nextflow launcher itself. The Java virtual machine (JVM) does not use all available memory by default. It caps itself with a heap limit set by the -Xmx flag, and default heap values are conservative, often one quarter of system RAM or less. A Picard SortSam running inside a 64 GB allocation with a 4 GB default heap will fail with a Java OutOfMemoryError long before it approaches the allocation.
This failure mode looks different from exit 137. You will see a Java stack trace in .command.err or .command.log containing java.lang.OutOfMemoryError: Java heap space, and the task exits with code 1 rather than 137. The fix is not more memory alone. The fix is raising the heap cap with -Xmx so the JVM can actually use the memory you requested. This distinction confuses many people tuning memory limits, because adding memory to the process without raising the heap cap changes nothing.
A related and easily confused case is the Nextflow JVM itself running out of memory. We cover that separately below because it has its own fix.
Cause 3: R and Bioconductor failures in RNA-seq and single cell steps
If you see an "rna seq error" late in a pipeline, with a message like cannot allocate vector of size in an R traceback, you have hit the most common memory failure in R based steps. R loads entire data objects into memory. DESeq2, edgeR, limma voom, and Seurat all build count matrices and intermediate vectors that scale with the number of genes times the number of samples, and Seurat additionally scales with the number of cells. A matrix that fit in memory for twelve samples will not fit for two hundred, and the failure appears as an R error object allocation failure rather than a SIGKILL.
These failures are genuine out of memory errors in Nextflow even though the message text never says "out of memory". The error text cannot allocate vector of size followed by a number in Mb or Gb is the R runtime telling you exactly how much additional memory it wanted. Treat it the same way as exit 137: raise the allocation, and in some cases restructure the analysis to avoid holding everything at once.
Cause 4: Container memory limits override your directives
When you run with Docker, Singularity, or Apptainer, Nextflow converts the memory directive into a container runtime flag. But if your config sets a memory value in more than one place, the resolution order decides which value wins. Nextflow resolves configuration in a defined precedence order, with later sources overriding earlier ones: core defaults, then pipeline config, then user config, then profile selections, then command line parameters. A stale -with-tower era config fragment, an old nextflow.config in your working directory, or a profile you forgot you selected can silently cap memory below what you intended.
The way to confirm this cause is to run nextflow config -flat from the launch directory and inspect the effective process.memory values. If the resolved value differs from what you think you set, a config file somewhere is overriding you.
Cause 5: Scheduler and queue limits
On HPC systems, you can request memory that the partition will never grant. Many clusters cap per job memory on standard queues and reserve the big nodes for a dedicated partition or a special qos (quality of service). When you request more than the partition allows, the job either fails to submit or is queued indefinitely, which in Nextflow appears as a task stuck in a submission retry loop rather than a clean memory error. Conversely, some schedulers underprovision on purpose, and a job that requests 32 GB on a node where 30 GB is actually free will be killed shortly after it starts.
Check the scheduler side directly. For SLURM, scontrol show job JOBID shows what was actually granted, and sacct -j JOBID -o JobID,State,MaxRSS,Elapsed shows the peak resident set size (MaxRSS, the largest amount of physical memory the job actually used) and the final state. A state of OUT_OF_MEMORY is explicit confirmation. Pipelines designed to run across local, HPC, and cloud environments, such as EXCON, which explicitly supports all three execution environments [3], must handle this variability, which is why well maintained pipelines ship cluster specific profiles rather than one universal memory setting.
Cause 6: The Nextflow JVM itself running out of memory
The Nextflow launcher runs as a JVM, and for very large workflows, thousands of tasks and wide channel operations, its heap can fill. The symptom is a java.lang.OutOfMemoryError: Java heap space traceback printed by Nextflow itself, in the console or in .nextflow.log, not by any task. This is rare relative to task level failures but real on large runs.
The fix is to raise the launcher heap with the NXF_OPTS environment variable before launching, for example export NXF_OPTS="-Xms1g -Xmx4g". You can distinguish this cause from task level failures by who printed the error. Task level Java errors live in the work directory logs. Launcher level errors appear in the main log and the run terminates as a whole.
Cause 7: Channel materialization and memory leaks in the workflow script
The rarest cause. Nextflow holds channel contents in memory when a channel is read more than once, and a script that repeatedly consumes the same large file list channel can inflate the launcher's memory use. This interacts with Cause 6. It is worth checking if your launcher OOM errors appear only on runs with many samples and complex channel operations. It is a script design problem, not a resource limit problem, and the fix lies in how channels are split and reused rather than in any memory directive.
Troubleshooting Table
| Symptom | Likely cause | How to confirm | Fix |
|---|---|---|---|
| Task fails, exit status 137, killed in minutes | Memory directive below tool peak | dmesg -T on the compute node shows an oom kill, or SLURM state OUT_OF_MEMORY, or cgroup memory events | Raise memory for that process, see tuning section |
| Task fails, exit status 137, only on large samples | Data dependent memory growth | Compare MaxRSS of succeeded and failed runs with sacct or trace report | Use dynamic memory scaling or a high memory label |
Java stack trace with OutOfMemoryError: Java heap space inside .command.err, exit code 1 | JVM heap cap inside the tool | Grep the task log for Java heap space | Add -Xmx to the tool invocation, sized below the process memory directive |
R error cannot allocate vector of size in an RNA-seq step | R data objects exceed allocation | Read the requested size in the error message, compare to allocation | Raise allocation, and reduce object sizes or process in batches |
nextflow config -flat shows a memory value you did not set | Config override in a profile or stale file | Run nextflow config -flat and search for memory | Remove or correct the overriding config |
| Task never starts, submission retries in the log | Request exceeds queue or partition limits | scontrol show partition for the queue, compare with your request | Lower the request or select a high memory partition |
| Nextflow itself dies with a Java heap traceback | Launcher JVM heap exhausted | Error appears in .nextflow.log, not in task logs | Set NXF_OPTS with a larger -Xmx |
| Works on small test data, fails on full cohort | Resource defaults sized for test profiles | Run one sample of the failing type alone | Set memory as a function of input where possible |
A Diagnostic Sequence You Can Follow
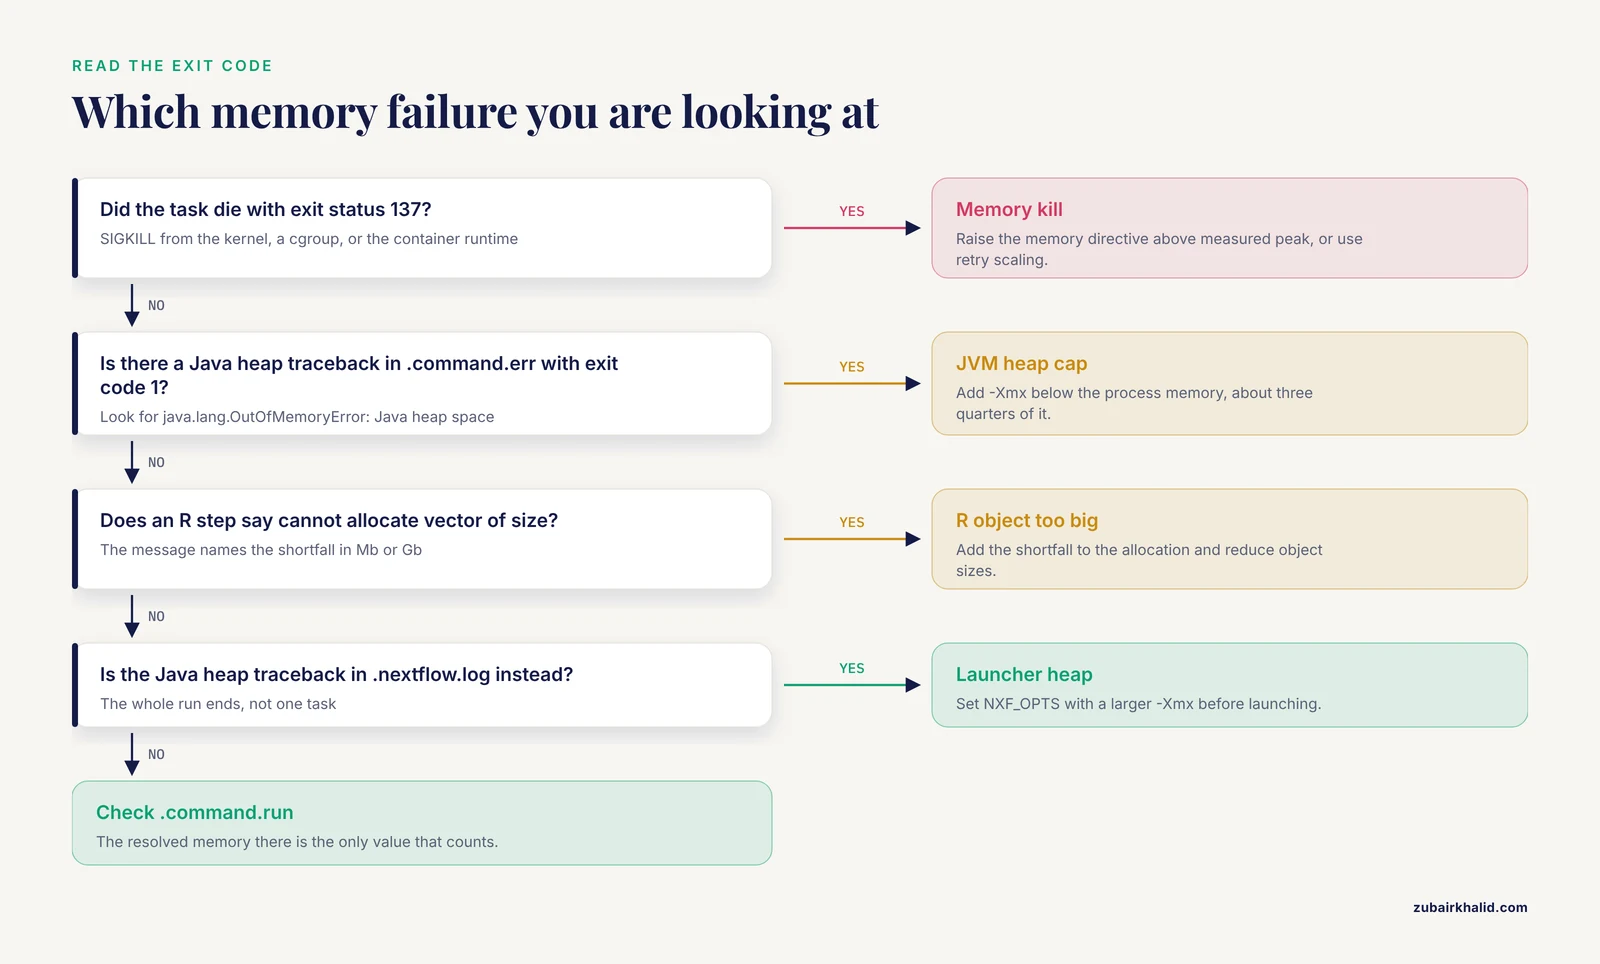
Debugging proceeds fastest when you narrow the error space systematically rather than changing settings at random. Educational research on debugging consistently finds that a structured process beats trial and error, both for learning the skill and for producing correct fixes, and that effective debuggers iteratively narrow down where the fault can be before touching anything. Reviews of debugging instruction describe the same core loop of reproducing the error, localizing it, and testing one hypothesis at a time [4]. Apply that loop here.
- Read the exact failure. Find the failed task in
.nextflow.log. Record the process name, exit code, and theworkdirectory path Nextflow prints.
- Go into the work directory and read the artifacts. Nextflow writes
.command.sh(the script that ran),.command.run(the wrapper, which shows the actual memory flag passed to the scheduler or container),.command.err,.command.out, and.exitcode. The.command.runfile is the ground truth for what memory was actually requested. Everything upstream is a claim. This file is a fact.
- Classify the exit code. 137 points to a memory kill by the kernel, cgroup, or container runtime. 1 with a Java heap traceback points to a JVM cap. 1 with an R allocation error points to R. 143 points to a time or external termination.
- Confirm the kill source. On the compute node or through your cluster logs, look for the OOM killer record.
dmesg -T | grep -i "killed process"on the node shows which process was killed and its size. In SLURM,sacct -j JOBID -o JobID,State,MaxRSSgives the peak memory used before the kill.
- Measure real usage of the same step on a smaller or succeeded sample. The trace report (described below) and
sacctMaxRSS tell you how much memory the step actually used when it worked. Your new memory setting should sit comfortably above that peak, not exactly at it.
- Change one thing and rerun the single failed task. Nextflow caches completed tasks, so with
-resumea rerun skips everything that succeeded and retries only the failed process. This makes each fix cheap to test.
A safety note for shared systems. Never run memory stress testing, large manual reproductions of a failing command, or repeated full pipeline launches on a cluster login node. Login nodes are shared services, and a memory hungry process there can degrade access for every user and commonly leads to account suspension. Submit interactive jobs with srun or run on a dedicated compute node instead.
How to Fix a Nextflow Out of Memory Error: Tuning Memory Limits
Static memory directives for known workloads
The direct fix is to raise the memory directive on the failing process. In the pipeline script:
process ALIGN {
    memory '64 GB'
    cpus 8

    """
    hisat2 -p ${task.cpus} -x index/genome -1 ${reads} -2 ${reads[7]} | samtools sort -@ ${task.cpus} -o sorted.bam
    """
}
Values use the Nextflow syntax GB, MB, or KB (for example 16.GB). The dot form is conventional and unambiguous. Pick a value above the measured peak from your diagnostic step, with headroom. If the step used 41 GB peak, request 64 GB, not 42 GB, because peaks vary between samples and allocators are not perfectly precise.
Raising memory without raising cpus is usually fine, but be aware that many tools scale memory use with thread count, so if you also raise cpus, raise memory proportionally.
Labels and config files: the scalable approach
Editing process blocks inside the pipeline script is fine for a single fix but does not scale. The nf-core convention, widely adopted across community pipelines, is to attach labels to processes and set resources per label in a config file. This lets one config file drive every process. EXCON, an Eco Flow community Nextflow pipeline, takes exactly this approach of centralized configuration with minimal user setup [3], and it is the pattern to copy for your own workflows.
In the pipeline script:
process ALIGN {
    label 'process_high'
    ...
}
In nextflow.config:
process {
    withLabel:process_low {
        memory = 4.GB
        cpus = 2
    }
    withLabel:process_medium {
        memory = 16.GB
        cpus = 6
    }
    withLabel:process_high {
        memory = 64.GB
        cpus = 12
    }
}
You can also target a single process by name with withName:'ALIGN'. The label approach wins when the same tool appears in several modules or when you maintain the pipeline across teams. To see the resolved configuration at any time, run nextflow config -flat and confirm your values survived any overrides.
Dynamic retry: automatic memory escalation
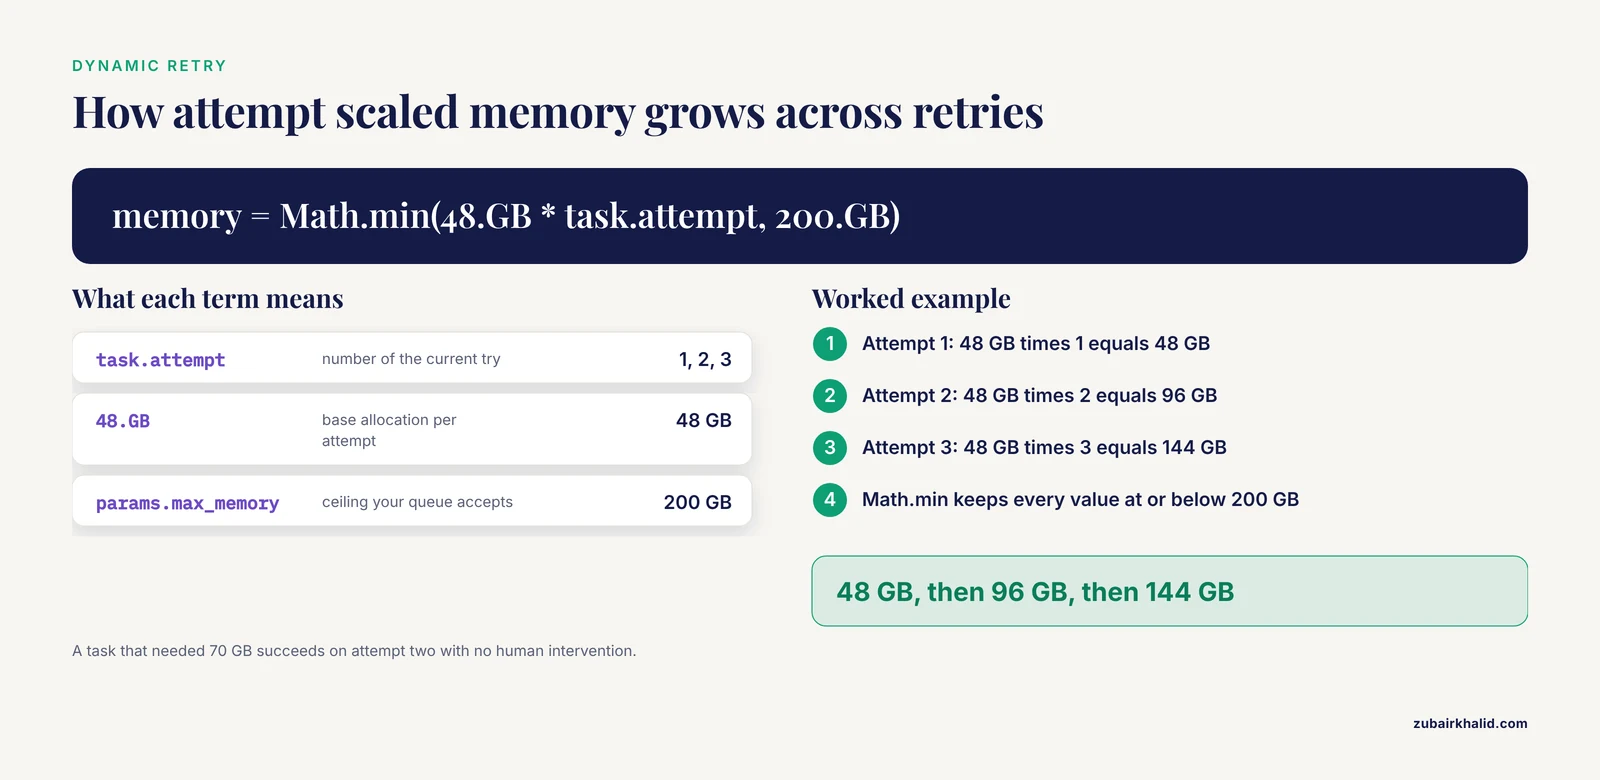
The single most effective pattern for out of memory errors in Nextflow is the retry strategy with an attempt multiplier. Nextflow tracks how many times a task has run in task.attempt. You can scale resources with the attempt and instruct Nextflow to retry on failure:
process {
    withLabel:process_high {
        memory = { 48.GB * task.attempt }
        errorStrategy = 'retry'
        maxRetries = 2
    }
}
With this configuration, the first attempt runs with 48 GB, the second with 96 GB, and the third with 144 GB. If the first attempt dies with exit 137, Nextflow resubmits the identical task with doubled resources automatically. A task that genuinely needed 70 GB now succeeds on attempt two without any human intervention. This pattern, combined with a ceiling, is standard practice in production pipelines because memory requirements are data dependent and cannot always be predicted in advance. DNAharvester applies an analogous adaptive principle at the tool level, selecting among aligners based on the characteristics of each input rather than assuming one setting fits all specimens [2].
Always combine the multiplier with a cluster aware ceiling so you do not request more than the partition allows:
params.max_memory = 200.GB
process {
    withLabel:process_high {
        memory = { Math.min(48.GB * task.attempt, params.max_memory as long) }
        errorStrategy = 'retry'
    }
}
The Math.min expression caps the escalation at the largest allocation your queue accepts. Adjust the ceiling to your cluster.
Raising the JVM heap inside Java tools
When the traceback says Java heap space, add an explicit heap cap to the tool invocation. The _JAVA_OPTIONS environment variable is read by every JVM on start, which makes it a convenient way to set the heap for a whole task:
process MARKDUP {
    memory '32 GB'

    """
    export _JAVA_OPTIONS="-Xmx28g"
    picard MarkDuplicates -I sorted.bam -O dedup.bam -M metrics.txt
    """
}
Size the heap below the process memory directive, because the JVM needs memory outside the heap for its own runtime structures. A common rule of thumb is to set the heap at about three quarters of the allocation. With a 32 GB allocation, -Xmx28g leaves room for the JVM overhead. If you set the heap equal to or above the allocation, the container or cgroup will kill the task before the JVM fills its heap, and you will be back to exit 137 with a bigger number.
This applies to GATK, Picard, VEP, snpEff, and any other Java tool. Check the tool documentation for whether it exposes its own memory flag, and prefer that flag where it exists.
Fixing RNA-seq memory failures in R
For R based steps, raising the allocation is the first fix. Beyond that, restructure the analysis so that peak memory drops. Standard practices include importing transcript level estimates with tximport rather than reading raw large files into R, subsetting the count matrix to genes of interest before transformation, processing single cell data in batches, and converting large matrices to more compact types where the analysis allows. If an R step prints cannot allocate vector of size 8.5 Gb, that number is a direct measurement of the shortfall. Add it to your current allocation and request the sum.
The most reliable RNA-seq fix, though, is per process sizing. Alignment and quantification steps and the differential expression step have completely different memory profiles, and bundling them under one label guarantees that one of them is misfit. Give the R steps their own label with their own memory value.
Matching the executor and queue
If your request exceeds what the queue grants, no amount of directive tuning helps until you either lower the request or move to a partition that provides the memory. Check the partition limits with scontrol show partition PARTITION_NAME, and compare with scontrol show node NODE_NAME for actual node capacity. If your cluster has a bigmem or highmem partition, add a profile that routes high memory processes there. Pipelines intended for portability across environments, like the ones referenced above that run on local, HPC, and cloud infrastructure [3] and the demultiplexing pipeline deluxpore, which was benchmarked across many replicate libraries before release [5], get this right by shipping per environment profiles. Do the same for your own workflow.
Fixing the Nextflow launcher heap
For launcher level exhaustion, set the heap before launch:
export NXF_OPTS="-Xms1g -Xmx8g"
nextflow run my_pipeline -profile slurm -resume
-Xms sets the initial heap and -Xmx the maximum. Four to eight GB covers nearly all launcher needs. If a launcher OOM persists at 8 GB, look for channel patterns in the workflow script that materialize very large collections, since the script design is then the real problem. Conversational and assisted approaches to debugging code have been shown to help practitioners work through errors iteratively [6], but for this particular failure the fix is structural: split channels, avoid re reading the same large channel, and let file paths flow instead of file contents.
Verifying the Fix
After changing a memory setting, rerun with -resume. Cached tasks complete instantly and Nextflow executes only the failed process and everything downstream of it. Watch the retry behavior if you enabled it. The .nextflow.log line for the retried task shows the new memory value being submitted, which confirms your config change took effect.
Then measure. Enable the trace and timeline reports in your config so every run records actual usage:
trace {
    enabled = true
    file = 'trace.txt'
}
timeline {
    enabled = true
    file = 'timeline.html'
}
The trace file lists one row per task with the requested resources and the exit status. Cross reference it with sacct MaxRSS values to see the gap between requested and used memory across your whole pipeline. That gap is your tuning signal. Large gaps mean wasted allocation, which on shared clusters costs scheduling priority and wall time. Small or negative gaps (request less than or equal to usage) mean future failures.
Benchmarking discipline matters here. When deluxpore's developers validated their demultiplexing strategy, they did it across eighteen replicates rather than a single example [5]. Treat your memory tuning the same way. A fix validated on one sample is a hypothesis. A fix validated on the largest sample in your dataset, plus a rerun of the full cohort, is a fix.
Common Mistakes and Limitations
Setting the JVM heap equal to the container limit. This is the most frequent self inflicted wound after the initial fix. A -Xmx equal to the process memory guarantees the runtime kills the process while the JVM believes it still has room. Keep the heap meaningfully below the allocation.
Assuming the first fix is the last. Memory requirements vary by sample. A single sample rerun proves nothing about the full cohort. Validate on your largest inputs before declaring the pipeline stable.
Confusing exit 137 with a code bug. Exit 137 is nearly always resource termination. People waste hours reading tool source code for a bug that does not exist. Check the memory path first, code second.
Ignoring the .command.run file. If you set memory in a config, a profile, and a directive, only the resolved value in .command.run counts. People tune the wrong file because they never look at what was actually submitted.
Over requesting on shared queues. Requesting 200 GB for a step that peaks at 12 GB slows your own scheduling and everyone else's. Use measured MaxRSS, not round numbers, to size allocations.
A limitation of this article: memory behavior differs across executor versions, container runtimes, and scheduler configurations, and the exact enforcement details on your system depend on how your administrators configured cgroups and the batch system. The diagnostic sequence above is designed to reveal your local truth. Individual production incidents may require system administrators or pipeline maintainers to resolve, particularly where queue policies are involved.
Prevention Practices
Size memory from measurement, not guesswork. Enable trace reports from the first run of any new pipeline and record peak usage per process. Keep those numbers in your pipeline documentation.
Use the retry pattern everywhere it applies. errorStrategy = 'retry' with an attempt scaled memory multiplier converts a whole class of data dependent failures from hard stops into automatic retries. It costs wall time on retry, not human time.
Separate labels for memory classes. Every process that plausibly has a different memory profile gets its own label. One shared memory value across a pipeline is a latent failure.
Pin your configuration and versions. Record the Nextflow version, container versions, and the resolved config with your run outputs. Reproducible pipelines, the kind that get published and reused by others [3], document their resource model explicitly so the next user does not rediscover these failures from scratch.
Test with your real extremes. A pipeline is ready for production when it has processed the largest genome, the deepest sequenced sample, and the biggest cohort you plan to run. Test profiles with deliberately small data are for development, not for capacity planning.
Frequently Asked Questions
What does exit status 137 mean in a Nextflow task?
It means the task was killed by SIGKILL, and in practice that almost always means the Linux kernel, a cgroup, or the container runtime terminated the process for exceeding its memory limit. Confirm by looking for an out of memory record in the node's kernel log or your scheduler's accounting records.
How do I set a memory limit for one process in Nextflow?
Add memory '64 GB' inside that process block for a quick fix, or use withName:'PROCESS_NAME' { memory = 64.GB } in your config file to keep the pipeline script clean. Run nextflow config -flat to confirm the value resolves as intended.
Why does my pipeline fail on some samples but not others?
Memory requirements scale with data. More reads, a larger genome, more cells, or higher duplication rates all raise peak memory. A process that fits typical samples will fail on outliers, which is why dynamic retry with an attempt scaled memory multiplier is the recommended pattern.
How much memory should I request for RNA-seq alignment?
It depends on the aligner and the genome, and no single number is correct. Measure peak usage with the trace report or scheduler accounting on your data, then request a value with comfortable headroom above that peak. Star style aligners that load the genome into RAM need far more than aligners that stream, so check your specific tool's documentation.
Does raising memory slow my pipeline down or cost more?
Larger allocations can increase queue wait time on shared clusters and may reduce the number of concurrent jobs if your config also constrains total resources. The efficient target is a value comfortably above measured peak usage, not the maximum the queue offers.
What is the difference between the Nextflow JVM running out of memory and a task running out of memory?
Task failures print errors in the work directory logs and kill one process. Launcher failures print a Java heap traceback in .nextflow.log and terminate the whole run. Fix task failures with memory directives and tool heap flags. Fix launcher failures with the NXF_OPTS environment variable.
How do I find out how much memory a task actually used?
On SLURM, run sacct -j JOBID -o JobID,State,MaxRSS,Elapsed where JOBID is the scheduler job for that task. MaxRSS is the peak physical memory the job used. Alternatively, enable the Nextflow trace report, which records per task resource data for every run.
Can Nextflow automatically retry a failed task with more memory?
Yes. Set errorStrategy = 'retry' and write the memory directive as a closure such as memory = { 48.GB * task.attempt }, which doubles the allocation on each retry. Add maxRetries to bound the escalation and cap the value at your largest allowed allocation.
Sources
- Abstract LB160: SMURFS: A comprehensive Nextflow pipeline for consensus somatic variant detection
- DNAharvester: a nextflow pipeline for analysing highly degraded DNA from ancient and historical specimens
- EXCON: a scalable, reproducible Nextflow pipeline for CAFE-based gene EXpansion and CONtraction analysis
- Decoding Debugging Instruction: A Systematic Literature Review of Debugging Interventions
- deluxpore: a Nextflow pipeline for demultiplexing Illumina dual-indexed Nanopore libraries
- Cocreating an Automated mHealth Apps Systematic Review Process With Generative AI: Design Science Research Approach