How to Monitor and Optimize Resource Usage in Nextflow on HPC
By Dr. Zubair Khalid, DVM, MS, PhD ·

Nextflow is one of the most widely used bioinformatics workflow managers, and on a shared HPC cluster its resource settings decide whether your run finishes overnight or fights the queue for a week. Tasks that request too little memory get killed by the scheduler. Tasks that request too much sit waiting for nodes that will mostly idle. The fix is a measurement loop: record what each task actually uses, compute per-process efficiencies, adjust the cpus, memory and time directives, and let retries handle the outliers.
This guide walks through that loop with real commands. By the end you will be able to:
- Enable Nextflow's built-in trace, report and timeline outputs
- Read per-task CPU, memory and I/O measurements and cross-check them against Slurm accounting
- Compute per-process efficiency numbers and right-size your requests
- Configure a retry ladder that resubmits failed tasks with escalating resources
- Avoid the mistakes that waste allocations on shared clusters
You need on hand: a cluster account with a Slurm, SGE or LSF scheduler, a recent Nextflow release (23.10 or newer covers everything shown here), a supported Java runtime (Java 17 is the safe choice for current releases, loaded through your module system), and Apptainer or Conda for software environments. All commands assume Slurm, the most common scheduler at US academic centers. The same measurements and settings transfer to other schedulers with small syntax changes.
Why Resource Usage Monitoring Matters on HPC
Clusters allocate whole nodes to jobs to avoid contention, and that policy carries a risk of underutilization. A utilization study of the JUWELS supercomputer found CPU compute usage already close to optimal on CPU-only nodes, but substantial scope for co-scheduling CPU-based jobs on GPU-accelerated nodes, with memory capacity and interconnect bandwidth sufficient for shared operation. The practical lesson for a pipeline author is simple: the scheduler cannot fix a bad request, it can only queue it or grant it.
Most of what you can improve sits in your configuration. An empirical study of configuration-related performance problems found that 49% of performance issues can be improved or fixed through configuration changes, and that 71% of configurations affect performance by changing resource usage [1]. In Nextflow, your process directives are exactly those configurations. Measuring per-task resource usage tells you which directive to touch.
There is also a cost argument. Efficient resource utilization in workflow management systems keeps costs low and improves processing times for large-scale bioinformatics workflows, which is why uniform, aggregated metrics from containerized tasks have become a research topic in their own right [2].
What Nextflow Records for Every Task
Nextflow writes one work directory per task under the work directory (set with the -w flag or workDir). For a task with hash prefix 2c/5f8a1b you will find:
.command.sh, the task script itself.command.run, the scheduler submission script Nextflow generated, including the scheduler request.command.errand.command.out, the task stderr and stdout.exitcode, the exit status
On top of that, four opt-in report artifacts cover monitoring:
| Artifact | How to enable | What it gives you |
|---|---|---|
| , - | , - | , - |
| trace.txt | trace { enabled = true } or -with-trace | One row per task with %cpu, peak_rss, realtime and I/O counters |
| report.html | report { enabled = true } or -with-report | Per-process CPU, memory and time plots plus a run summary |
| timeline.html | timeline { enabled = true } or -with-timeline | Every task as a bar over wall-clock time, exposes serialization |
| dag.html | dag { enabled = true } or -with-dag | The workflow graph, useful for spotting fan-out layers |
| Work directory | Automatic | .command.sh, .command.run, .command.err, .command.out, .exitcode per task |
nextflow log | Automatic | Query the tasks of past runs from the command line |
Two more sources of truth live outside the launch directory. The .nextflow.log file records everything the driver did, including scheduler submissions and errors, rotating to .nextflow.log.1 and beyond. And the nextflow log command queries completed runs, which matters when a collaborator asks what a pipeline from last month actually consumed.
Monitoring Nextflow Resource Usage on HPC, Step by Step
The walkthrough uses the nf-core/rnaseq test profile because it finishes in minutes on a few nodes, but every command works the same for your own pipeline.
Step 1: Prepare the environment
module load nextflow
module load java/17
module load apptainer

export NXF_OPTS="-Xms512m -Xmx2g"
export NXF_WORK=/scratch/zkhalid/nf-work
tmux new -s nf-rnaseq
NXF_OPTS caps the driver JVM so the launcher process never grabs more than 2 GB on the login node. NXF_WORK puts the work directory on the parallel scratch filesystem rather than your NFS home directory, which matters for staging speed and for your quota. Run the driver inside tmux so a dropped SSH session does not kill the run. Module names differ by site, so check with module spider nextflow or your local documentation.
Step 2: Point Nextflow at the scheduler
Create a nextflow.config in your launch directory:
workDir = '/scratch/zkhalid/nf-work'

process {
    executor = 'slurm'
    queue = 'standard'
    clusterOptions = '-A zkhalid'
    cpus = 2
    memory = 8.GB
    time = 2.h
}
Each directive does one job. executor selects the Slurm backend. queue becomes the partition request. clusterOptions passes raw options to sbatch, here the -A account flag for billing. cpus, memory and time are the per-task scheduler requests, and Nextflow translates them into the sbatch options for cores, memory and walltime. Check partition names with sinfo -s before you commit to one.
Verify the resolved configuration before running anything:
nextflow config -flatprocess.executor = 'slurm'
process.queue = 'standard'
process.clusterOptions = '-A zkhalid'
process.cpus = 2
process.memory = '8 GB'
process.time = '2h'Recent releases also ship nextflow inspect, which prints the resolved process settings for a pipeline without submitting anything. That is a fast way to review what a nf-core pipeline would request on your cluster before you spend a single core-hour.
Step 3: Turn on the built-in resource reports
Add these blocks to nextflow.config:
trace {
    enabled = true
    file = 'trace.txt'
    overwrite = true
    fields = 'task_id,native_id,name,status,exit,realtime,%cpu,peak_rss,rchar,wchar'
}

report {
    enabled = true
    file = 'report.html'
}

timeline {
    enabled = true
    file = 'timeline.html'
}

dag {
    enabled = true
    file = 'dag.html'
}
overwrite = true matters. Without it, Nextflow refuses to start a second run in the same directory and reports that the trace file already exists. The same option exists for the report and timeline scopes. The trace file is appended as tasks finish, so tail -f trace.txt gives you a live feed during long runs.
Step 4: Run a small test first
nextflow run nf-core/rnaseq -profile test,apptainerThe test profile uses tiny inputs so the run finishes quickly. On an air-gapped cluster, clone the pipeline repository first and run from the local path. Expected console output looks like this (your run name and revision hash will differ):
N E X T F L O W  ~  version 24.10.0
Launching `nf-core/rnaseq` [prickly_curie] DSL2 - revision: 3143d1f0d9
...
[2c/5f8a1b] Submitted process > NFCORE_RNASEQ:RNASEQ:FASTQC (test_minimal_R1)
Each bracketed pair like 2c/5f8a1b is the task hash prefix and maps to work/2c/5f8a1b... in the work directory. Copy it when a task fails, because it is the fastest way to find that task's files.
Step 5: Read the trace file
With the fields set in step 3, trace.txt contains tab-separated rows like:
task_id	native_id	name	status	exit	realtime	%cpu	peak_rss	rchar	wchar
2	4712345	FASTQC (sampleA)	COMPLETED	0	12m 2s	112.3	1420.5 MB	3.4 GB	0.9 GB
3	4712346	BWA_MEM (sampleA)	FAILED	137	1h 58m	196.4	6.1 GB	48.2 GB	12.5 GB
The columns that drive optimization:
native_idis the scheduler job ID, the key that links Nextflow to Slurm.realtimeis wall-clock time from task start to finish.%cpuis average CPU utilization over the task lifetime, expressed against one core, so 200 means two cores fully busy.peak_rssis the peak resident set size, the physical RAM the task actually touched.peak_vmem(in the default field set) is peak virtual memory, address space reserved rather than used. It is usually several times larger than peak_rss. Never size requests against it.rcharandwcharare bytes read and written through the I/O layer, including cached traffic. They expose staging-heavy tasks.
Two caveats about these numbers. Nextflow samples /proc on the compute node at fixed intervals, so a brief allocation spike can be missed. And %cpu is an average over the whole task, so a tool that runs single-threaded for ten minutes and multithreaded for two shows a blended number.
Step 6: Cross-check with Slurm accounting
squeue -u $USER -o "%.10i %.24j %.8T %.10M %.4D %R"
sacct -j 4712345 -o JobID,JobName%40,AllocCPUS,Elapsed,MaxRSS,State
seff 4712345
The sacct output looks like this:
       JobID    JobName  AllocCPUS    Elapsed     MaxRSS  State
------------ ---------- ---------- ---------- ---------- ----------
   4712345   nf-FASTQC          2   00:12:10   1420500K COMPLETED
 4712345.bat+      batch          2   00:12:10   1418300K COMPLETED
 4712345.ext+     extern          2   00:12:10          0 COMPLETED
MaxRSS is the peak resident set size recorded by Slurm accounting, in kilobytes, and it should land close to the trace peak_rss with differences explained by sampling. seff turns the same records into efficiency percentages:
CPU Efficiency: 56.10% of 1460 core-seconds computed effectively
Memory Efficiency: 17.75% of 8.00 GB (1.42 GB used)
Accounting has to be configured on the cluster (slurmdbd with job accounting gathering) for MaxRSS to populate. If sacct shows zeros for everything, ask your administrators rather than assuming the tasks used no memory. For a job that is still running, sstat -j 4712345.batch -o MaxRSS,AveCPU reports the same counters live.
Step 7: Investigate failed and killed tasks
nextflow log -F 'status = FAILED' -f process,exit,status,peak_rssprocess exit status peak_rss
BWA_MEM (sampleA) 137 FAILED 6.1 GBThe exit status is the diagnostic. 137 means the process received SIGKILL, which on Slurm almost always means the out-of-memory killer fired. 143 means SIGTERM, which a walltime cancellation or a manual scancel 4712346 produces (Nextflow then treats the task as failed and retries it if you have configured retries). The scheduler explains itself in the task stderr:
grep -i "exceeded memory\|DUE TO TIME LIMIT" work/2c/5f8a1b*/.command.errslurmstepd: error: Job 4712346 exceeded memory limit 8192M on node cn-12, being killedor
slurmstepd: error: *** JOB 4712346 ON cn-12 CANCELLED AT 2026-11-11T10:04:11 DUE TO TIME LIMIT ***Notice the teaching moment in the sample trace above. The BWA_MEM task was killed at the 8 GB cgroup limit while the trace recorded a 6.1 GB peak_rss. The sampler missed the spike, or the cgroup counted memory the sampler did not attribute to the process. Treat peak_rss as a lower bound and keep real headroom.
Step 8: Turn measurements into settings
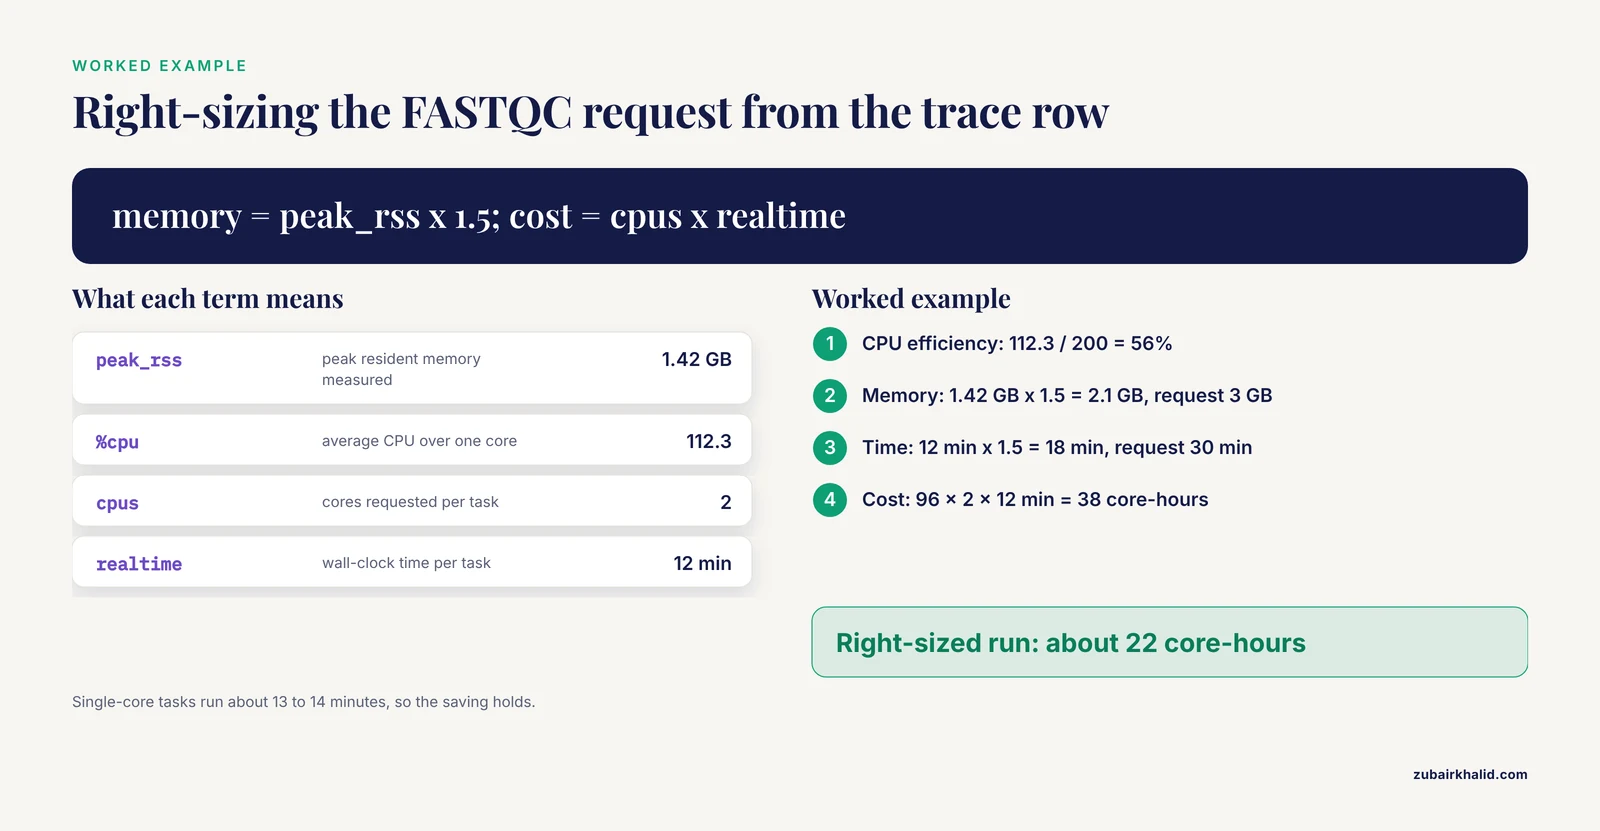
Take the FASTQC row: requested 2 cpus and 8 GB, measured 12 minutes, %cpu 112.3, peak_rss 1.42 GB.
| Quantity | Formula | Worked example (FASTQC row) |
|---|---|---|
| , - | , - | , - |
| CPU efficiency | %cpu ÷ (cpus × 100) | 112.3 ÷ 200 = 56% |
| Memory efficiency | peak_rss ÷ requested memory | 1.42 GB ÷ 8 GB = 18% |
| Memory request | peak_rss × 1.3 to 1.5, rounded to cluster tiers | 1.42 GB × 1.5 ≈ 2.1 GB, request 3 GB |
| Time request | 95th percentile realtime × 1.5 | 12 min × 1.5 = 18 min, request 30 min |
| Cost per task | cpus × realtime | 2 × 12 min = 24 core-minutes |
The right-sized override:
process {
    withName:FASTQC {
        cpus = 1
        memory = 3.GB
        time = 30.min
    }
}
Across 96 samples, the original request costs 96 × 2 cores × 12 minutes = 38 core-hours. The right-sized one costs 96 × 1 × 13.5 ≈ 22 core-hours, and the memory footprint per concurrent task drops from 8 GB to 3 GB, which usually lets roughly twice as many tasks run at once on the same partition. Expect the single-core version to run slightly longer, about 13 to 14 minutes here, because %cpu showed the two threads were only 56% busy.
Step 9: Verify before you scale up
Check four things:
nextflow config -flatshows the values you meant to set, not the values you think you set.- The trace row count matches the number of tasks the console reported, and every status is COMPLETED or CACHED.
- Trace peak_rss and
sacctMaxRSS agree within sampling tolerance for a few spot-checked tasks. - After right-sizing, rerun the test profile and confirm no out-of-memory kills and CPU efficiencies above roughly 60%.
Then scale up. Launch the full dataset with -resume so completed tasks are reused where inputs allow, archive trace.txt with the run name and date, and review report.html once the run finishes.
Optimizing Resource Requests at Scale
Right-size memory from your own run history
Collect trace.txt across runs and keep per-process maxima of peak_rss. Request the observed maximum times 1.3 to 1.5, rounded up to a value your cluster's memory tiers like. History beats intuition, and the literature backs history-driven estimation. A prediction method built on historical job records from production LSF clusters reduced average prediction errors by up to 40% for nearly 90% of large-memory jobs, while cutting model training cost by more than 30% [3]. You do not need their model to benefit. A spreadsheet of per-process maxima from your own traces captures most of the same signal.
Workflow structure matters too. Resource estimation for scientific workflows improves when the method accounts for the layered structure of the workflow, an approach validated against actual usage in a real HPC environment with traces from bioinformatics and astronomy workflows [4]. Practically, that means estimating per process and per workflow stage rather than fitting one global memory number to the whole pipeline.
Right-size CPUs and time
Set cpus to what the tool can actually use, and pass it into the command:
process BWA_MEM {
    tag 'sampleA'
    cpus 8

    """
    bwa mem -t ${task.cpus} reference.fa reads_R1.fq.gz reads_R2.fq.gz > aligned.sam
    """
}
Then check %cpu in the trace. A task with cpus = 8 showing %cpu around 100 is using one eighth of its allocation. Either drop the request or pick a tool and parameters that parallelize. The same discipline applies at the pipeline level. An execution-driven auto-tuning study of task-based runtimes found that high performance rarely requires the full core budget, with a 40-task graph matching full-core performance within 1.73% using a smaller active core set [5]. Measured trimming beats assuming the maximum.
For time, request the 95th percentile of realtime across historical tasks times 1.5, not the absolute maximum, so one pathological sample does not force every task into a long-queue partition. Keep the retry ladder as the safety valve for the tail.
Build a retry ladder
process {
    errorStrategy = { task.exitStatus in 137..140 ? 'retry' : 'terminate' }
    maxRetries = 2
    memory = { 4.GB * task.attempt }
    cpus = { 2 * task.attempt }
    time = { 2.h * task.attempt }
}
task.attempt starts at 1, so this requests 4 GB and 2 cores on the first try, 8 GB and 4 cores on the second, 16 GB and 8 cores on the third. The errorStrategy pattern, taken from the Nextflow documentation, retries only on the exit statuses in the 137 to 140 range that indicate resource kills and terminates on real software errors, so you do not burn retries on a broken command.
Two details separate a ladder that works from one that loops. Without dynamic directives, retry resubmits the identical request and fails identically. And once maxRetries is exhausted the pipeline still fails, so pair the ladder with sensible base requests rather than using retries as the primary sizing strategy.
Use labels and per-process overrides
nf-core pipelines ship a label convention (process_low, process_medium, process_high, process_long, process_high_memory) so one shared config can size hundreds of processes. Override at the level you need:
process {
    withLabel:process_high {
        cpus = 16
        memory = 64.GB
        time = 24.h
    }
    withName:BWA_MEM {
        cpus = 8
        memory = 32.GB
    }
}
nf-core pipelines also expose max_cpus, max_memory and max_time parameters that cap every request at once, which is how you adapt a pipeline to a smaller partition without editing its source. Set them in a config file rather than on the command line so they are version controlled.
Watch I/O and staging
The rchar and wchar columns expose tasks that move far more bytes than their inputs suggest, usually a staging or temp-file problem. Keep the work directory on the parallel scratch filesystem, publish final outputs to project space with publishDir, and avoid writing intermediates to your NFS home. On shared filesystems, timestamp churn can also invalidate Nextflow's content-hash cache, and the cache = 'lenient' directive relaxes the strictness for those cases.
Three habits compound across all of this: enable the trace on every run, archive each trace with the run name, and review report.html before scaling a pipeline up.
Cluster-Level Monitoring Beyond Single Runs
Per-run artifacts answer per-run questions. For questions like which group is saturating the scratch filesystem or whether a node misbehaves, you need cluster-level collection.
Start by making your own traces durable. Copy trace.txt from every run into a shared archive with the run name and date, then aggregate per process. Open-source measurement and analysis pipelines for HPC resource usage exist precisely because this kind of auditing pays off across users and projects [6].
Centers go further by collecting node-level counters continuously. Modeling that data as a three-way tensor over nodes, metrics and time, then using the reconstruction error of a low-rank decomposition as an online performance metric, flagged anomalies that correlated with critical errors in system logs on the Lonestar4 system at the Texas Advanced Computing Center. The dynamicMF method compresses the same kind of tensor into a low-dimensional temporal signal per node for real-time anomaly detection. When you want a single number per node, the Load Score of Computing Node index condenses multiple utilization metrics into one score, with PCA and entropy weighting as two ways to set the metric weights [7].
Operations teams often centralize this in a log stack. An Elastic Stack based framework built for a national HPC infrastructure, combining shell probes with Elasticsearch, Logstash and Kibana, reported 99.41% measurement accuracy, overhead of about 2.8% of the monitoring interval, CPU load reductions of more than 99% in overload scenarios, and a 0.65 second average notification delay [8].
Two research directions round out the picture. Schedulers leave resources idle, and control-theoretic feedback loops, from PID to model-free control, can inject small jobs to harvest those idle cycles while balancing harvesting against performance, as demonstrated in the CiGri grid harvesting system [9]. And because energy is now a first-class constraint, measurement suites that combine power and performance data can locate inefficient resource usage and drive automated tuning for energy efficiency, with hard power limits changing how efficiency itself is measured.
If your organization runs more than one workflow manager, the Cloud Monitoring Kit reference architecture uses task labels to produce uniform, aggregated metrics from containerized tasks scheduled by different systems, demonstrated with a transcriptomics workflow on two workflow management systems [2]. The labeling idea generalizes to Nextflow today: keep process names and tags stable and descriptive, and any metrics collector can group by them.
Nextflow vs Snakemake: Choosing a Bioinformatics Workflow Manager
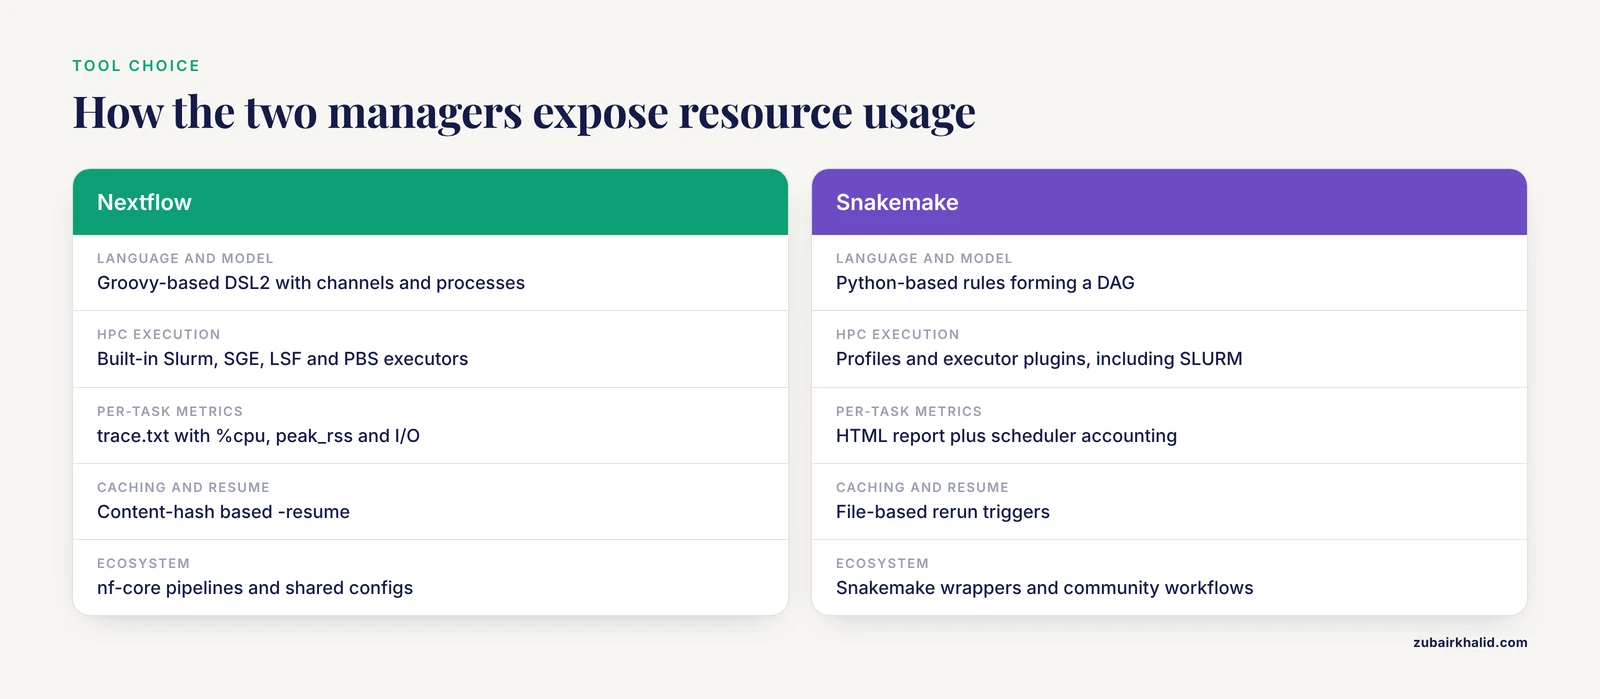
Nextflow and Snakemake are the two open-source bioinformatics workflow managers you are most likely to meet on an HPC cluster, and both can run the same measure, right-size and retry loop. The differences that matter for monitoring:
| Aspect | Nextflow | Snakemake |
|---|---|---|
| , - | , - | , - |
| Language and model | Groovy-based DSL2, dataflow channels and processes | Python-based rules forming a DAG |
| HPC execution | Built-in Slurm, SGE, LSF and PBS executors | Profiles and executor plugins, including a SLURM executor plugin |
| Built-in per-task metrics | trace.txt with %cpu, peak_rss and I/O, plus report and timeline HTML | An HTML report option, with per-job details from scheduler accounting |
| Caching and resume | Content-hash based -resume | File-based rerun triggers |
| Ecosystem | nf-core pipelines and shared configs | Snakemake wrappers and community workflows |
In practice, Nextflow gives you per-task %cpu and peak_rss without any extra tooling, which is why this guide leans on its built-in artifacts. Snakemake users lean on scheduler accounting for the same numbers and get a workflow-level HTML report instead of per-task trace plots. Neither gap is decisive. If your group runs nf-core pipelines, Nextflow is the path of least resistance. If your team lives in Python and wants rule logic next to their analysis code, Snakemake reads more naturally. Both reward the same discipline: measure, right-size, retry, resume.
Common Mistakes and Limitations
- Running the driver on a login node in a bare SSH session. A network drop kills the run. Fix it with tmux or screen, or submit the driver itself as a long-running job.
- Sizing memory against peak_vmem. Virtual memory is reserved address space, often several times RSS. Size against peak_rss.
- Treating trace peak_rss as the true peak. Sampling misses spikes and the cgroup limit counts more than RSS, so tasks die while the trace looks safe, as in the BWA_MEM example above. Keep 1.3 to 1.5 times headroom and cross-check
sacctMaxRSS. - Reading %cpu as a fraction of the requested cores. It is a fraction of one core. A task with
cpus = 8at %cpu 100 wastes seven cores. Divide by cpus × 100. - Setting
errorStrategy = 'retry'with static resources. Every attempt fails identically. Multiply bytask.attempt. - Requesting whole nodes for single-threaded tasks. Set cpus honestly and let the scheduler pack the queue.
- Putting the work directory on NFS home. Slow staging, metadata load on the filesystem, quota exhaustion. Use parallel scratch for work and project space for published results.
- Never cleaning up. Old work directories pile up until the quota kills a run mid-pipeline. Run
nextflow clean -nto preview what would be deleted, thennextflow clean. - Trusting
sacctMaxRSS when accounting is misconfigured. Zeros mean missing accounting, not zero memory. Confirm with administrators and fall back to the trace file. - Copying another site's resource config unchanged. Queue names, memory tiers, filesystem speeds and module builds differ. Rerun the measurement loop on your own cluster.
- Right-sizing after a big run without expecting cache invalidation. Resource directives are part of the task hash, so changing cpus or memory makes
-resumerecompute the affected tasks. Right-size on the test profile first, then scale. - Expecting automatic tuning. Nextflow resubmits exactly what you configured. The feedback loop in this guide is the mechanism, and nothing adjusts resources unless you write the dynamic directives.
Two structural limits remain. Nextflow measures per task, so a process script that runs three tools reports one blended number, and splitting processes is the only way to see inside it. And all of this monitors your tasks, not the cluster. Node health, filesystem saturation and noisy neighbors are center-level questions that need the cluster-level collection described above.
Frequently Asked Questions
How do I monitor CPU and memory usage of a running Nextflow pipeline on HPC?
Enable the trace file with trace { enabled = true } or the -with-trace flag and read trace.txt, which Nextflow appends to as each task finishes, so tail -f trace.txt gives a live view. On the scheduler side, squeue shows your pending and running jobs and sacct -j JOBID -o MaxRSS,Elapsed reports what each finished job used.
What is the difference between peak_rss and peak_vmem in the Nextflow trace file?
peak_rss is the peak resident set size, the physical RAM the task actually touched, while peak_vmem is the peak virtual memory, the address space the process reserved, which is usually several times larger. Size your memory directive against peak_rss, never against peak_vmem.
Why was my task killed for exceeding memory when the trace showed a lower peak_rss?
Because the trace samples /proc at fixed intervals and can miss short allocation spikes, while the scheduler enforces a hard cgroup limit that counts memory beyond the sampled RSS. Treat trace peak_rss as a lower bound, keep 1.3 to 1.5 times headroom, and cross-check with sacct MaxRSS.
How do I make Nextflow retry failed tasks with more memory and CPUs?
Set errorStrategy = 'retry' with maxRetries and make the resource directives dynamic, for example memory = { 4.GB task.attempt } and cpus = { 2 task.attempt }, so each attempt escalates the request. Restrict retries to resource-kill exit statuses with errorStrategy = { task.exitStatus in 137..140 ? 'retry' : 'terminate' }.
How do I find resource usage from a previous Nextflow run?
Run nextflow log -f process,exit,status,peak_rss for the most recent run, or name a run explicitly such as nextflow log furious_einstein -f process,peak_rss. The trace.txt and report.html from that run's launch directory, if they were enabled, hold the full picture.
How can I tell if I am over-requesting CPUs or memory?
Compare %cpu against cpus × 100 and peak_rss against your memory directive in trace.txt, and use seff JOBID for the same comparison from Slurm accounting. Requests running below roughly half utilization are the first candidates to cut.
Is Nextflow or Snakemake better for running workflows on HPC?
Neither is universally better. Nextflow ships built-in per-task trace, report and timeline outputs plus the nf-core pipeline ecosystem, while Snakemake offers Python-native rule logic and cluster executor plugins, and both support the same measure, right-size and retry loop.
Does Nextflow automatically adjust resources between attempts?
No. Nextflow resubmits failed tasks with exactly the resources you configured, and escalation only happens when you write dynamic directives such as memory = { 4.GB * task.attempt }.
Sources
- Detecting Performance Bottlenecks Guided by Resource Usage
- CMK: Enhancing Resource Usage Monitoring across Diverse Bioinformatics Workflow Management Systems
- Practical Resource Usage Prediction Method for Large Memory Jobs in HPC Clusters
- Optimizing Resource Estimation for Scientific Workflows in HPC Environments: A Layered-Bucket Heuristic Approach
- Execution-Driven Auto-Tuning of Static Schedules for Resource-Efficient HPC
- Comprehensive, open-source resource usage measurement and analysis for HPC systems
- Resource Usage Evaluation Study in HPC Cluster
- Design and Evaluation of an ELK Stack-Based Monitoring Framework for Resource Optimization in National HPC Infrastructure
- Autonomic Resource Harvesting in HPC: Control Methods and Their Reusability