Why Are My Nextflow Jobs Failing on the Cluster?
By Dr. Zubair Khalid, DVM, MS, PhD ·

Most Nextflow jobs fail on a cluster for one of two reasons. Either the pipeline never actually reaches the scheduler, or it reaches the scheduler with a resource request too small for the work, and the scheduler or the kernel kills the task. Before you touch the pipeline code, check two things: the exit code of the failed task and the scheduler's own accounting record. Those two facts separate outside kills (memory limits, time limits, jobs bumped by other users) from inside failures (missing commands, bad inputs, software errors), and they point you straight at the right fix.
This guide answers the question every cluster user eventually asks: why are my Nextflow jobs failing on the cluster? It explains how a bioinformatics workflow manager submits work to a scheduler, gives a diagnostic sequence you can finish in about ten minutes, provides a symptom to fix troubleshooting table, walks through the causes from most common to rarest, and closes with the configuration habits that prevent the next failure.
How Nextflow Runs on an HPC Cluster
A bioinformatics workflow manager coordinates many command line tasks as one reproducible run. Nextflow is a workflow manager written in Java, and it uses a small vocabulary you need for diagnosis:
- A process is a template for one step, such as alignment or variant calling.
- A task is one concrete execution of a process for one input item, such as one sample.
- The launcher is the Nextflow process you start with
nextflow run. - The executor is the component that decides where tasks run. The default is
local, which runs tasks as child processes of the launcher. - The scheduler (SLURM, SGE, LSF, PBS) owns the compute nodes. On a cluster you set the executor to
slurm,sge,lsf, orpbsso Nextflow submits each task as a scheduler job. - The work directory holds one numbered folder per task, containing the rendered command, the wrapper the scheduler runs, and the task's output, error, and exit files.
When you launch a run, the launcher reads your scripts and config, copies each task's input files into its folder (staging), submits the task to the scheduler, and records the result in a cache so a later run with -resume can skip finished work. Parallel workflow management systems coordinate scientific executions that run for hours or days on large machines, and the design of this execution control layer, together with the data it manages, determines how well such runs scale [1].
The practical consequence is that two layers can fail independently. The launcher layer (Java, configuration, filesystems, scheduler communication) and the task layer (whatever your command does inside its scheduler job). Most wasted debugging time comes from looking at the wrong layer.
The First Ten Minutes: A Diagnostic Sequence
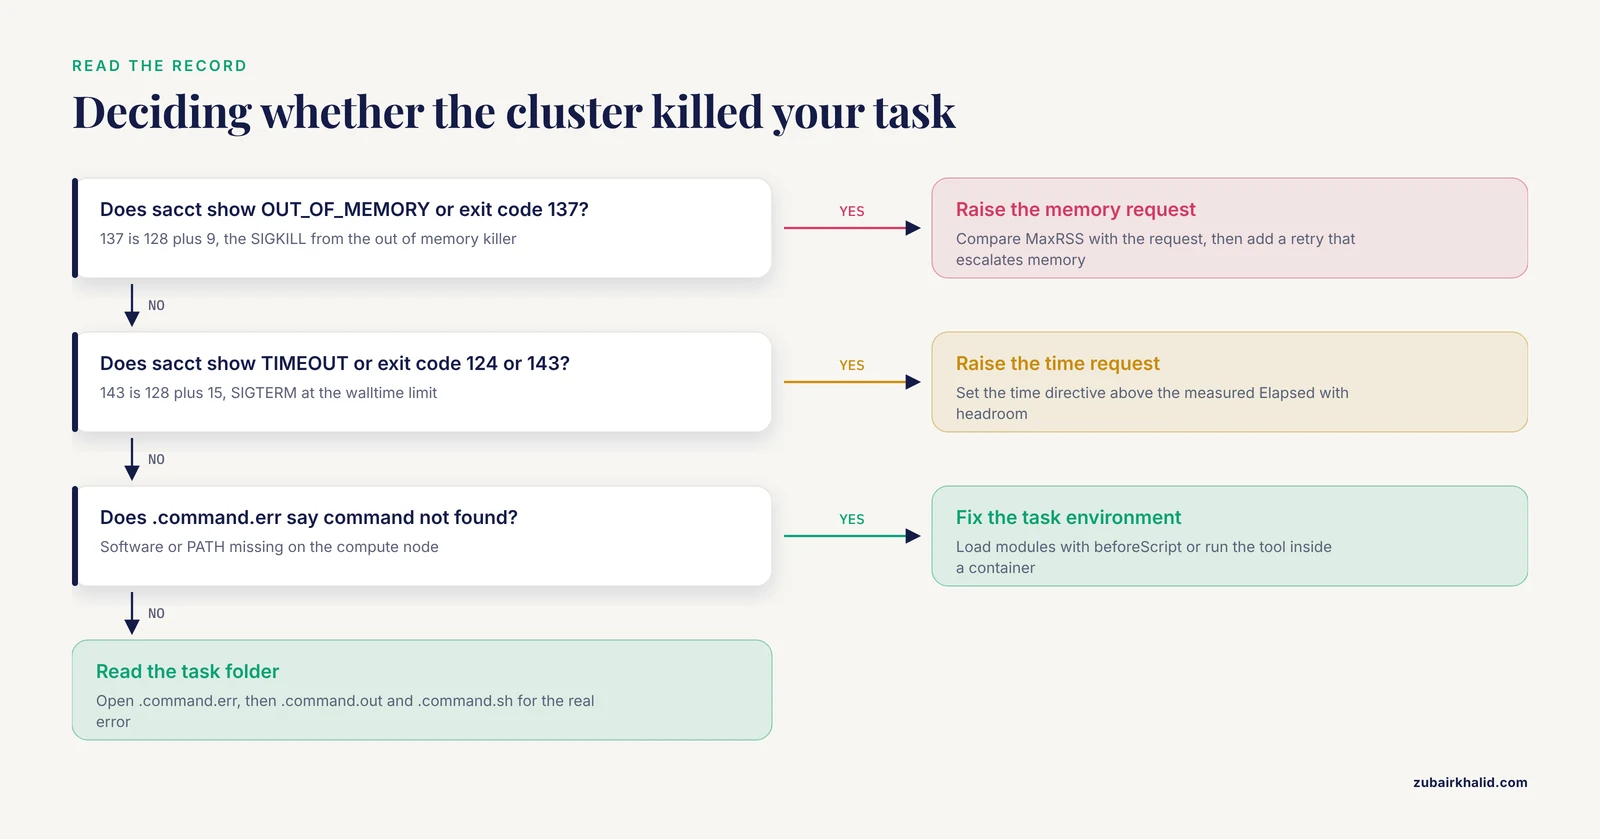
Follow these steps in order. They resolve the majority of cluster failures without guesswork.
- Read the launcher log. Run
tail -100 .nextflow.login your launch directory. Look forSubmitted processlines (proof that tasks reach the scheduler),Errorlines, and any scheduler message such as an invalid queue name. - List task statuses. Run
nextflow log, which prints every executed task with its process name, tag, and status. If you launched with-with-trace, opentrace.txtinstead. It adds the exit code, duration, and memory columns for every task. - Pull the scheduler record. For the failed task's scheduler job ID, run:
sacct -j 123456 -o JobID,State,ExitCode,Elapsed,MaxRSSA State of TIMEOUT or OUT_OF_MEMORY ends the investigation on the spot. MaxRSS is the peak memory the job actually used.
- Open the task folder. From
trace.txtor the log, change into the task's work folder and read the files in this order:.command.err(the task's stderr, the error output stream, where real error messages live),.command.out(standard output),.command.sh(the exact rendered command),.command.run(the scheduler wrapper),.exitcode, and.command.trace(per attempt duration, CPU use, and memory counters). - Compare requested versus used.
scontrol show job 123456shows what was requested.MaxRSSfrom step 3 shows what was used. IfMaxRSSapproaches the requested memory, raise the memory directive. IfElapsedsits at the time limit, raise the time directive. - Reproduce interactively if needed. Grab a compute node and rerun the exact command from
.command.sh:
srun -p batch -c 4 bash
# then, inside that shell
bash .command.sh
Replace batch with a queue name from sinfo. If the command works interactively but fails in the pipeline, suspect environment differences (covered below). If it fails the same way, you have a plain software or input problem.
These records exist because workflow management systems are built around a data layer that serves both fast execution control and later analysis of the run [1]. Reading them in order turns a mysterious failure into a specific one.
Nextflow HPC Job Failed: Symptom to Fix Table
The table covers the failure patterns you will meet on SLURM, SGE, LSF, and PBS clusters. Confirm before you fix, because several symptoms share one cause and several causes share one symptom.
| Symptom | Likely cause | How to confirm | Fix |
|---|---|---|---|
Run finishes fast, squeue never shows your jobs | Executor still local, tasks ran on the login (head) node | .nextflow.log shows no Submitted process lines | Set process.executor to slurm (or sge, lsf, pbs) in a profile, relaunch with -resume |
Tasks die in seconds, .command.err says command not found | Software or PATH missing on compute nodes | Reproduce with srun, print $PATH inside the task | Load modules with beforeScript, or run everything inside a container |
Exit code 137, scheduler state OUT_OF_MEMORY or CANCELLED | Task exceeded its memory limit and was killed | Compare MaxRSS with the requested memory | Raise the memory directive, add a retry that escalates memory |
Exit code 124 or 143, scheduler state TIMEOUT | Walltime shorter than the task needs | Elapsed in sacct equals the requested time | Raise the time directive, add a retry that escalates time |
No space left on device in task stderr or launcher log | Home quota full, or the work directory filesystem is full | Run quota or df -h on the work directory path | Move the work directory to scratch with -w, clean old runs with nextflow clean |
Invalid partition specified or Unknown queue at submission | Queue or partition name wrong for your site | sinfo lists the valid names | Set process.queue to a name from sinfo |
docker: command not found or Cannot connect to the Docker daemon | Docker unavailable on the cluster, wrong container profile | which docker on a compute node | Use an Apptainer profile with apptainer.enabled = true |
| Container pull fails with network or DNS errors | Compute nodes have no outbound internet | Try the pull inside an interactive srun | Pre-pull images on the head node into a scratch cache directory |
| Launcher dies when you log out | Nextflow ran as a foreground process on the login node | Check whether the launcher was wrapped in tmux or submitted with sbatch | Run the launcher inside tmux, or submit the launcher itself as a scheduler job |
| Cache lock or session error at launch | Two runs share one launch directory | Look for another active launch from you in that directory | Use a separate launch directory for each concurrent run |
| Launcher error saying the process requirement exceeded available memory or CPUs | Per task directives exceed the limits declared to the executor | Read the launcher error, compare with executor.cpus and executor.memory | Raise the executor level limits, or lower the per task requests |
| Tasks fail only on some nodes | Heterogeneous nodes, missing software or older system libraries on a subset | Compare node names from failed versus successful tasks in sacct | Constrain submissions with clusterOptions, or containerize the software |
| Submissions stall, no new jobs appear, launcher logs scheduler limit messages | Site caps on pending or running jobs per user | Read the scheduler message in .nextflow.log, check site documentation | Lower executor.queueSize, or ask admins to raise your quota |
Why Nextflow Jobs Fail on Clusters, From Most Common to Rarest
1. The Executor Never Got Set
Nextflow's default executor is local. With no configuration, the launcher runs every task as a child process on the machine where you typed nextflow run, which on a cluster is the login node, the shared machine all users log into. The run appears to work at first, then slows to a crawl or dies when administrators kill the runaway login node process, or when the login node runs out of memory. This is the single most common setup mistake for new cluster users, and it also wastes a shared resource that hundreds of other people need.
Confirm it by looking for Submitted process > taskName lines in .nextflow.log. Their absence means nothing was submitted. Recent Nextflow versions also offer nextflow inspect, which prints the resolved configuration and total resource demand before you launch. Fix it with a profile, a named block of settings you select at launch with -profile:
profiles {
  cluster {
    process.executor = 'slurm'
    process.queue    = 'batch'
  }
}
Launch with nextflow run pipeline.nf -profile cluster, then watch squeue -u $USER until your job IDs appear.
2. The Task Was Killed for Memory (Exit Code 137)

Exit code 137 means the task died from SIGKILL, signal 9, because 128 plus 9 equals 137. On a cluster this is almost always the kernel's out of memory killer enforcing the limit the scheduler derived from your memory directive. Linux enforces per job memory limits through cgroups, the kernel mechanism that isolates the resources a group of processes may use. When a task's resident memory (the physical memory it actually holds) climbs past the limit, the kernel kills it without warning, and no error message appears in your tool's output because the tool never got to print one.
Confirm with sacct -j <jobid> -o State,ExitCode,MaxRSS. The state OUT_OF_MEMORY is definitive. Otherwise compare MaxRSS with the requested memory. A task that used 7.4 GB against an 8 GB request was simply unlucky, so request more.
Fix it with an honest memory request and an escalating retry, so transiently large tasks survive a second attempt:
process {
  withLabel: big_memory {
    memory        = { 16.GB * task.attempt }
    errorStrategy = 'retry'
    maxRetries    = 2
  }
}
task.attempt is 1 on the first run, 2 on the first retry, and so on, so each retry asks for double the memory.
3. The Task Hit Its Walltime
Walltime is the maximum runtime the scheduler grants a job. Schedulers kill jobs at the walltime limit, and the task loses all progress, because nothing inside a killed job gets a chance to save state. The scheduler state reads TIMEOUT, and the task's exit code is often 143 (SIGTERM, 128 plus 15) or 124 from a timeout wrapper.
Confirm by comparing Elapsed with the requested time in sacct. If they are equal, the limit was the cause. Fix by setting the time directive above the measured runtime with headroom, and let retries escalate:
process {
  time = { 8.h * task.attempt }
}
A task that needs 7 hours should not request 7 hours. Request 12, or whatever your site's queue limits allow, because a walltime kill always costs more than a larger reservation.
4. The Work Directory Lives on the Wrong Filesystem
Three filesystem problems cause most of this category:
- Home directory quotas. Home filesystems usually carry small per user quotas. A genomics pipeline writes sequencing intermediates that reach gigabytes per sample, fills the quota, and every task then fails with
No space left on device. - Slow shared filesystems. Network filesystems such as NFS handle many small file operations poorly, and Nextflow staging creates many small files per task. Tasks spend their walltime waiting on input and output, then die of timeout.
- Node local scratch. Many compute nodes have a fast local disk. The
scratchdirective tells Nextflow to copy a task's inputs to node local scratch, run there, and copy results back, which is the fastest pattern for input and output heavy tasks.
Confirm with df -h on the work directory path and your site's quota command. Fix by pointing the work directory at scratch and keeping the Nextflow home there too:
export NXF_HOME=/scratch/$USER/nextflow_home
nextflow run pipeline.nf -profile cluster -w /scratch/$USER/work -resume
The work directory must be visible to every compute node the scheduler might use, so it must live on a shared filesystem, not on one node's local disk.
Safety note: cleaning old work directories is destructive and irreversible. nextflow clean -but-last reports what it would delete and only deletes when you add the force flag -f. Never run rm -rf against a work directory path you have not confirmed with pwd, because deleted task folders also delete the logs you would need for the next failure and the cache entries that -resume depends on.
5. The Container Engine Does Not Match the Cluster
Docker requires a privileged background service (the Docker daemon), and most HPC sites forbid it on shared nodes. The standard container runtime on clusters is Apptainer (formerly Singularity), which runs containers as ordinary user processes without a daemon. When a pipeline profile enables Docker on a cluster, every task fails with docker: command not found or a daemon connection error.
Fix it with an Apptainer profile:
profiles {
  apptainer {
    apptainer.enabled = true
  }
}
Set the image cache on scratch, because container images are large and home quotas are small:
export NXF_APPTAINER_CACHEDIR=/scratch/$USER/apptainer_imagesIf your site gives compute nodes no outbound internet, image pulls fail mid run. Pull or build images once on the head node, or ask administrators for a local registry, then run with the cache directory set. As a lighter alternative, the conda directive lets a task use a Conda environment, but build the environment once in a shared location, because per task environment creation is slow and can time out.
6. The Environment Differs Between Head and Compute Nodes
Your interactive shell on the login node has modules loaded, a customized PATH, and sometimes aliases. Tasks on compute nodes start from a clean environment defined by the scheduler job wrapper. Anything you rely on from your interactive session silently disappears, which is why a command that works when you test it by hand fails inside the pipeline.
Most clusters expose software through environment modules, a system where module load samtools adjusts your environment to a specific version. Make the task environment explicit:
process {
  beforeScript = 'module load samtools'
}
Module names differ between sites, so copy them from your site's own documentation. The deeper fix is to containerize every tool, which makes the task environment identical everywhere. A related trap on heterogeneous clusters: binaries compiled with modern CPU instruction sets crash with illegal instruction errors when the scheduler places them on older nodes, so constrain or containerize if your site mixes node generations.
7. Scheduler Limits, Quotas, and Policies
Nextflow submits one scheduler job per task. A pipeline with 5,000 tasks can try to place thousands of jobs, and sites commonly cap how many jobs a user may have pending or running, or assign quality of service (QOS) levels that bound your concurrent resource use. When Nextflow exceeds a cap, submissions fail or stall, and the scheduler's rejection messages appear in .nextflow.log.
Two configuration layers keep you inside the caps. First, declare the resources you are allowed at the executor level, so Nextflow stops asking for more than your allocation:
executor {
  queueSize = 20
  cpus      = 64
  memory    = 256.GB
}
queueSize bounds how many tasks run concurrently, and the cpus and memory values bound the totals Nextflow will schedule for you. Second, choose a failure strategy deliberately. errorStrategy = 'terminate' aborts immediately, finish lets running tasks complete and then stops, and retry resubmits failed tasks up to maxRetries times. Research on parallel workflow management systems has demonstrated execution control at the scale of clusters with up to 960 computing cores, and that scale is reached by managing submission and scheduling deliberately rather than by firing every task at the queue at once [1].
8. Launcher, Java, and Plugin Problems
Nextflow is a Java application. A too old Java runtime fails at launch with version errors before any task exists. Check java -version against the requirement of your Nextflow release, and load the right module. Two launcher side settings prevent a second family of failures:
NXF_HOMEpoints to the directory where Nextflow stores its binaries, plugins, and cache. Put it on scratch, because the default location under your home directory can hit quotas.NXF_OFFLINE=truetells Nextflow not to fetch anything. Clusters without outbound internet need this, plus plugins already present inNXF_HOMEfrom a first run on the head node.
Also set NXF_ANSI_LOG=false when you write logs to files, so the log is plain text instead of terminal control sequences.
9. Rare but Real Causes
When the common causes are excluded, work through these:
- Cache corruption on shared filesystems. The run cache lives in
.nextflow/cachein the launch directory. Some shared filesystems do not provide the file locking that database style caches expect, and a corrupted cache produces launch errors or wrong resume behavior. Ask your administrators which filesystem supports this use, or keep the launch directory on a filesystem they recommend. - Too many open files. Launchers with hundreds of concurrent tasks can hit the per process file descriptor limit (
ulimit -n) on the head node, with errors about too many open files. Raise the limit in your launch script if your site allows it. - Job name problems. Tags with unusual characters end up in scheduler job names and can break submission. Keep tags simple.
- Node failures and preemption. Preemption is when the scheduler reclaims nodes from your jobs for higher priority work. Jobs die with states such as
NODE_FAILorPREEMPTEDthrough no fault of your pipeline. AnerrorStrategy = 'retry'at the process level absorbs most of these. - Scheduler upgrades. A site update can change submission behavior between two runs of an unchanged pipeline. When a previously stable pipeline fails after a maintenance window, check the scheduler version and site announcements before debugging your own code.
Prevention: Configuration Habits That Stop Repeat Failures
- Use profiles for every destination. Keep
standard,test, and one profile per cluster innextflow.config, so the launch command never depends on your memory of the right settings. - Launch with the trace on.
-with-tracewrites a per task table with status, exit code, duration, and memory. When something fails, the answer is already on disk.-with-reportand-with-timelineadd summaries that show which steps dominate the run. - Give every resource heavy process a retry with escalation. A retry that multiplies the memory directive by
task.attemptturns a killed task into a slower success instead of a dead run. - Declare your allocation at the executor level.
executor.cpus,executor.memory, andexecutor.queueSizekeep Nextflow inside what the site gave you, which prevents both rejections and angry administrators. - Keep one run per launch directory. Parallel runs in one directory corrupt the cache and each other's logs. Use a fresh directory per run, and
-resumeto reuse work. - Test small before you commit hours. Most pipelines ship a test profile with tiny inputs. Run it on a new cluster or after a config change, with the same profile you will use in production.
- Run the launcher somewhere it survives. Start it inside
tmux, or submit the launcher itself withsbatchso it has its own allocation and survives your logout. - Clean old work directories on a schedule. Scratch filesystems fill up, and a full scratch fails every user on it. Clean runs you no longer need with
nextflow clean.
Safety note: scancel acts immediately and cannot be undone. Confirm the job ID with squeue -u $USER before you cancel, and cancel only your own jobs.
One habit matters at the architecture level. User steering, meaning running analyses on intermediate results while the workflow executes and adapting the run in response, is an established capability of parallel workflow management systems, and designs that manage workflow data well keep the overhead of such analyses negligible [1]. In practice, your monitoring and quality control steps should read from the work directory and trace files without slowing the run, which is exactly what the trace and report flags give you.
Common Mistakes and Limitations
- Restarting instead of resuming. Relaunching without
-resumethrows away every completed task. Resume first, and only restart when you changed something that invalidates the cache, such as a process script or an input file. - Raising memory blindly. Doubling memory on every failure without reading
MaxRSSwastes your allocation and can push tasks into queues with longer wait times. Measure, then request with headroom. - Editing config mid run. Nextflow reads the configuration at launch. Changes during a run apply to nothing. Stop, edit, resume.
- Debugging the wrong layer. A tool's error message inside
.command.errdescribes the task's death, not the cause. A task killed at the memory limit often shows a confusing partial error from whatever tool was running when the kill arrived. Always pair the task log with the scheduler record. - Trusting your interactive environment. A command that works in your login shell proves nothing about the task environment on a compute node. Test with
srun. - Assuming the pipeline is broken first. On clusters, configuration and environment cause most failures. Read the scheduler record before suspecting the workflow code.
One limitation applies to everything above. Clusters differ in queues, module names, quotas, and policies, and your administrators' documentation and local support channels override any general advice here. Individual failures can also involve site specific details that only your local admins can see.
Nextflow vs Snakemake: Does the Manager Change Your Failure Modes?
Nextflow and Snakemake are the two bioinformatics workflow managers you are most likely to meet on a cluster, and the question of nextflow vs snakemake usually matters less for failures than people expect. Both submit one scheduler job per task, both support profiles, containers, and retries, and both fail for the reasons in the table above: wrong executor settings, undersized memory and time requests, filesystem problems, and scheduler caps.
The differences show up at the edges. Nextflow's launcher is a Java process with its own plugin and cache layer, which adds the Java, NXF_HOME, and cache corruption failure modes described earlier. Snakemake is a Python program that builds a directed acyclic graph (the dependency graph of rules) and submits jobs through scheduler job scripts, which adds its own failure modes around graph re parsing and jobscript templating. Nextflow's cache is content addressed, meaning tasks are identified by a hash of their inputs, code, and container, which makes -resume reruns robust. Snakemake's rerun logic keys on file modification times and code changes. Independent research on workflow management system architecture shows that the execution control and data management design, rather than the pipeline script itself, determines execution efficiency at scale [1]. Either manager runs well on a cluster when its execution layer is configured honestly, and either one fails when it is not. Choose between them on language fit and the community pipelines available for your domain, not on failure avoidance.
Frequently Asked Questions
What does exit code 137 mean in a failed Nextflow task?
It means the task was killed by SIGKILL, signal 9, with 128 plus 9 equal to 137. On a cluster this is almost always the out of memory killer enforcing the memory limit from your memory directive. Check sacct -o State,MaxRSS for the job, then raise the memory directive and add a retry that escalates memory with task.attempt.
Where do I find the real error message for a failed Nextflow task?
In the task's work folder, which trace.txt or nextflow log identifies. Read .command.err first, then .command.out and .command.sh. Pair those with the scheduler record from sacct, because a task killed from outside shows only a partial error from whatever was running at the moment of the kill.
How do I rerun only the failed tasks in Nextflow?
Relaunch with -resume from the same launch directory. Nextflow's cache marks every task whose inputs, code, and container are unchanged as CACHED and skips it, so only failed and affected tasks rerun. Do not delete the work directory, because the cache depends on it.
Why does my Nextflow pipeline run on the login node instead of the cluster?
Because the executor is still local, the default. Without process.executor = 'slurm' (or sge, lsf, pbs) in your config or profile, Nextflow runs every task as a child of the launcher process. Set the executor in a profile, relaunch with -resume, and confirm with squeue -u $USER.
How much memory should I request for a Nextflow process?
Request what the task actually uses, plus headroom. Measure real use with MaxRSS from sacct or the memory column in -with-trace output, then set the memory directive above that value. An escalating retry that multiplies memory by task.attempt covers tasks whose needs vary between samples.
Can I use Docker containers with Nextflow on an HPC cluster?
Usually no. Docker needs a privileged daemon, which shared clusters do not allow. Use Apptainer (formerly Singularity) instead, with apptainer.enabled = true in a profile and NXF_APPTAINER_CACHEDIR pointed at scratch. Ask your administrators if a Docker path exists at your site.
Why does my pipeline work on my laptop but fail on the cluster?
Different resources, filesystems, and environment. Laptops have no walltime, no memory cgroups, and a fully configured shell, while cluster tasks run under limits with a clean environment on a shared filesystem. The usual gaps are memory, time, missing modules on compute nodes, and container engine differences.
Nextflow or Snakemake, which fails less on HPC?
Neither has a structural advantage. Both submit one scheduler job per task and fail for the same dominant reasons: undersized resource requests, executor misconfiguration, and filesystem problems. Pick the manager that fits your team's language and your domain's community pipelines, then invest in the configuration habits in this guide.