How to Debug Nextflow Pipeline Errors in a Cloud Environment
By Dr. Zubair Khalid, DVM, MS, PhD ·

Most failed cloud runs die for one of two reasons. Either a task was killed because it requested less memory or CPU than it actually used, or the task's container, storage paths, or permissions differ from what the pipeline expects. The first thing to check is never the pipeline code. Open the failed task's .command.err file in its work directory and read the last lines of .nextflow.log. Between them, those two files name the process, the exit code, and usually the exact command that failed.
The cloud adds failure modes a laptop never shows: batch queues that never schedule, object storage permissions that differ from your own login, spot instances that vanish mid-task, and service quotas that silently cap parallelism. This guide ranks those causes from most common to rarest, explains the mechanism behind each one, gives a diagnostic sequence you can follow on any run, and closes with prevention practices. A troubleshooting table sits near the top as the quick reference for everyday bioinformatics troubleshooting. Each cause section ends with the fix, so the guide also works as a how-to-fix companion you can jump around in.
Nextflow Cloud Debugging: The First Five Minutes
Resist the urge to rerun with more memory before you have read the error. Randomly doubling resources sometimes works and always teaches nothing. Follow this sequence instead.
- Confirm the log. Nextflow writes a detailed run log named
.nextflow.login the directory where you launched the run. Look at the end of it withtail -n 200 .nextflow.log. - Find the first failed task. Search for the first task that reports a nonzero exit status, for example with
grep -inE "terminated|error|failed" .nextflow.log | tail -n 40. The log line includes the full work directory path for that task, something likework/9a/f034b2.... - Enter that directory and read four files in order.
.exitcodeholds the numeric exit status..command.errholds the task's standard error and contains the real error message in most cases..command.outholds standard output..command.shholds the exact script the task ran. - Classify the failure. Exit code 137 points to a resource kill. Exit 127 points to a missing command. A path or permission error points to storage or credentials. A syntax error points to pipeline code or configuration.
- Fix exactly one variable and rerun with
-resume, which keeps every unaffected task cached so the rerun costs minutes instead of hours. - From now on, run with
-with-traceand-with-report. These options produce a table and an HTML report of every task, which turns your next failure into a lookup instead of an investigation.
The habit that separates fast debuggers from slow ones is simple: read the task's own stderr before touching anything else.
How Nextflow Records Failures: Logs and the Work Directory
Three definitions make everything else readable. The head node is the machine where you typed nextflow run. It parses the pipeline, manages the run, and submits work. The executor is the adapter that turns tasks into jobs on a specific system, such as your local machine, AWS Batch, Google Batch, or Kubernetes. The work directory is where Nextflow materializes each task: it copies or links the inputs, writes the task script, executes it, and stores every output there before publishing.
The work directory layout follows a fixed pattern. Each task gets a directory named after its hash, nested under a two-character prefix, so paths look like work/9a/f034b2.... Inside you find:
.command.sh, the task script Nextflow generated from the process definition..command.run, the full bash wrapper Nextflow used, including environment setup, input staging, and resource limits. When behavior differs between your laptop and the cloud, this file shows exactly what changed..command.errand.command.out, the task's stderr and stdout..exitcode, the task's numeric exit status, written when the task finishes.
The run log records every submission, staging operation, and exit status. When a log grows large, Nextflow rotates the previous one to .nextflow.log.1. For finished runs, nextflow log lists run history, and nextflow log <run_name> -f process,exit,hash,workdir prints a compact map from failed processes to the directories holding their evidence.
Two more commands pay for themselves constantly. nextflow config -profile myprofile prints the fully resolved configuration for a profile, which shows what the cloud actually received rather than what you think it received. nextflow inspect summarizes the processes, containers, and resources a pipeline will use before you submit anything.
For completed tasks, the trace file produced by -with-trace adds per-task measurements such as duration, requested CPUs and memory, and peak resident memory. That file is the single best source for right-sizing resources, which is the theme of the most common failure class below.
The Nextflow Cloud Debugging Table
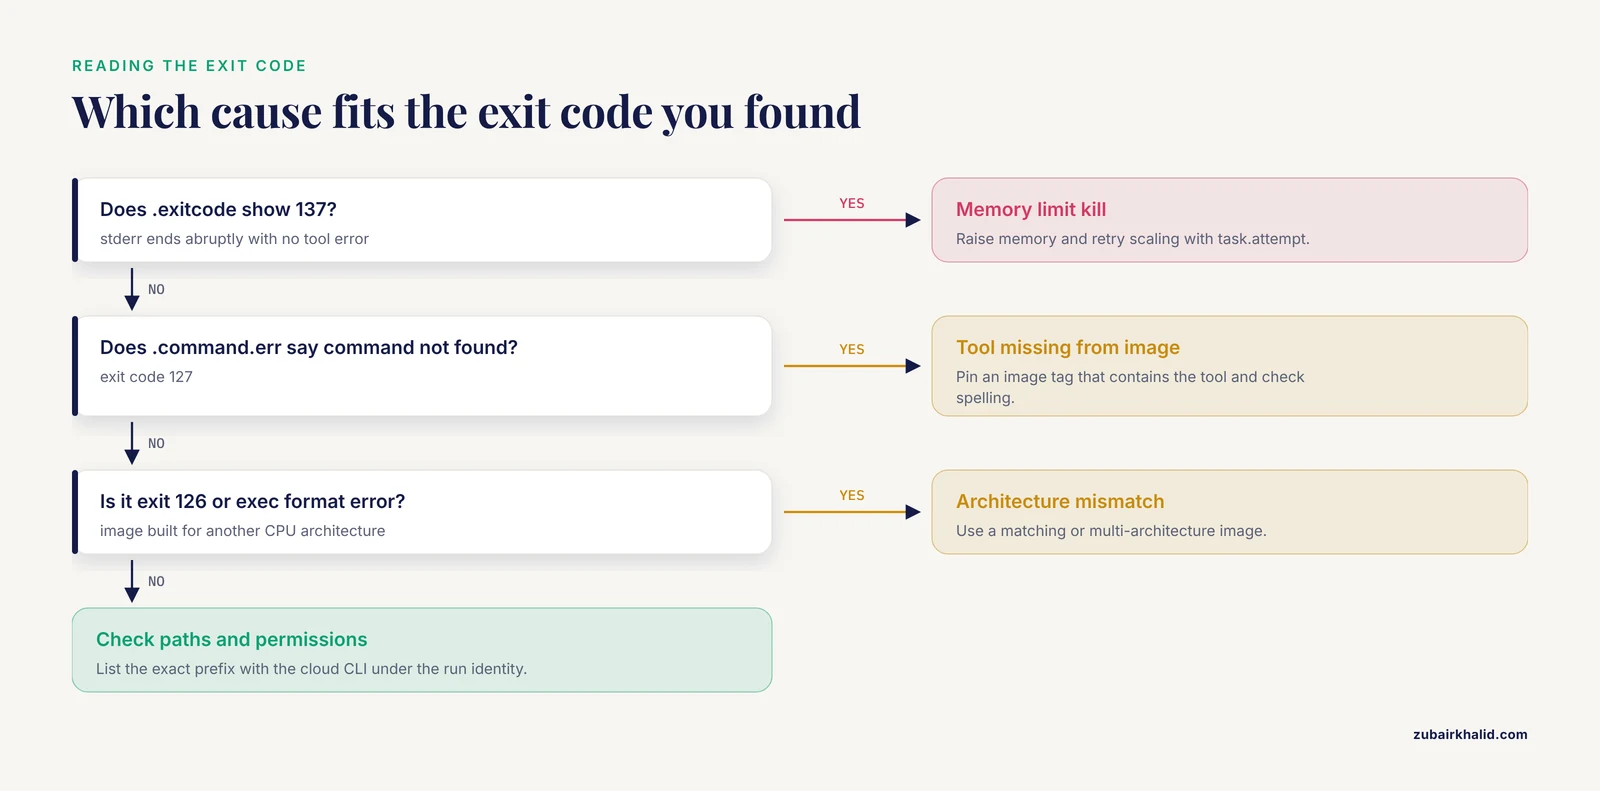
The causes below are ranked from most common to rarest. Use this table as the index into the detailed sections that follow.
| Symptom | Likely cause | How to confirm | Fix |
|---|---|---|---|
Task killed, .exitcode shows 137 | Task exceeded its memory limit and received SIGKILL | Trace shows peak memory close to the directive, stderr ends abruptly | Raise memory, add a retry that scales with task.attempt |
Exit 127, "command not found" in .command.err | Tool missing from the container image or PATH | Start the image interactively and call the binary by name | Pin an image tag that contains the tool, check spelling |
| Exit 126 or "exec format error" | Image built for a different CPU architecture than the instance | Compare instance architecture with the image manifest | Use a matching or multi-architecture image |
Instant failure on an s3:// or gs:// input | Wrong path, missing read permission, or wrong region | List the exact prefix with the cloud CLI under the same identity the run uses | Correct the path, grant read access, align the region |
| Jobs sit in RUNNABLE (AWS Batch) or Pending (Kubernetes) | Service quota exhausted, compute environment or node pool out of capacity, image pull blocked | Status reason in the cloud console, kubectl describe pod for Kubernetes | Request a quota increase, add capacity, fix registry access |
Head node dies with java.lang.OutOfMemoryError | Launcher JVM heap too small for a large run database and many concurrent tasks | Message appears in .nextflow.log before tasks finish | Raise the heap with NXF_OPTS, lower parallelism, archive old runs |
-resume reruns everything | Code, container, or parameter changes altered task hashes | Compare hashes across runs with nextflow log | Expect reruns after edits, keep parameters in a versioned config |
| Database or lock errors at startup | Head node terminated abruptly, often a spot interruption, while the run database was open | Errors appear before any task runs | Keep .nextflow and work on persistent storage, rerun with -resume |
| Output bucket missing files after a successful-looking run | Publishing failed or the run died before publishing finished | Log shows publish errors after task success | Fix the failing task or bucket permissions, rerun with -resume |
| Samplesheet validation error at the start of an RNA-seq run | Unreachable FASTQ paths, mismatched read pairs, wrong column names | List each path with the cloud CLI, validate one row manually | Fix paths and pairing, rebuild the sheet from the sequencing manifest |
| Many unrelated tasks fail at the same minute | Spot instance reclamation or node scale-down | Instance termination events in the console line up with the failures | Retry on on-demand capacity, keep the head node on a persistent VM |
"bad interpreter" or stray ^M in script errors | Windows line endings introduced by an editor | file samplesheet.csv reports CRLF line terminators | Convert files to Unix line endings, enforce this in the repository |
Cause 1: Tasks Killed for Exceeding Memory or CPU Limits
This is the most common cloud failure by a wide margin, and it has a precise mechanism. Cloud batch platforms run each task inside a container governed by a cgroup, the Linux kernel mechanism that enforces per-container resource limits. When a task's memory use reaches the limit you requested through the memory directive, the kernel's out-of-memory killer terminates the process with SIGKILL. The shell reports that as exit code 137, which is 128 plus the signal number 9. Nothing in the task's stderr explains the death, because SIGKILL cannot be caught. The signature is an error file that simply stops mid-output.
Pipelines ship conservative default resource requests, usually sized for small test datasets, so under-requesting is the default condition, not an anomaly. Genome alignment makes the problem vivid. A human genome index for a splice-aware aligner typically needs tens of gigabytes of RAM just to hold the index in memory, and a directive set to a few gigabytes guarantees a kill.
Confirming the cause takes two looks. First, .exitcode shows 137 and .command.err ends abruptly with no tool error. Second, the trace file from a previous run shows that task's peak memory sitting just under the requested amount on the attempt that died. Compare requested versus observed across all tasks of that process to see the real distribution.
The fix combines honest directives with a retry strategy that escalates automatically:
process {
    withLabel: 'process_high' {
        cpus          = 8
        memory        = { 16.GB * task.attempt }
        time          = '12 h'
        errorStrategy = 'retry'
        maxRetries    = 2
    }
}
With errorStrategy = 'retry', a failed task reruns with task.attempt incremented, so the memory request doubles on the second try and triples on the third. This pattern absorbs transient pressure without permanently overpaying. Two cautions apply. The queue or compute environment must contain instance types that can satisfy the largest request, otherwise jobs pend forever, which connects to Cause 4. And over-requesting wastes money, so tune from trace data rather than fear: raise the directive until peak memory sits comfortably below the limit, then stop.
CPU follows the same logic in slower motion. An under-requested cpus value rarely kills a task, but it stretches runtime until the time directive expires, which surfaces as a timeout rather than a kill. If tasks die at a consistent wall-clock age, check time before anything else.
Cause 2: Container Images That Do Not Match the Task
A container image is a packaged filesystem containing the tools a process needs, and Nextflow runs every task inside one when you enable Docker, Apptainer, Singularity, or Podman, or falls back to Conda environments when configured. Mismatches between the image and the task produce a distinct family of errors.
Exit code 127 means the shell could not find the command. Either the image genuinely lacks the tool, or the tool exists under a different name or outside the PATH. Exit code 126, or an "exec format error", usually means the image was built for a different CPU architecture. This bites teams that develop on ARM laptops and deploy to x86 cloud instances, or the reverse on Graviton-class nodes. Version drift is quieter: an image tagged latest resolves to different contents next month, and a pipeline that worked in spring fails in fall with an argument error from a tool that changed its interface.
Diagnosis is interactive and fast. Run the exact image by hand and call the failing binary:
docker run -it <image> bash
which <tool>
<tool> --version
If the binary is absent or its version differs from what the pipeline expects, you have found the cause. nextflow inspect shows which container each process will use, and .command.err names the missing command verbatim.
The fixes are structural. Pin immutable image tags, or digests, so the image cannot change under you. Prefer images from established bioinformatics build services that version tools consistently. If you use Apptainer or Singularity on shared cloud storage, set the image cache directory environment variables NXF_APPTAINER_CACHEDIR or NXF_SINGULARITY_CACHEDIR to a shared path so images are pulled once rather than per node, which prevents both slow runs and pull failures under registry rate limits. Match architectures between development and production, or build multi-architecture images. Finally, smoke-test the exact image with a trivial process before committing a multi-hour run to it.
Cause 3: Object Storage Paths, Permissions, and Credentials
In the cloud, inputs, the work directory, and published outputs usually live in object storage such as Amazon S3 or Google Cloud Storage. A bucket is a top-level container for objects in that storage. Nextflow stages data by copying objects into the task directory, or reads them remotely when the run uses Fusion, and every one of those hops requires an identity with permission.
IAM, short for Identity and Access Management, is the permission system in each cloud. Permissions attach to roles or policies, and the identity your head node uses is frequently not the identity your batch jobs use. That asymmetry produces the classic trap: a test run on the head node succeeds because your personal credentials can read everything, then the production run fails because the job role cannot.
Typical breaks include a typo in a bucket prefix, a bucket in a different region from the client, a job role missing read or write on the work directory, and expired static access keys. The log distinguishes staging failures from command failures, so read the phase name in the error before concluding the tool itself failed.
Confirm with the cloud CLI under the same identity the run uses:
aws sts get-caller-identity
aws s3 ls s3://my-bucket/reads/
If the listing fails or returns an empty set you expected to be full, the path or the permission is the problem, not the pipeline. For Kubernetes, kubectl describe pod on a stuck or failed pod shows mount and secret errors that never reach the task's own logs.
The fixes follow least privilege. Prefer instance profiles or service accounts over long-lived access keys, because they rotate automatically and never sit in a file. Grant read and write on the exact prefixes the pipeline touches, set the region explicitly in your configuration, and keep the work directory on storage every compute node can reach.
Safety note. Raw sequencing data from human subjects is identifiable genetic information. Buckets holding such data must be private, access-controlled, and logged, and credentials must never be pasted into logs, tickets, chat, or configuration files committed to a repository. When you share logs for debugging, redact bucket names that identify datasets and remove any exported keys.
Cause 4: Executor and Queue Misconfiguration
The executor translates Nextflow tasks into jobs for a specific platform, and each platform has its own vocabulary of queues, compute environments, node pools, and quotas. A quota is the ceiling a cloud account places on resources such as concurrent vCPUs in a region. Misconfiguration produces two opposite symptoms, and telling them apart is the first diagnostic step.
Instant failures at submit time indicate a structural error: a queue name that does not exist, a region mismatch where the head node submits in one region and the compute environment lives in another, or a job role that does not exist. Jobs that pend indefinitely indicate a capacity problem: the queue has no instance types large enough for your biggest resource request, the account's vCPU quota is exhausted, or nodes cannot pull the container image from the registry.
The cloud console answers most of this without touching Nextflow. AWS Batch shows each job's state and status reason, and a job parked in RUNNABLE with a reason about insufficient capacity or quota is self-explanatory. For Kubernetes, kubectl get events and kubectl describe pod <pod> reveal unschedulable pods, failed image pulls, and quota denials. The Nextflow log complements this by recording the exact parameters used for each submission.
Fixes are checklist work. Align the region across the head node, the compute environment, and the buckets. Verify that the queue or node group includes instance families that satisfy the pipeline's largest memory and CPU requests, since a request for 64 GB cannot schedule on nodes capped at 32 GB. Check quotas before scaling out a large cohort, and request increases ahead of time. Give the job role access to the work directory and to your container registry. When you adopt a community pipeline, start from its documented cloud profile rather than assembling your own from scratch, because tested profiles encode most of these settings correctly.
Cause 5: Spot Interruptions and a Fragile Head Node
A spot instance is discounted cloud capacity that the provider can reclaim on short notice. Reclamation kills every task on the node at once, which produces a distinctive signature: many unrelated processes fail within the same minute, with transport errors or abrupt terminations, and the console shows instance terminations matching those timestamps.
Task-level recovery is straightforward. A retry strategy with errorStrategy = 'retry' and a few maxRetries absorbs interruptions, because the interrupted task simply reruns elsewhere. Mixing spot capacity for fault-tolerant batch work with on-demand capacity for tasks that must not be interrupted gives most of the savings with little pain.
The head node is the dangerous half. If it runs on a spot instance, termination takes the run database and in-flight orchestration down with it. The run database lives under .nextflow in the launch directory and records every completed task hash, which is what makes -resume possible. Losing it mid-project forfeits all caching. Keep the head node on a persistent, modest, on-demand virtual machine, and keep both .nextflow and work on durable volumes. With those two precautions, a dead head node costs you a relaunch with -resume rather than a week of compute.
Cause 6: Cache, Resume, and Run History Problems
-resume is the feature that makes iterative cloud work affordable, and it works through task hashes. A task hash is a fingerprint Nextflow computes from the process name, the task's script text, its container, its inputs, and key directives. A task reruns if and only if its hash changed. Completed hashes are stored in the session database under .nextflow/cache, keyed to the run.
Three failure patterns follow from this design. First, everything reruns after an edit, which is not a bug: changing a process script, its container, or an input changes every downstream hash. Confirm what changed by comparing hashes between runs with nextflow log <run_name> -f process,exit,hash. Second, resume fails entirely after the session database is damaged or deleted, typically by an abrupt head node death or by someone cleaning the launch directory. Third, two Nextflow processes launched from the same directory contend for the same database and fail with a lock error, which the log states plainly. Run concurrent projects from separate directories.
Treat the work directory as disposable but expensive to lose mid-project. Clean it selectively with nextflow clean -n to preview what would be removed, then nextflow clean -f to remove it, scoped to runs you name. Keep parameters in versioned configuration files rather than ad hoc command-line edits, because stable inputs keep hashes stable and make resume predictable.
Safety note. nextflow clean -f and any recursive deletion inside work are irreversible. Preview with the dry-run flag, never clean while a run is active, and never clean a work directory belonging to a run someone else may still be resuming.
Rare Causes Worth Knowing
A few causes appear seldom enough that teams meet them only once, then remember them forever.
- Windows line endings. A script or samplesheet edited on Windows gains carriage returns, and the task fails with "bad interpreter" or a stray
^Min messages.file samplesheet.csvnames the problem, anddos2unixfixes it. Enforce Unix line endings in the repository so the problem cannot return. - Java runtime mismatch on the head node. Nextflow itself runs on the JVM, and a head node with an unsupported Java version fails before any task runs. Match the Java version recommended by the release notes for your Nextflow version.
- Clock skew. A long-lived virtual machine whose clock drifts can fail TLS handshakes to object storage with certificate errors. Time synchronization services on the VM resolve it.
- Registry outages and rate limits. Intermittent image pull failures across many tasks at once point at the container registry rather than the pipeline. Retry, cache images locally, or mirror the registry inside your network.
- Shared filesystem quirks. Work directories on network filesystems can hit locking or permission quirks, particularly with root-squashing on NFS. Moving the work directory to a local scratch volume on each node, or to object storage with Fusion, removes the class of problem.
Worked Example: Chasing Down an RNA-seq Error on AWS Batch
Here is a composite case that combines the patterns above into one walkthrough. A lab runs a standard nf-core RNA-seq pipeline, which performs quality control, adapter trimming, genome alignment and quantification, and aggregation of QC metrics, on 24 human samples in AWS Batch. Forty minutes in, the run fails.
The log tail names the failing process and its work directory. .exitcode reads 137. .command.err stops right after the aligner reports loading the genome index, with no tool error message. That combination is the fingerprint of a SIGKILL from a memory limit, and for an RNA-seq error in the cloud it is the single most common shape. The aligner loads a human genome index that needs tens of gigabytes of resident memory, while the pipeline's default label was sized for the tiny test dataset.
The trace file from the run confirms it: the alignment tasks show peak memory pressed against the directive, while trimming and QC tasks sit far below theirs. The fix targets only the alignment process:
process {
    withName: 'STAR_ALIGN' {
        memory        = { 40.GB * task.attempt }
        cpus          = 8
        errorStrategy = 'retry'
        maxRetries    = 2
    }
}
Rerunning with -resume keeps every upstream task cached, so only alignment and everything after it executes again. The run completes, and the trace now shows alignment peak memory sitting below the request with headroom.
A second RNA-seq error shape deserves its own paragraph because it appears constantly. The run fails within seconds with a samplesheet validation error. The samplesheet is the CSV file listing sample identifiers, the read 1 and read 2 FASTQ paths, and strandedness. Typical faults are a typo in one FASTQ path, read pairs swapped so mate 1 points at an R2 file, and truncated transfers from an interrupted upload. Confirm each path with aws s3 ls, verify pairing by comparing filenames, and test file integrity with gzip -t on any file you suspect. Fix the sheet, rerun with -resume, and the pipeline proceeds. Most RNA-seq errors in the cloud reduce to input integrity or resource sizing, which is why the five-minute triage at the top of this guide resolves so many of them.
Common Mistakes and Limitations
These are the errors experienced teams still make, listed so you can skip them.
- Deleting the work directory before reading
.command.err. The work directory is the evidence locker. Clean it only after the diagnosis is written down. - Reading only the last error. Nextflow executes many tasks in parallel, and the failure that surfaces first is often just the first of several, sometimes with different causes. Scan the trace for every failed task before you conclude anything.
- Escalating resources blindly. Doubling memory until the error disappears hides the mechanism and burns budget. Read stderr first, then size from trace data.
- Testing only the tiny test profile and scaling straight to full data. The test profile proves wiring, not resource ceilings. Check the trace from a small real subset before the full cohort.
- Treating published files as proof of success. Publishing copies results out of the work directory and is separate from task success. A partially published bucket can coexist with a failed run.
- Committing credentials or sensitive bucket names to repositories. This converts a debugging session into a security incident.
- Pasting DSL1-era snippets from old tutorials into modern pipelines. Current Nextflow releases use DSL2 by default, and syntax from the old DSL produces errors that look like pipeline bugs but are version mismatches.
- Debugging on a different CPU architecture than production. An image that runs on an ARM laptop can fail with an exec format error on x86 cloud nodes.
- Ignoring version pins. Unpinned containers and unpinned pipeline versions make results irreproducible and make yesterday's debugging knowledge useless next month.
Two limitations bound this guide. Cloud consoles, quota names, and default values change over time and vary by account, so verify exact flag names and console paths against the official documentation for your Nextflow release and your cloud provider. And when a failure resists systematic diagnosis, hand it to a second pair of eyes: post the full log, the trace and report files, and your redacted configuration to the pipeline's issue tracker or community channel, where maintainers resolve most reproducible cases quickly. Production datasets under compliance constraints may additionally need review from your institution's bioinformatician or data governance team before you move data while debugging.
Prevention: Practices That Remove Most Cloud Failures
Prevention in this domain is mostly a set of cheap habits that convert failures into lookups.
- Run every pipeline with
-with-trace,-with-report, and-with-timeline. They cost almost nothing and turn every future failure into a table lookup. - Pin container tags and record the Nextflow version, configuration, and parameters in the repository. Results become reproducible, and diffs explain unplanned reruns.
- Start every new dataset with the pipeline's test profile, then a small real subset, and inspect the trace for the largest memory consumers before committing to the full cohort.
- Keep the head node persistent and modest, and keep
workon fast storage with monitored free space. A quickdu -sh workbelongs in your weekly routine. - Centralize resource settings in labels and a cloud configuration with scaled directives and retry strategies, rather than editing pipeline modules per run.
- Configure budget alerts before the first large run, and use spot capacity for fault-tolerant batch work while keeping the head node on on-demand capacity.
- Carry identity through instance profiles or service accounts, rotate any static keys, and scan repositories for accidental secrets.
- Lint configurations and samplesheets in continuous integration so path and schema errors never reach the cloud.
Safety note. Budget alerts are the safety belt for cloud spend. A parallel pipeline pointed at the wrong queue or an oversized instance family can consume a month's budget in hours, so configure alerts before scaling beyond the test profile rather than after the first surprising invoice.
Frequently Asked Questions
What is the first thing to check when a Nextflow run fails in the cloud?
Read the failed task's .command.err file in its work directory together with the tail of .nextflow.log. Those two files name the process, the exit code, and the failing command in almost every case.
What does exit code 137 mean?
The task received SIGKILL, almost always because it exceeded the memory limit enforced by the batch platform. Raise the task's memory directive and add a retry strategy that scales with task.attempt.
How does -resume decide what to rerun?
It reuses tasks whose hash is unchanged. The hash covers the process script, container, inputs, and key directives, so any edit to those forces a rerun while everything else stays cached.
Where should the work directory live in the cloud?
On storage every compute node can reach at high speed, such as a mounted shared filesystem, or on object storage when the run uses Fusion. Keep it on persistent volumes so -resume survives head node problems.
How do I handle cloud credentials safely in Nextflow?
Let the infrastructure carry identity through instance profiles or service accounts instead of pasting long-lived keys into configuration files. Grant access on the exact buckets the pipeline uses and never commit credentials to a repository.
Why does my pipeline work locally but fail on AWS Batch or Kubernetes?
Local runs have generous memory, your own credentials, and a matching architecture. Cloud runs enforce per-container limits, use restricted job roles, and may run a different CPU architecture, so resource, permission, and image mismatches surface only there.
How do I troubleshoot an RNA-seq error specifically?
Start with the samplesheet and confirm every FASTQ path resolves, read pairs match, and files decompress cleanly with gzip -t. Then check resource-heavy steps such as genome alignment, which commonly needs tens of gigabytes of memory for a human index.
How do I ask for help effectively?
Post the full .nextflow.log, the trace and report files, your configuration with secrets removed, and the exact command you ran to the pipeline's issue tracker or community forum. Maintainers can reproduce most issues quickly from that package.