How to Monitor CPU Usage with top for Bioinformatics
By Dr. Zubair Khalid, DVM, MS, PhD ·

Monitoring CPU usage with top in bioinformatics means using the standard Linux process viewer to observe, in real time, how much processor time your sequencing pipelines, aligners, assemblers, and variant callers are consuming on each core of your machine. A correct interpretation combines three signals from the same screen: the load average at the top, the %Cpu(s) summary line, and the per-process %CPU column, read together rather than one at a time.
Bioinformatics is one of the most CPU-hungry disciplines in all of computing. A single RNA-seq alignment against the human transcriptome, a de novo genome assembly, or a metagenomic classifier against the NCBI non-redundant protein database can pin dozens of cores for hours or days. When you run these workloads, three questions decide whether your day goes well: Is the tool actually using the threads I gave it? Is the node saturated, or am I wasting allocated resources? And is something else on this shared server stealing the CPU from my job? The top utility, which ships with essentially every Linux distribution as part of the procps package family, answers all three from a single terminal window with no installation, no root access, and no learning curve beyond a handful of keystrokes. Anyone doing Linux for bioinformatics needs this skill before they need anything else, because it is the first diagnostic you will reach for when a pipeline feels slow, when a job scheduler complains, or when a collaborator asks why the shared server is unresponsive.
This guide is a complete, practical walkthrough of top written specifically for bioinformatics workloads. It covers the header fields, the process columns, the interactive keys, real worked examples with whole-genome and transcriptome tools, batch-mode logging for long pipelines, and the interpretation traps that catch nearly everyone on their first HPC project.
What top Is and Why It Belongs in Every Bioinformatics Workflow
top is an interactive, real-time process monitor that reports which processes are running on a Linux system, how much processor time and memory each one is using, and how the overall machine is behaving at that moment. It reads its raw data from the kernel through the /proc virtual filesystem, which means it reflects live system state rather than a historical log.
In a bioinformatics context, top matters for four practical reasons:
- Verification of thread counts. Tools such as BWA-MEM, STAR, Bowtie2, minimap2, samtools, bcftools, GATK, SPAdes, MEGAHIT, and Kraken2 all accept a thread or core count parameter (commonly
-t,-@, or-threads). Passing the right number and the tool honoring it are two different things.topshows you within seconds whether a job is actually using the 16 threads you requested or silently running single-threaded. - Bottleneck identification. Not every slow stage is CPU-bound. When the CPU line shows high
wa(iowait), your alignment is starved by slow disk reads of a 30 GB BAM file, not by the processor. Knowing this changes the fix entirely. - Fair sharing of servers. Most lab servers and institutional clusters are shared. Before launching a 32-thread job on a machine you do not own, you should look at
topand see what is already running. This is basic etiquette and it prevents the classic disaster of two researchers each launching jobs sized for the whole node. - Deciding thread counts for the next step. The most common question in pipeline tuning is how many threads the next command should get.
topgives you the empirical evidence to answer it instead of guessing.
The tool is documented in its own manual page, accessible with man top, and that manual page remains the authoritative reference for every flag and field discussed here. Everything below is consistent with it.
Launching top on a Workstation, Server, or HPC Node
Open a terminal and type:
topThat is the entire start command. Within a second or two you will see a screen split into two parts: a header of roughly five lines describing the machine as a whole, and a table of processes sorted by CPU usage, refreshing every few seconds. Press q at any time to quit.
A few launch variations matter immediately for bioinformatics work:
top -u $USERstartstopfiltered to only your own processes. On a shared server with dozens of jobs from other lab members, this is the default you actually want. Once insidetop, pressinguand then typing a username does the same thing.top -p 12345startstopwatching only the process with ID 12345, which is useful when you already know the PID of your aligner.top -d 5sets the refresh interval to 5 seconds. The default is 3 seconds. For very long-running jobs there is rarely a reason to refresh faster, and each refresh costs a trivial but nonzero amount of CPU.top -Hstartstopin thread view, showing individual threads rather than collapsed processes. This is central to bioinformatics monitoring and is covered in its own section below.
On an HPC cluster, remember that the login node is not where your jobs run. If you launched an analysis through SLURM, PBS, or a similar scheduler, the compute happens on worker nodes. You must either connect to the allocated compute node (for example, ssh node-gpu-07) or use srun, pty top to open an interactive shell on your allocation first. Running top on the login node tells you about the login node, which is almost never what you want to know.
Reading the top Header on a Bioinformatics Machine
The header lines are where the machine-level story lives. For CPU interpretation, three parts of the header carry the signal: the load average, the task summary, and the %Cpu(s) line.
The First Line: Uptime and Load Average
The first line looks something like this on a 32-core analysis server:
top - 14:22:07 up 41 days, 3:12, 4 users, load average: 24.71, 18.35, 11.02The load average is the single most misinterpreted number in Linux for bioinformatics, so here is the plain explanation. Load average is the average number of processes that are either running on a CPU or waiting to be scheduled on one, measured over three windows: the last 1 minute, the last 5 minutes, and the last 15 minutes. The three numbers shown are 1-minute, 5-minute, and 15-minute averages, in that order.
The interpretation rule is simple and reliable. Divide the load average by the number of CPU cores. You can get the core count with nproc at the command line, or by looking at the Cpu(s) lines in top itself after pressing the 1 key, which is described below.
- Load average around the core count (24 on a 32-core machine is 0.77 per core) means the machine is busy but healthy.
- Load average far below the core count (3 on a 32-core machine) means cores are sitting idle, which usually means your job is bottlenecked on disk, memory bandwidth, or a single-threaded stage.
- Load average far above the core count (60 on a 32-core machine, meaning 1.9 per core) means processes are queuing for CPU time and everything on the node, including interactive shells, will feel sluggish.
The trend across the three numbers matters as much as the values. In the example above, load was 11 fifteen minutes ago, 18 five minutes ago, and 24 now. Someone just launched a large job and it is ramping up. A falling sequence tells the opposite story, that a job recently finished or was killed.
One caveat that matters for bioinformatics specifically: the load average counts processes in uninterruptible disk sleep, not just processes waiting for CPU. A job reading a massive FASTQ from a slow network filesystem can inflate the load average without consuming much processor time. This is why the load average must always be read together with the CPU line and the wa figure.
The Tasks Line
Tasks: 612 total, 4 running, 605 sleeping, 0 stopped, 3 zombieFor a typical analysis server, this line is mostly a health check. The number of running tasks should be roughly the number of cores under normal load. Zombie processes, which are dead processes whose parent has not collected their exit status, should normally be zero or transient. A persistent and growing zombie count during a long pipeline run is usually a sign that a wrapper script or workflow manager is not reaping its child processes, and it is worth investigating before it accumulates into thousands of entries.
The %Cpu(s) Line Explained Field by Field
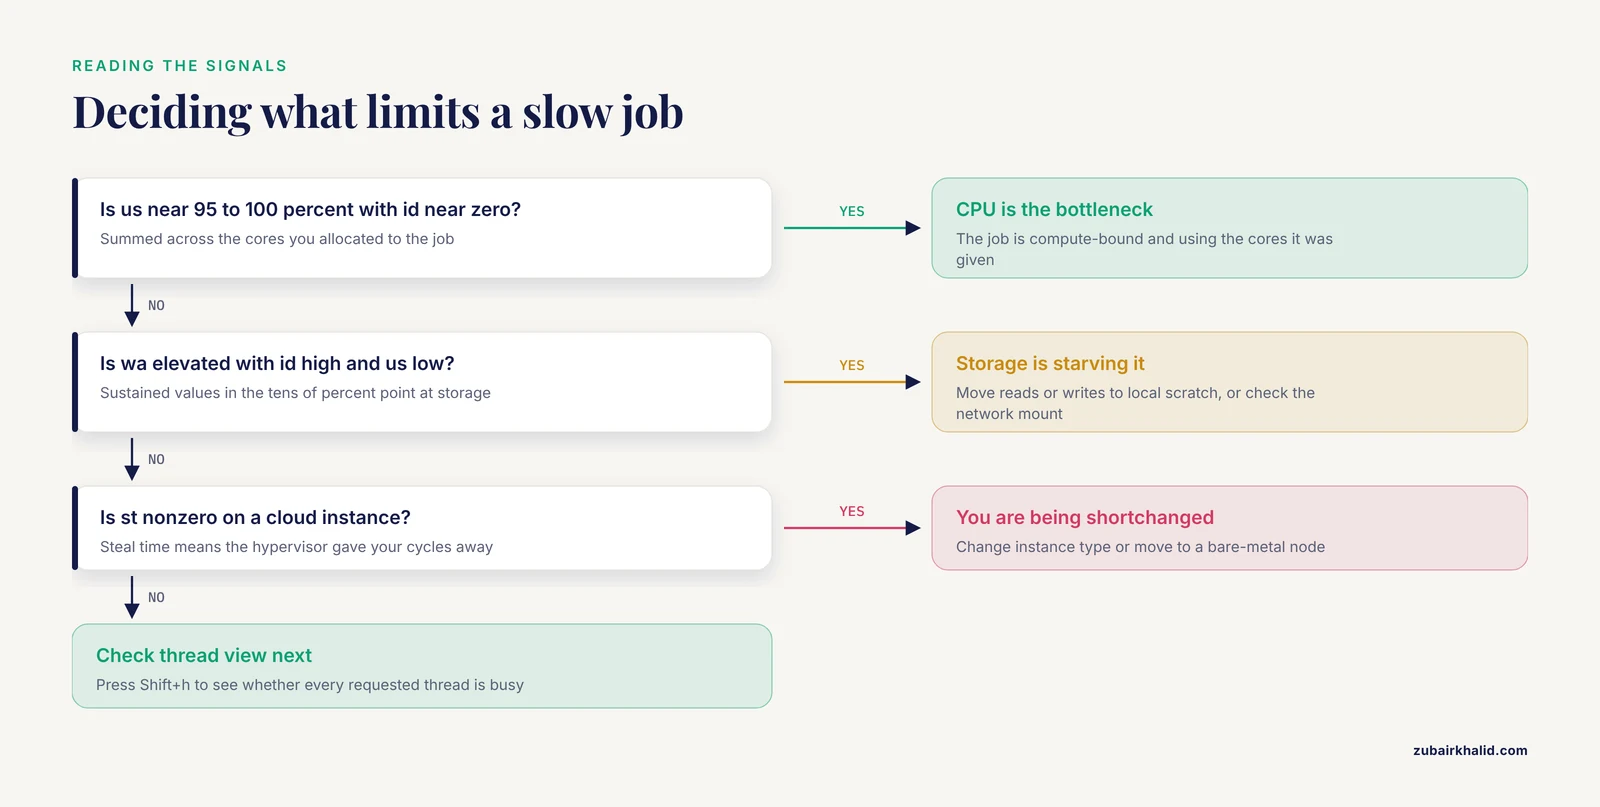
This line is the heart of monitor CPU usage bioinformatics top interpretation. Pressing the 1 key toggles top between a single aggregate CPU line and one line per logical core. Both views show the same fields, so learn them once:
- us, user time. The percentage of CPU time spent running user-space programs, which is everything in your pipeline: the aligner, the sorter, the variant caller, Python, R, everything you or a tool launched.
- sy, system time. The percentage spent in the kernel on behalf of your processes, including syscalls, memory management, and I/O bookkeeping. Light CPU-bound jobs show a few percent here. Very high system time can indicate a program doing something unusual, such as hammering the filesystem with tiny reads.
- ni, nice time. Time spent on processes with an altered scheduling priority. When you launch a job with
nice -n 19to be polite on a shared server, its consumption shows up here. - id, idle. The percentage of time the CPU had nothing to run at all. High idle with a slow job is the classic signature of an I/O bottleneck or a serial stage in a parallel workflow.
- wa, iowait. The percentage of time the CPU was idle specifically because it was waiting for disk or network I/O to finish. Occasional single-digit values are normal during the start of any job that reads large files. Sustained values in the tens of percent, combined with high idle and low
us, tell you the processor is starving and the storage layer is the problem. For a whole-genome sort writing a multi-hundred-GB temporary file to a slow spindle disk, this is exactly the pattern you expect to see. - hi and si, hardware and software interrupt time. Normally negligible. Sustained elevation is a driver-level concern, rarely a bioinformatics one.
- st, steal time. Relevant only on virtual machines and cloud instances. It is the percentage of time the hypervisor gave your CPU cycles to another tenant. If you run analyses on a cloud instance and see meaningful steal time, you are not getting the compute you are paying for, and the honest fix is a different instance type or a bare-metal node.
A healthy, CPU-saturated alignment job on a dedicated node looks like this: us near 95 to 100 percent summed across cores, id near zero, wa near zero, and sy in the low single digits. A job throttled by disk looks like: us low or moderate, id high, wa elevated. A cloud instance being oversold looks like: moderate us, high id, and nonzero st. Learning these three patterns is worth more than any amount of tool-specific tuning advice.
The Memory Lines
MiB Mem : 257906.5 total,  18342.2 free, 194563.8 used,  45000.5 buff/cache
MiB Swap:  8192.0 total,   8192.0 free,      0.0 used.  60251.9 avail Mem
Even in an article focused on CPU, these lines must be read at the same time, because memory pressure masquerades as CPU problems. If total used memory approaches total memory and the system begins swapping, the machine spends its time shuffling pages between RAM and disk rather than computing. The visible symptom in the CPU fields is low us, elevated wa, and a job that makes almost no progress. On the process rows, watch the VIRT and RES columns during genome indexing steps, since index-building stages of large-genome aligners can request far more virtual memory than the physical RAM available, and the failure mode is either an abort or severe slowdown, not a clean error message.
Reading the Process List: Columns That Matter for Bioinformatics
Below the header sits the process table. By default it is sorted by CPU usage, which conveniently means the top row is usually the process you came here to watch. The columns that matter most in bioinformatics work:
- PID, the process identifier, used for signals and for
top -p. - USER, the account that owns the process. On shared servers, sort or filter by this before assuming the load is yours.
- VIRT, virtual memory: the total address space the process has reserved, including mapped files and reserved-but-untouched regions. Always large for genome tools, rarely meaningful on its own.
- RES, resident memory: the portion actually held in physical RAM right now. This is the column that tells you whether a job fits the node.
- S, state:
Rfor running,Sfor sleeping (waiting on I/O or an event),Dfor uninterruptible disk sleep,Zfor zombie. A thread sitting inDwhile you expected it to be inRis a direct pointer to an I/O bottleneck. - %CPU, the share of one full CPU core that the process is using, multiplied by its thread count. This column is explained in depth below because it generates more confusion than any other number in
top. - %MEM, the share of physical RAM.
- TIME+, cumulative CPU time consumed since the process started, shown to hundredths of a second. Watching this column is a quiet superpower: if TIME+ barely advances between refreshes on a job you expected to be compute-heavy, the process is stalled or bottlenecked regardless of what any other column says.
- COMMAND, the program name. Press
cto toggle between the short name and the full command line with all arguments, which lets you distinguish yourbwa mem -t 16run from a labmate's-t 8run of the same tool.
Why a Single Process Shows More Than 100% CPU (IRIX Mode)
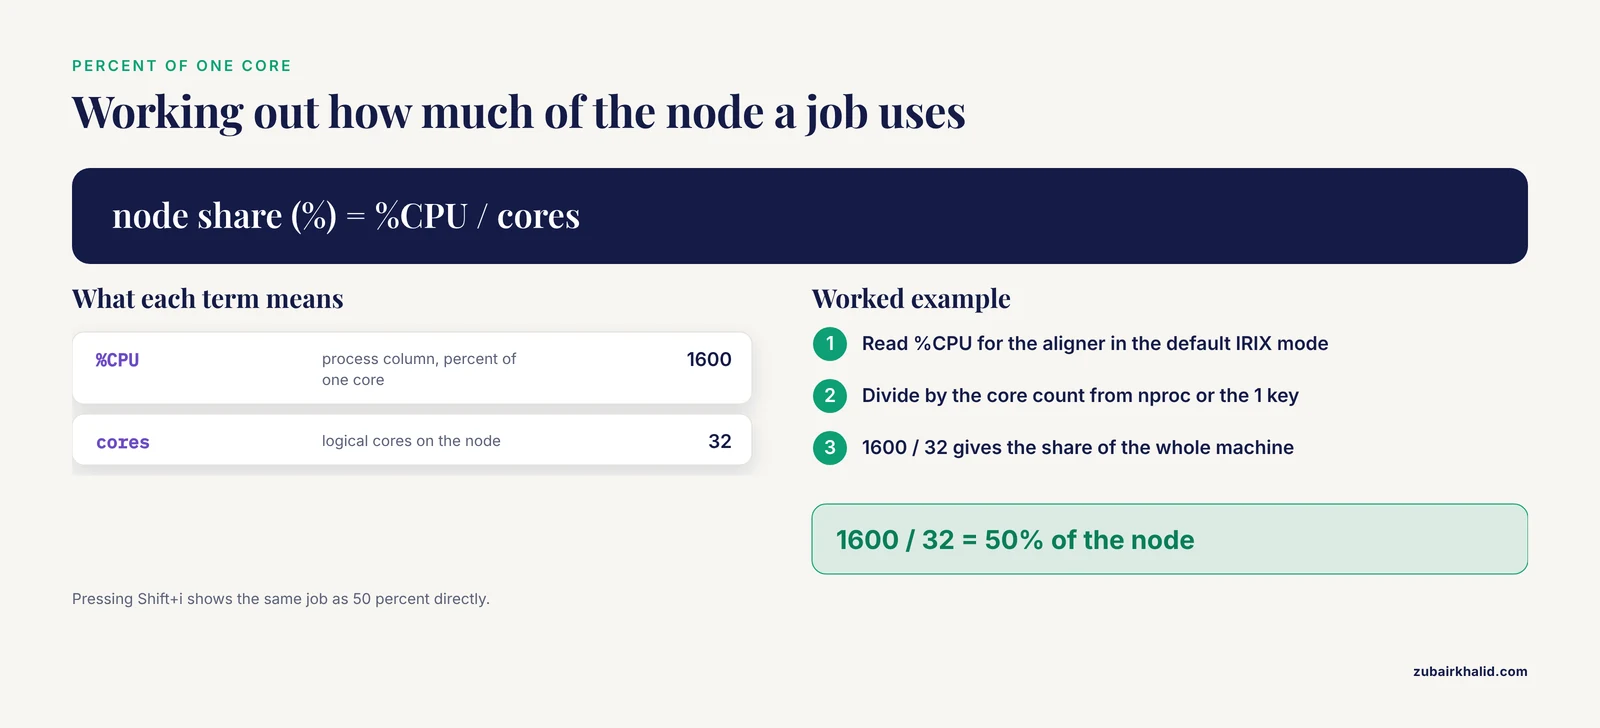
Here is the single most common interpretation question in this entire subject: what does monitor cpu usage bioinformatics top mean when it shows 1600% for one process? The answer is that %CPU is measured relative to one core, so 100 percent equals one fully busy core. A multithreaded aligner running 16 threads at full tilt reports roughly 1600 percent. On a 32-core machine, that same number tells you the job is using half the node.
This behavior comes from what top calls IRIX mode, which is the default on Linux. Pressing Shift+i toggles to the alternative display mode, in which %CPU is normalized so that 100 percent means all cores of the machine combined. In normalized mode, a fully node-saturating job reads 100 percent and a 16-thread job on a 32-core node reads 50 percent. Neither mode is wrong. Most bioinformaticians stay in the default mode and do the mental division by core count, because per-thread numbers make it easier to see whether each worker thread is actually busy.
The practical interpretation grid for a 32-core node looks like this:
| Observed %CPU for one process | Default (IRIX) mode meaning | Typical cause in a pipeline |
|---|---|---|
| 100% | One core fully busy | Single-threaded tool, or a parallel tool stuck in its serial phase |
| 3200% | 32 cores fully busy | Multithreaded job correctly consuming the whole node |
| 1500% on a -t 16 job | Half the requested threads busy | I/O bottleneck, license or lock contention, or a serial stage such as indexing |
| 0 to 2% for a long time | Job is stalled or waiting | Disk read, network mount, downsampled input finished, or a deadlock |
| Fluctuating 100% to 2900% | Threads periodically blocking | Writer or reader contention, often fixable with faster storage or more buffers |
Threads Versus Processes: Using top -H
Most bioinformatics tools implement parallelism as threads inside a single process, not as many separate processes. The default top view collapses all threads of a process into one row. Pressing Shift+h while top is running, or launching it with top -H, expands the view to one row per thread.
This view is where thread-level interpretation happens. With thread view on and the display sorted by CPU (Shift+p), a healthy 16-thread BWA-MEM alignment shows 16 rows for that process, each near 100 percent in the default mode. If instead you see 2 busy threads and 14 near zero, the parallel portion has collapsed and the job is effectively serial, which is your signal to stop it, check the input, and restart rather than wait days for a job that is not using the hardware you gave it.
Two tools make this pattern especially visible. samtools sort with -@ 8 allocates 8 threads for compression, but its initial read phase is largely single-threaded, so early monitoring shows one hot thread and later monitoring shows nine. STAR in genomeGenerate mode alternates between heavily parallel and serial phases. Knowing that these oscillations are normal prevents both premature job killing and wasted days waiting on a genuinely stuck job.
Interactive Keys for Bioinformatics Monitoring
The keys below cover nearly every monitoring need in daily practice. They are pressed while top is running, with no prefix key:
| Key | Action | Bioinformatics use |
|---|---|---|
| h | Help screen | Remind yourself of keys without quitting |
| q | Quit | |
| Space or Enter | Force immediate refresh | Check right now, mid-interval |
| Shift+p | Sort by %CPU | Default view, find the CPU hog |
| Shift+m | Sort by %MEM | Find the process that ate the node's RAM |
| Shift+t | Sort by TIME+ | Find the cumulative CPU consumer |
| 1 | Toggle aggregate vs per-core CPU lines | Verify all requested cores are active |
| Shift+h | Toggle thread view | Verify per-thread usage of a -t job |
| c | Toggle full command line | Distinguish runs of the same tool |
| u | Filter by username | Shared-server hygiene |
| k | Kill a process by PID | Stop a runaway or stuck job |
| Shift+i | Toggle IRIX (percent normalization) mode | Two ways of reading the same %CPU column |
| Shift+f | Field management screen | Add columns such as IFDOM (I/O) or nTH (thread count) |
| W | Save current settings | Persist your preferred sort and fields |
The Shift+f field manager deserves a special note. Adding the nTH column shows the number of threads per process directly in the default view, which is an instant sanity check that a -t 16 invocation produced 16 worker threads rather than 1. Adding the I/O-related columns lets you watch read and write throughput per process, which is often the actual story behind a slow bioinformatics stage.
Worked Example: Monitoring a Multithreaded Alignment Run
Consider a concrete scenario. You have a 32-core, 256 GB server, and you launch a human whole-genome alignment:
bwa mem -t 24 -R '@RG\tID:run1\tSM:sample1' GRCh38.fa sample_R1.fq.gz sample_R2.fq.gz | samtools sort -@ 6 -o aligned.bamTwo minutes in, you open top and press 1, Shift+h, and c. Here is the checklist to run through, in order:
- Count the hot threads. You expect up to 24 BWA threads near 100 percent each, plus the main BWA thread, plus sort compression threads on the second half of the pipe. If you see exactly that, CPU delivery is confirmed. The pipe between two processes means both consume CPU simultaneously, so total usage near 30 cores is expected and correct, not a runaway bug.
- Check the per-core lines. All 24 cores allocated to BWA should show roughly even
uspercentages. One core pinned at 100 percent while the rest idle suggests a serial bottleneck, which for BWA-MEM is usually the output pipe backing up because the downstream sort cannot keep pace. - Check
waon the affected cores. Ifusis low andwais elevated on the cores running the sort, the write path toaligned.bamis the bottleneck. Common real-world fixes are writing to local scratch instead of a network filesystem, or reducing the sort compression threads to free cores for the aligner. - Check RES on both processes.
samtools sortbuffers chunks in memory sized by-m, and BWA holds its index in RAM. Combined, these must fit the node alongside anything else running. If RES for sort grows toward the node's limit and swap begins to show usage, kill and restart with a smaller-mvalue distributed across the sort threads. - Watch the load average trend. With 30 of 32 cores busy, a load average in the high 20s is expected and stable. A load average climbing well above the core count with
idnear zero means something else launched on the node, and it is time to check the USER column.
Ten minutes of this routine, run in the first half hour of every large job, prevents the majority of wasted compute in a typical lab.
Monitoring Pipelines: Batch Mode and Logging
Interactive top is for watching. Batch mode is for recording, and recording is what you need when a workflow runs for three days and you later need to reconstruct what happened or compare resource profiles across pipeline versions.
The essential flags are -b for batch output, -n for the number of iterations, and -d for the delay between them:
top -b -d 60 -n 1440 > run_monitor.logThis captures one snapshot per minute for 24 hours into a plain text file. For long pipeline runs, launch this in the background alongside the job, either with a trailing ampersand in a tmux or screen session, or as a dedicated step in your workflow system:
nohup top -b -d 300 -n 576 > wgs_run_monitor.log 2>&1 &That records a snapshot every 5 minutes for 48 hours. Because each snapshot includes the timestamp, process list, load average, and CPU line, the log afterward answers questions that memory cannot: When did the job actually become multithreaded? Did the sort stage starve the aligner? Was the node shared with someone else's job during the hours the run looked slow?
For a one-time summary rather than a continuous log, a single snapshot works well and is a staple among Linux commands bioinformatics users type daily:
top -b -n 1 | head -40This prints the header and the top processes once and exits, which is ideal inside scripts, cron jobs, and cluster submission wrappers that log resource usage at job start and end. Pair it with the thread flag when you care about thread counts:
top -b -H -n 1 -p $(pgrep -f 'bwa mem' | head -1) | head -40A note on periodic watching: many people reach for looping top -b -n 1 in a shell loop. That works, but a cleaner pattern for coarse monitoring is to let a single batch invocation with -d do the timing, and reserve shell loops for cases where you want to compute derived statistics per snapshot with awk.
top in the Wider Toolkit of Linux Commands for Bioinformatics
top is the right default, but it is one member of a family, and knowing when to switch makes monitoring faster.
- htop is an enhanced interactive viewer with colored bars per core, tree views of process ancestry, mouse support, and easy scrolling. It is not installed by default on most systems but is nearly universal on managed HPC clusters via environment modules. The per-core bars in
htopmake the "is every core actually busy" question answerable at a glance, and its tree view (F5) makes the process structure of a pipeline, such as a workflow manager spawning aligner children, immediately visible. For anything beyond a quick check, many bioinformaticians prefer it. Everything diagnostic thathtopshows, however,topcan show too, which matters when you land on a minimal container or a stripped-down node where onlytopexists. - ps is for static snapshots.
ps aux, sort=-%cpu | headgives a one-shot, scriptable ranking of CPU consumers. It cannot refresh, so it complements rather than replacestop. - mpstat, from the sysstat package, reports per-core utilization over an interval, such as
mpstat -P ALL 5, and is better thantopfor capturing average behavior over minutes rather than instantaneous state. - sar, also from sysstat, records historical system activity if the collection daemon was enabled. When a user asks "why was the server slow last night,"
saris the tool with the answer, andtopis the tool for right now. - The workflow manager's own reports. Nextflow, Snakemake, Cromwell, and WDL-based systems all record resource usage per task. Those records come from the same kernel counters
topreads, but they are per-task and post-hoc.topremains the only tool that answers the live question in the moment.
A reasonable working rule: top while the job runs, htop if it is available and you want richer visuals, ps in scripts, and the workflow manager's report when the job is finished.
Summary Table: Key Fields and the Terms They Are Confused With
| Quantity in top | What it actually measures | Most often confused with | How to verify |
|---|---|---|---|
| Load average | Runnable plus uninterruptible-disk-wait processes, averaged over 1, 5, 15 min | Percent CPU used | Divide by core count from nproc, then read alongside wa |
| %CPU (process column) | Percent of one core, summed across the process's threads | Percent of the whole machine | Multiply machine %CPU by core count to compare, or toggle Shift+i |
| us | User-space compute | Total CPU busy | Add us, sy, ni, wa, hi, si, st and the sum equals 100 |
| id + wa | Idle plus idle-waiting-on-I/O | "Free capacity" you can safely claim | If wa is the large part, the free capacity is unusable for CPU-bound work |
| VIRT | Reserved address space | Memory actually used | Read RES instead |
| RES | Physical RAM currently held | Total memory the job will ever need | Watch its trend over the job's phases |
| st (steal) | Cycles a hypervisor gave to another tenant | Measurement noise | Only meaningful on VMs and cloud instances, expect near zero on bare metal |
| TIME+ | Cumulative CPU seconds consumed | Wall-clock runtime | Divide TIME+ by wall time to estimate average parallelism |
Common Misconceptions
Misconception: Load average is a percentage. It is a count of processes, not a percentage, and on a 64-core node a load average of 64 is completely healthy. The comparison target is always the core count.
Misconception: %CPU above 100 means something is broken. In the default mode, 100 percent equals one core. Multithreaded bioinformatics tools are supposed to exceed it. Only the per-core lines after pressing 1, or normalized mode after Shift+i, put the whole machine on a 0 to 100 scale.
Misconception: High wa means the CPU is the problem. Iowait means the CPU had work queued but was blocked waiting on storage. The CPU is the victim, not the culprit. The fix lives in the disk, the filesystem, the network mount, or the program's I/O pattern.
Misconception: If top shows idle cores, the tool is misconfigured. Not necessarily. Nearly every parallel bioinformatics tool has serial phases: reading compressed input, writing output, building or loading indexes, merging partial results. Short serial phases are normal and unavoidable. The concern is only when a thread count stays low through what should be the compute-heavy middle of a stage.
Misconception: Sleeping processes are wasting CPU. A thread in state S is not consuming processor time at all. Sleep is the normal state of a process waiting for its input pipe, its network call, or its next chunk of work.
Misconception: VIRT tells you whether a job fits in RAM. VIRT is mostly reserved address space, and genome tools reserve aggressively. RES is the number that reflects physical usage, and even RES is a snapshot rather than a peak.
Common Mistakes and Limitations
- Monitoring the wrong node. On scheduled clusters, running
topon the login node while your job runs elsewhere is the most common operational error in Linux for bioinformatics. Confirm your shell is on the allocated compute node before interpreting anything. - Reading one field in isolation. The three CPU-related signals, load average, summary line, and per-process column, only support correct conclusions when read together. A high load average with high
waand lowusmeans an I/O queue, not CPU saturation. - Sampling too briefly.
topshows instantaneous or short-window state. A single glance during the 30 seconds a job spends decompressing input can mislead you into thinking a 16-thread job is single-threaded. Watch for at least a minute, or through one full processing chunk, before concluding anything. - Forgetting that your monitoring consumes resources. Frequent-refresh
topon a busy node, especially with expensive field recomputation, adds a small but real load. On an oversubscribed shared server, a refresh interval of 5 seconds or longer is the considerate choice. - Killing from top reflexively. The
kkey sends SIGTERM by default, and many bioinformatics tools handle it cleanly, but some leave temporary sort files behind or exit without writing index footers. For long jobs with expensive inputs, prefer graceful cancellation through the workflow manager when possible. - Assuming
topoutput is a benchmark.topis a monitor, not a reproducible performance measurement tool. For rigorous benchmarking of pipeline changes, use dedicated timing and accounting mechanisms, and repeat measurements, because scheduler noise and cache state vary run to run. - Interpreting shared-server numbers as if you were alone. On a shared node, another user's job explains most surprising numbers. Filter with
ubefore drawing conclusions about your own job's behavior. - A limitation of the tool itself.
topreports what the kernel schedules on one machine. It has no view of GPU utilization, which matters for GPU-accelerated tools, no view of software licenses, and no awareness of which stage of a workflow is running. For GPU workloads, pair it with the vendor's own monitor.
Quick Review
- Load average is a process count, not a percentage. Judge it against the core count from
nproc, and read its 1, 5, and 15 minute trend. - The process
%CPUcolumn is per core. 1600 percent means 16 busy threads in the default mode. PressShift+ito switch to whole-machine normalization. - Press
1for per-core lines,Shift+hfor thread view,cfor full command lines,Shift+pandShift+mto sort by CPU and memory,uto filter by user. - High
uswith near-zeroidmeans the CPU is the bottleneck. Highwawith highidmeans storage is the bottleneck. Nonzeroston a cloud instance means you are being shortchanged by the hypervisor. - Watch
RES, notVIRT, for real memory usage, and watchTIME+to detect stalled compute. - Use
top -b -d 300 -n 720style batch logging to leave an auditable record of long pipeline runs. - On HPC systems, run
topon the compute node your job actually occupies, not the login node.
Frequently Asked Questions
What does monitor cpu usage bioinformatics top mean when a process shows more than 100 percent?
It means the process is using more than one CPU core. The %CPU column measures consumption relative to a single core, so 16 fully busy threads read as about 1600 percent. This is expected and healthy for tools like BWA-MEM, STAR, or samtools launched with a thread count greater than one.
How do I know how many CPU cores my machine has from inside top?
Press the 1 key to expand the CPU summary into one line per logical core and count them, or leave top and run nproc at the shell. Compare the load average against that number to judge saturation.
Why is my multithreaded bioinformatics job only using one core in top?
Most likely you are watching a serial phase such as input decompression, index loading, or output writing, which every parallel tool has. If the pattern persists through the compute-heavy middle of the stage, verify the tool actually received your thread flag, check thread view with Shift+h, and look for an I/O bottleneck in the wa field.
What is the difference between load average and CPU percentage in top?
Load average counts processes that are running or waiting to run, averaged over time, while the CPU line reports the fraction of processor time spent in each category. They diverge when processes wait on disk, because disk waits inflate load average without consuming CPU time.
How can I record CPU usage over a long bioinformatics pipeline run?
Run top in batch mode, for example top -b -d 300 -n 576 > monitor.log, which snapshots every 5 minutes for 48 hours. Start it alongside the pipeline in a background session so you have a timestamped record of load, CPU fields, and per-process usage for later review.
Is htop better than top for bioinformatics work?
htop offers per-core bar graphs, a process tree, and easier navigation, and many bioinformaticians prefer it when it is installed. top is present on essentially every Linux system, does not require installation, and can display all the same diagnostic information, so it remains the dependable default on minimal servers and containers.
Further Reading
- Advancements in rapid sludge moisture content detection: A comprehensive review of methods and online monitoring techniques.
- AntLink: A Biomimicry-Orientated System for Workflow Improvement at an Automobile Aftersales Service Centre.
- Real-time intelligence framework for microplastic monitoring and coastal resilience.
- Controlling ammonia in aquatic environments: a critical review linking monitoring, prevention, and recovery.